Introduction
The treatment paradigm for pancreatic ductal adenocarcinoma (PDAC) shifted toward neoadjuvant therapy (NAT) followed by resection for borderline resectable disease and at least partly for resectable disease [1,2]. Even in initially unresectable PDAC, conversion surgery after chemotherapy may improve survival [3]. Therefore, an increasing proportion of patients will receive neoadjuvant or induction therapy before being considered for surgery. However, unfortunately, the method to accurately assess the NAT response of PDAC is not yet established.
Just like other solid tumors, Response Evaluation Criteria in Solid Tumors (RECIST) ver. 1.1 has been used to evaluate the NAT response of PDAC. However, RECIST is not the best surrogate marker of survival in certain types of tumors or treatment modalities. Therefore, some alternative criteria have been proposed, such as the Choi criteria for gastrointestinal stromal tumors, modified RECIST for hepatocellular carcinomas, and immune RECIST (iRECIST) for immune-based therapeutics. Regarding PDAC, a recent study showed that survival of the patients who underwent post-NAT pancreatectomy was not associated with RECIST response [4] and survival did not differ between partial response and stable disease groups in nonmetastatic PDACs [5]. It may be related to the unique characteristics of PDAC, that fibroinflammatory tissue replacement secondary to NAT remains as soft tissue attenuation on computed tomography (CT) which is indistinguishable to the residual tumor [6] and characteristic non-expanding growth pattern of PDAC [7,8].
Recent studies showed that extended duration of chemotherapy, optimal post-chemotherapy carbohydrate antigen (CA) 19-9 response, and major pathologic response were favorable survival factors [9]; preoperative CA19-9 level, lymph node involvement, metastasis category, and vascular involvement were good overall survival (OS) factors [10]. However, many baseline and pre-surgery CT findings, and the changes during the interval, were not comprehensively investigated yet. Moreover, clinical survival criteria incorporating both CT and clinical preoperative factors was not developed. Therefore, we conducted this study to identify preoperative clinical or CT prognostic factors associated with OS and recurrence-free survival (RFS) in PDAC patients undergoing curative-intent post-NAT surgery and develop risk stratification criteria to aid decision-making.
Materials and Methods
This single-center retrospective observational study was performed at Severance Hospital, a tertiary high-volume institution. The institutional review board approved this study and waived the requirement for written informed consent.
1. Study population
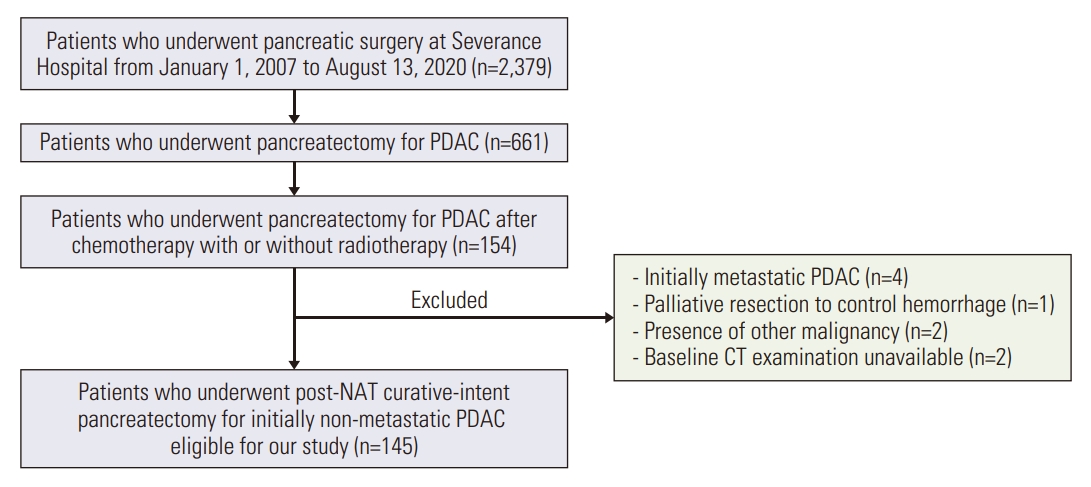
We retrospectively and consecutively identified 2,379 patients who underwent pancreatic surgeries at Severance Hospital from January 1, 2007, to August 13, 2020. Inclusion criteria were as follows: patients who (1) underwent pancreatectomy for PDAC; (2) received NAT with or without radiotherapy. One-hundred-and-fifty-four patients were identified. Nine patients were excluded: initially metastatic PDAC (n=4); palliative resection to control hemorrhage (n=1); presence of other malignancy (n=2); and baseline CT examination unavailable (n=2). Finally, 145 patients were included (Fig. 1).
2. Clinical, surgical, and pathologic variables
Demographic, laboratory, treatment history, and histopathologic variables were collected from the electronic records by a study coordinator (G.E.) under the guidance of a radiologist (H.K.Y.). Laboratory variables, including serum CA19-9, carcinoembryonic antigen (CEA), and total bilirubin, were routinely measured at baseline and before the decision to perform surgery, and the interval change of each laboratory value was calculated. Lewis antigen status was collected for the patients whose baseline CA19-9 was not elevated [11]. Treatment history included the type and duration of NAT, type of pancreatic surgery, and postoperative adjuvant therapy.
Histopathologic data included resection margin status, tumor differentiation grade, and pathologic TNM staging. A positive resection margin (R1 resection) was defined as when tumor cells were present at the cut-resection margins or within 1 mm from the circumferential resection margins using the British Royal College of Pathology guidelines [12]. Pathologic TNM staging was based on the American Joint Commission on Cancer (AJCC) Cancer Staging Manual, 8th edition.
3. Oncologic outcome measures
Our primary outcome was OS, defined as the time from baseline CT to death, with final evaluation on September 22, 2020. Our secondary outcome was RFS, the time from surgery to recurrence. Recurrence was diagnosed by clinicoradiologic evidence or histologic confirmation. When development of recurrence was suspected but not certain on a single imaging study, it was finally diagnosed when interval growth was noted or at least another imaging modality, i.e., magnetic resonance imaging or positron emission tomography–computed tomography, added evidence supportive of recurrence. The time of recurrence was defined as the date of the imaging study where the suspicious lesion was first noticeable in retrospect.
4. CT technique
Pancreatic CT was performed as recommended by the National Comprehensive Cancer Network (NCCN) guidelines [13]. CT images were obtained using multidetector row CT scanners. The scanning protocol included unenhanced and contrast-enhanced biphasic imaging in the pancreatic and portal venous phases after intravenous administration of iopamidol (Iopamiro 370, Bracco, Milan, Italy) at a rate of 1.6-4.0 mL/sec depending on the patient’s body weight. Pancreatic and portal venous phase images were obtained by adding 23 seconds to the time of peak abdominal aortic enhancement calculated at the hepatic hilum, and 25 seconds to the end of the pancreatic phase, respectively. Reconstructed slice thickness and interval were 3 mm and 3 mm for both transverse and coronal images.
5. Assessment of CT findings
Two gastrointestinal radiologists (M-S.P. and H.K.Y., with 21 and 5 years of specialized experience in gastrointestinal imaging, respectively) retrospectively and independently reviewed the images. They were blinded to clinical, laboratory, histopathologic, and follow-up results but knew that the patients were treated for PDAC. CT findings were selected from the parameters in the PDAC radiology reporting template proposed by the Society of Abdominal Radiology and the American Pancreatic Association [14]: tumor size, individual tumor-vessel contact (no contact, abutment [≤ 180°], or encasement [> 180°]) and venous stenosis, resectability status as per NCCN Guidelines, presence of suspicious lymph nodes, and invasion to the stomach or duodenum. The tumor diameter was measured on the transverse plane. Each finding was assessed on CTs both at baseline and preoperatively, and then the interval change of the finding was evaluated. We regarded that there was decrease in tumor size and/or tumor-vessel contact when “any degree of radiologic improvement in tumor size and/or tumor-vessel contact” was present [15,16]. To maintain objectivity, radiologic improvement in tumor size was regarded to be present when there was approximately ≥ 3 mm decrease in tumor diameter since baseline. After independent image review, interobserver agreement was evaluated. In the survival analyses, the consensus results of the two radiologists regarding the qualitative features were used.
6. Statistical analysis
Univariable Cox proportional hazard analyses were performed to determine potentially significant factors for OS and RFS. Multivariable Cox proportional hazard analyses were performed using the variables that showed p < 0.05 in each univariable analysis. While individual tumor-vessel contact was assessed, collective perivascular assessment results (i.e., changes in tumor-any artery contact and tumorany vein contact or venous stenosis, NCCN resectability at baseline and preoperative CT, and change in the resectability) were used in the multivariable analysis to enhance applicability in practice. Risk stratification criteria, i.e., postNAT response criteria, were proposed using the independent preoperative predictors from the multivariable analyses for OS. Kaplan-Meier survival analysis and log-rank test were performed for the criteria. The discrimination performances of the post-NAT response criteria and post-NAT pathological (yp) TNM staging were evaluated using Harrell’s C-index [17]. The difference in C-indices and 95% confidence interval (CI) of the calibration curve were estimated using bootstrap with 1,000 resampling. The calibration performance was evaluated using a calibration plot of the predicted and observed 3-year OS.
Interobserver agreement for the qualitative CT findings was evaluated with percentage of agreement and Cohen’s kappa coefficient. The kappa value (the level of agreement) was defined as follows: 0.00-0.20, poor; 0.21-0.40, fair; 0.41-0.60, moderate; 0.61-0.80, good; and 0.81-1.00, excellent. As the magnitude of kappa is affected by the prevalence of the attribute [18], some findings of low prevalence were better assessed with percentage of agreement. Interobserver agreement for the quantitative CT findings was evaluated with intraclass correlation coefficient. p < 0.05 was considered to be statistically significant. All statistical analyses were performed by MedCalc for Windows, ver. 20.014 (MedCalc Software, Ostend, Belgium) and R software (ver. 4.1.1., http://www.R-project.org/, Vienna, Austria).
7. Internal validation
We divided the study sample into the development and test sets to perform internal validation (S1 Fig.). Details are in Supplementary Material.
Results
1. Clinical, surgical, and pathologic characteristics, and oncologic outcomes of the study population
One-hundred-and-forty-five patients (mean age±standard deviation, 60.8±8.8 years; 80 men and 65 women) with PDAC who underwent curative-intent pancreatic surgery after NAT with (n=98, 67.6%) or without (n=47, 32.4%) radiotherapy were analyzed. 8.3% (12/145) of the patients with locally advanced PDAC received conversion therapy. All the 145 patients completed chemo-(FOLFIRINOX, n=36; modified FOLFIRINOX, n=5; gemcitabine and cisplatin, n=1; gemcitabine and erlotinib, n=2; gemcitabine and nab-paclitaxel, n=3) or chemoradiation therapy (n=98). The interval from the baseline CT to surgery was 6.6±5.8 months. In 34.5% (50/145) of the patients, the baseline serum CA19-9 levels were not elevated, i.e., < 37 U/mL. Forty-eight of the 50 patients in whom the baseline CA19-9 levels were not elevated were Lewis-negative phenotype; Lewis a/b (–/–) in 31, (–/+) in 16, and (+/–) in one patient(s); and the status was unknown for the remaining two patients. Initially elevated CA19-9 normalized in 47.4% (45/95) and remained elevated in 52.6% (50/95). R0 resection was performed in 67.6% (98/145). The median OS and RFS were 36.2 (95% CI, 25.8 to 55.5) and 12.0 (95% CI, 10.7 to 19.0) months, respectively. The other data are listed in Table 1.
2. CT findings
The mean diameter of PDACs was 29.8±11.9 mm on the baseline CT and 20.8±10.9 mm on the preoperative CT. A decrease in tumor size was noted in 68.3% (99/145) of the patients. At baseline, resectable, borderline resectable, and locally advanced cases were 49.7% (72/145), 42.1% (61/145), and 8.3% (12/145) of the entire population, respectively; at preoperative CT, they were 53.1% (77/145), 42.1% (61/145), and 4.8% (7/145). A suspicious node was present in 37.2% (54/145) of the patients at baseline and 27.6% (40/145) at preoperative CT. Tumor invasion to the stomach or duodenum was noted in 24.8% (36/145) of the patients at baseline and 21.4% (31/145) at preoperative CT.
3. Preoperative predictors of survival
(1) Overall survival
In univariable analysis, CA19-9 response to NAT, interval from baseline CT to surgery, change in tumor size, change in tumor-any artery contact, change in tumor-any vein contact or venous stenosis, presence of suspicious node at the preoperative stage, invasion to the stomach or duodenum at baseline, and preoperative stage were significant predictors (Table 2). In multivariable analysis, elevated preoperative CA19-9 level (hazard ratio [HR], 1.98; 95% CI, 1.11 to 3.55; p=0.021) and stable or increased tumor size on CT (HR, 2.58; 95% CI, 1.58 to 4.21; p < 0.001) were significant independent predictors (Table 2).
(2) Recurrence-free survival
In univariable analysis, CA19-9 response to NAT, preoperative CEA level, tumor diameter at baseline, change in tumor size, change in tumor-any artery contact, change in tumor-any vein contact or venous stenosis, preoperative NCCN resectability stage, invasion to stomach or duodenum at baseline and preoperative stage were significant predictors (Table 3). In multivariable analysis, tumor diameter at baseline (HR, 1.03; 95% CI, 1.01 to 1.04; p=0.002), change in tumor size (HR, 2.39; 95% CI, 1.45 to 3.95; p < 0.001), increase in tumor-any vein contact or stenosis (HR, 5.29; 95% CI, 1.51 to 18.59; p=0.009) were significant independent predictors (Table 3).
4. Discrimination performance of post-NAT response criteria compared with yp AJCC TNM staging
(1) Total population
The population was categorized according to the following response criteria: I, low-risk, decreased tumor size and normal preoperative CA19-9 (49.7%, 72/145) (S2 Fig.); IIA, low intermediate-risk, decreased tumor size and elevated preoperative CA19-9 (18.6%, 27/145); IIB, high intermediate-risk, stable or increased tumor size and normal preoperative CA19-9 (15.9%, 23/145); III, high-risk, stable or increased tumor size and elevated preoperative CA19-9 (15.9%, 23/145) (S3 Fig.). Significant difference in OS was noted between the subgroups in log-rank test (p < 0.001) (Fig. 2A).
The population was also categorized into one of the five ypTNM stages: 0 (9.9%, 14/141); I (52.5%, 74/141); II (26.2%, 37/141); III (2.8%, 4/141); IV (8.5%, 12/141) (Fig. 2B). Harrell’s C-indices for OS of the response criteria was 0.712 (95% CI, 0.660 to 0.760) and that of ypTNM staging was 0.644 (95% CI, 0.582 to 0.711), showing no significant difference (0.068; 95% CI, –0.012 to 0.142) (Table 4). Calibration plots of the response criteria and ypTNM staging demonstrated good correlation between the predicted and actual probabilities of a 3-year OS (Fig. 2C and D).
After NAT, in the low-risk group, 58% (42/72) and 42% (30/72) of the patients were of resectable and borderline resectable or locally advanced diseases, respectively; in the intermediate-risk group, 48% (24/50) and 52% (26/50); in the high-risk group, 48% (11/23) and 52% (12/23).
(2) Lewis-positive subgroup analysis
The 95 patients with elevated CA19-9 at baseline who were also Lewis-positive were categorized; I, low-risk, decreased tumor size and normalized CA19-9 (37.9%, 36/95); II, intermediate-risk, stable or increased tumor size or elevated preoperative CA19-9 (38.0%, 36/95); III, high-risk, stable or increased tumor size and elevated preoperative CA19-9 (24.2%, 23/95). Significant differences were noted in OS (p < 0.001) (S4A Fig.) and RFS (p < 0.001) (S4B Fig.) in the log-rank test. The population was also categorized into one of the five ypTNM stages (S4C Fig.): 0 (10.9%, 10/92); I (48.9%, 45/92); II (27.2%, 25/92); III (3.3%, 3/92); IV (9.8%, 9/92). Harrell’s C-indices for OS of the response criteria was 0.716 (95% CI, 0.659 to 0.777), significantly higher than that of ypTNM staging, 0.637 (95% CI, 0.548 to 0.714). The difference of the two C-indices was 0.079 (95% CI, 0.002 to 0.180) (Table 4). Calibration plots of the response criteria and ypTNM staging demonstrated good correlation between the predicted and actual probabilities of a 3-year OS.
5. Internal validation
Clinical, surgical, and pathological characteristics, and oncologic outcomes of the development and test sets are compared in S5 Table. Significantly higher proportions of patients showed radiologic improvement after NAT regarding various CT findings in the test set compared to the development set (S6 Table). Cox survival analysis of preand perioperative predictors of OS using the development set showed elevated preoperative CA19-9 and stable or increased tumor size on CT were significant independent poor predictors (S7 Table). Harrell’s C-indices of the postNAT response criteria and ypTNM staging did not significantly differ in the development and test sets. There were significant differences in OS and RFS between the groups stratified by post-NAT response criteria. The detailed results are in Supplementary Material.
Discussion
In our study, “any degree of decrease in CT tumor size” and CA19-9 response to NAT were independent favorable factors of OS in PDAC patients who underwent curative-intent resection after NAT. The post-NAT response criteria composed of the two factors showed good discrimination performance for OS, with a Harrell’s C-index of 0.712, comparable to the yp AJCC TNM staging that showed a C-index of 0.644. The changes in CT tumor size and CA19-9 after NAT conceivably reflect the change in biological aggressiveness of PDACs.
Our study suggests that any degree of decrease in tumor diameter is favorable prognostically. Our results contradict the existing notion that assessments of tumor size change on CT of borderline resectable PDACs after NAT do not effectively discriminate patients who would benefit from surgery. This may be due to the difference in cutoffs for NAT-responsive tumor size decrease. For instance, Katz et al. [4] reported that the OS of patients who underwent pancreatectomy was not associated with the response defined by the RECIST guideline, ver. 1.1 [19], and concluded that the RECIST response was not an effective treatment endpoint for borderline resectable PDACs. A meta-analysis reported that although most (67%) of the patients showed stable disease on RECIST criteria after NAT, 60% still underwent surgery with a R0 rate of 88% [20]. Therefore, the authors suggested that besides reduction of tumors, stable disease may also predict resectability. Given our results and the previous literature, “any degree of radiologic improvement in tumor size [15]” should be seen as a favorable treatment response, rather than the RECIST criteria of partial response, i.e., ≥ 30% decrease in diameter since baseline. Additionally, this is the first study to suggest the rough cutoff for tumor size decrease [16].
In concert with our results, CA19-9 decrease has been suggested to be an effective NAT response surrogate [9,10,21,22]. However, there are limitations to using CA19-9 as a prognostic biomarker, including false negativity in Lewis-negative phenotype [23,24] and false positivity in obstructive jaundice or pancreatitis [25,26]. Lewis antigens are sialylated blood group epitopes that coat CA19-9 and are composed of three main types including Lewis antigen A positive [Le(a+b–)], Lewis antigen B positive−[Le(ab+)], and Le(a–b–). Lewis antigen phenotype is determined mainly by Lewis and Secretor genes. Lewis antigen-negative individuals cannot produce CA19-9. Therefore, for the Lewis-negative phenotype patients, researchers investigated alternative biomarkers [27,28]. In our results, the C-indices of our post-NAT response criteria were similar in the total study population and the Lewis-positive subgroup. Therefore, integrating changes in CT tumor size and CA19-9 at least partly overcomes the limitation of CA19-9 for the Lewis-negative phenotype. Regarding potential false positivity in obstructive jaundice, obstructive jaundice has a relatively little effect in elevating CA19-9 than PDAC itself. In the previous literatures, the median CA19-9 level was lower in benign cases than those with pancreatobiliary tumors [25] and CA19-9 levels had no significant declining trend or even went up in a considerable portion of the malignant patients after biliary decompression [29].
In our results, decrease in tumor size was the favorable factor of both OS and RFS. On the other hand, CA19-9 response to NAT was an independent prognostic factor of OS but not that of RFS; change in tumor-any vein contact or stenosis was an independent prognostic factor of RFS but not that of OS. We believe those results are in keeping with the understanding CA19-9 response represents change in serologic tumor aggressiveness and change in tumor-vein relationship is related to change in local tumor extent.
In addition, our results suggested that R1 resection after NAT was not a significantly poor factor of OS. The R status of the upfront surgery has been shown to be an important independent survival predictor [30]. However, after NAT, there is growing evidence that the R status has less impact on OS. For example, Klaiber et al. [10] showed that the R status was not an independent survival predictor; another study indicated that the predictive survival value of lymph node involvement may outweigh the potential survival impact of the R status [31]. We believe that R1 resection alone does not significantly worsen the prognosis in cases where the disease extent was stable enough to consider surgery after NAT. This needs to be validated by further studies.
In our study, “any degree of decrease in tumor-vessel contact” was not a significantly favorable factor for OS. The response evaluation of PDAC to NAT to determine resectability based on tumor-vessel contact is known to be particularly challenging, because it is difficult to distinguish perivascular post-NAT fibroinflammatory tissue with residual tumor on CT [6]. Meanwhile, Cassinotto et al. [32] reported that partial regression of tumor-vessel contact was associated with R0 resection [15,16]. The possible reasons for the discrepancy between their results and ours are the differences in the two study populations and the endpoints. In the Cassinotto et al.’s study [32], all patients had locally advanced PDAC at the time of diagnosis, whereas we included not only locally advanced but also resectable and borderline resectable cases. As a prospective study, Cassinotto et al. [32] also included patients who underwent surgical exploration without actual resection. In addition, their endpoint was R0 resection, whereas ours was survival. In our results, neither R0 resection nor any degree of decrease in tumor-vessel contact was a prognostic factor for survival.
There were limitations to our study. First, because our study was retrospective, there is an inherent selection bias, where we only included patients who underwent curative-intent resection. Those who did not undergo surgery, presumably related to NAT-unresponsive PDAC or poor general medical condition, were not included in our study. Therefore, caution is required when our results are applied to those patients. Further studies, e.g., a prospective study comparing the effect of surgery versus maintaining chemotherapy in patients who show response to NAT in terms of tumor size and CA19-9 level but remain unresectable on post-NAT CT, are needed. Second, there are variability and constant changes in regimens and dosing of chemotherapy and technology of radiotherapy. Third, the interobserver agreement of the CT findings was not robust. Forth, external validation of our post-NAT response criteria was not performed due to the difficulty in obtaining the data from external institutions. Further studies on interobserver agreement and validation will be beneficial. Last, the cohort of our study was heterogeneous, including resectable, borderline resectable, and locally advanced diseases.
In conclusion, any degree of decrease in CT tumor size and CA19-9 response to NAT were independent favorable predictors of survival in PDAC patients who underwent curative-intent resection after NAT. Decrease in CT tumor size was also one of the favorable predictors of RFS. Post-NAT response criteria composed of the two factors, i.e., changes in CT tumor size and CA19-9 level, stratified OS to comparable levels to ypTNM staging. In detail, the group with decrease in tumor size without CA19-9 normalization showed better OS than those with normal preoperative CA19-9 and without decrease in tumor size. We propose the NAT response evaluation can aid decision-making.