Introduction
Breast cancer is the most common cancer affecting women worldwide [1]. More than 22,000 new cases are diagnosed annually in Korea, and the 5-year relative survival rate of breast cancer has exceeded 90% since 2006, indicating a longer life expectancy after cancer diagnosis [2]. As the number of women with a history of breast cancer has steadily increased [2], breast cancer survivors have piqued a growing interest in terms of living beyond their cancer diagnosis. Breast cancer survivors are at an increased risk of developing secondary cancers [3] or chronic diseases after treatment [4]. Thus, professionals recommend that breast cancer survivors undergo regular health screenings regularly [5]. Recent guidelines for Breast Cancer Survivorship Care recommend physical examinations every 3-6 months for the first 3 years following primary treatment, followed by annual checkups for the subsequent 2 years [6]. Additionally, breast cancer survivors are advised to undergo screening for other types of cancer similar to those in the general population [6]. Regarding breast cancer screening, specifically among breast cancer survivors, annual mammography is recommended for women who have undergone unilateral mastectomy or lumpectomies [6]. However, the current practice on health-screening recommendations for breast cancer survivors vary across professional societies [6]. Statistical analyses of the health-screening behavior of patients with breast cancer after diagnosis at the population level are limited.
In Korea, national health screening is an essential component of national health promotion programs, and general health checkup is provided for almost the entire population annually or biennially, depending on the labor type. In addition to general health checkup, screening for specific cancers within target populations is provided under the National Cancer Screening Program (NCSP), which was launched in 1999 [7]. As part of the NCSP, all Koreans are eligible to participate in the NCSP once they reach a certain age [8]. Although general screening guidelines have been comprehensively developed and updated for the general population, screening guidelines for cancer survivors, including breast cancer survivors, are yet to be established.
Given the increasing number of breast cancer survivors in Korea and worldwide, monitoring patterns of participation in health screening is essential and might help develop appropriate screening guidelines for breast cancer survivors. This study aimed to assess the uptake of health screening after breast cancer diagnosis, including general health checkup and screening for breast, gastric, colorectal, and cervical cancers, among women with a history of breast cancer in Korea. Temporal trends in the aforementioned screenings were assessed between 2009 and 2016.
Materials and Methods
1. Study population, data sources, and settings
This study used a customized database retrieved from the Korean National Health Insurance Service (NHIS). NHIS is a mandatory health insurance system for the Korean population. Information on demographics, medical use, general health checkup, and screening of the Korean population, including the NCSP, is available in the NHIS database. In Korea, general health checkup is provided from the age of 40 and was further expanded in 2019 to include individuals aged ≥ 20 years. Additionally, under the NCSP, all Koreans aged ≥ 40 years are offered mammography for breast cancer (only women) and esophagogastroduodenoscopy or an upper gastrointestinal series for gastric cancer screening (both men and women). For colorectal cancer (CRC) screening, all men and women in Korea aged ≥ 50 years are eligible for an annual fecal occult blood test [9]. Women aged ≥ 30 years have been eligible for a biennial Pap smear test for cervical cancer screening since 2002, and the eligibility was expanded to women aged ≥ 20 years in 2016 [9].
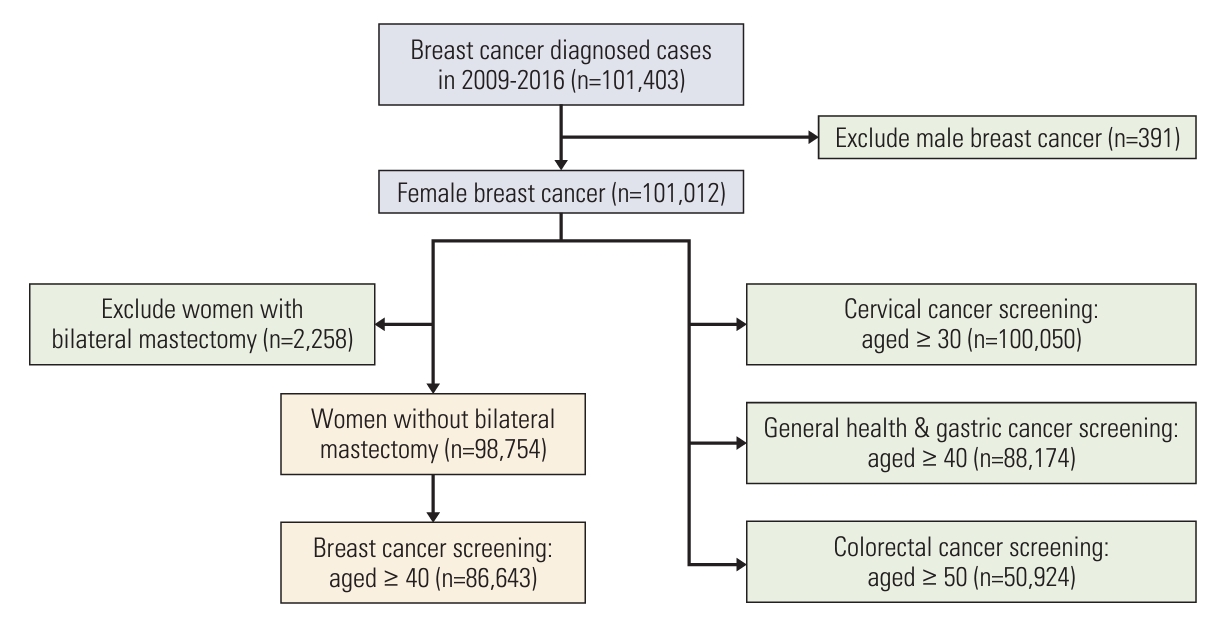
The target population for this study included women diagnosed with breast cancer between 2009 and 2016. We defined breast cancer cases using a combination of disease codes from the International Classification of Diseases (ICD)-10 for invasive breast cancer (IBC) (C50.0-C50.9) and ductal carcinoma in situ (DCIS) (D05.0-D05.9), as well as catastrophic illness codes for cancer patients. Based on this operational definition, 101,403 breast cancer cases were extracted from the NHIS database (Fig. 1). Of them, 391 male patients with breast cancer were excluded from the analysis.
Information regarding participants’ adherence to health and cancer screening (breast, gastric, colorectal, and cervical cancers) between 2009 and 2020 was extracted from the database (S1 Fig.). We further included participants according to their eligible starting age for each screening type, as described above (Fig. 1). The study analyzed the following datasets: (1) 100,050 women aged ≥ 30 years, which is the eligible age for cervical cancer screening; (2) 88,174 women aged ≥ 40 years for general health checkup and gastric cancer screening; and (3) 50,924 women aged ≥ 50 years for CRC screening. For breast cancer screening, we calculated the screening participation rate in women aged ≥ 40 years after excluding women who had undergone bilateral mastectomy (n=86,643).
2. Outcome
The primary outcome was the uptake of general health checkup and cancer screening, including screening for breast, gastric, CRC, and cervical cancers, after breast cancer diagnosis. Screening uptake was divided into the first 2 and 5 years after being diagnosed with breast cancer. The 5-year period was selected, with the last year of diagnosis set to 2016 and a follow-up for screening data available up to 2020. As the current study focused on screening post-cancer diagnosis, only general health checkup and cancer screening ≥ 6 months after cancer diagnosis were included.
3. Assessment of other variables
The following variables were included in our analysis: age at cancer diagnosis, income level, place of residence, type of breast cancer, and method of breast cancer diagnosis. For the income level, we used the percentile group of income levels categorized based on the Korean National Health Insurance premium, with a higher premium indicating a higher income. The original income level variable included 20 quartiles and was further categorized into four groups: (1) Medical Aid (rank 0) and ranks 1 to 5; (2) ranks 6 to 10; (3) ranks 11 to 15, and (4) ranks 16 to 20. The place of residence was divided into metropolitan (including the capital city of Seoul and six metropolitan cities: Busan, Daegu, Incheon, Gwangju, Daejeon, and Ulsan) and non-metropolitan areas. Breast cancer types included IBC and DCIS. For breast cancer diagnosis, we assessed whether it was diagnosed through mammography for the breast cancer screening program under the NCSP. Breast cancer cases diagnosed within 6 months after mammography screening were defined as screen-detected cases, as defined in a previous study [10], while the remaining cases were classified as non-screen-detected cases.
4. Analysis
The screening rate of participants who underwent screening within the first 2 and 5 years after diagnosis of breast cancer was calculated. As information for screening was obtained up until 2020, the screening participation rates were calculated on a single-year basis, based on the breast cancer diagnosis year: screening within the first 2 years was calculated for those diagnosed during 2009-2016, and screening within the first 5 years was calculated for those diagnosed during 2009-2015. The screening participation rate was defined as the percentage of women who underwent screening among the total number of breast cancer cases diagnosed within 2 or 5 years of the initial diagnosis each year. The participation rates for each screening type were calculated for the total population according to the survivors’ age at diagnosis, income level, place of residence, breast cancer type, and method of diagnosis.
To quantify trends in screening participation rates over the study period and calculate the annual percentage change (APC) [11], we used joinpoint regression models in the National Cancer Institute’s Joinpoint Regression Program software (Joinpoint Regression Program ver. 4.8.01; National Cancer Institute). Because a minimum of seven data points are required for a joinpoint, we set a maximum of one joinpoint for each analysis. The APC was calculated by fitting a single regression line on a log scale over a fixed interval, whereas the average APC (AAPC) was the weighted average of the APCs from the joinpoint model. A joint point of zero indicates that the APC values are equal to those of AAPC. The Monte Carlo Permutation method was used to test for statistically significant differences between each segment’s trend. All analyses, other than joinpoint regression, were performed using SAS ver. 9.4 (SAS Institute Inc., Cary, NC). A two-sided p < 0.05 was considered statistically significant.
Results
The characteristics of the study population are shown in Table 1. Of the total women diagnosed with breast cancer in Korea between 2009 and 2016, those who underwent at least one screening after breast cancer diagnosis to December 31, 2020, were 65.4% (57,684 over 88,174) for general health checkup, 64.5% (56,904 over 88,174) for gastric cancer screening, 60.2% (30,662 over 50,924) for CRC screening, 62.2% (62,237 over 100,050) for cervical cancer screening, and 39.2% (33,973 over 86,643) for breast cancer screening (data not shown because individuals’ observation periods were different according to the date of cancer diagnosis). The mean age of women diagnosed with breast cancer between 2009 and 2016 was 51.5 years old with the highest proportion of women aged 40-49 years (37.2%). We found that 74.4% of the participants lived in metropolitan areas. In total, 84.2% of breast cancers were diagnosed using IBC, and 76.1% of the breast cancers were detected through breast cancer screening.
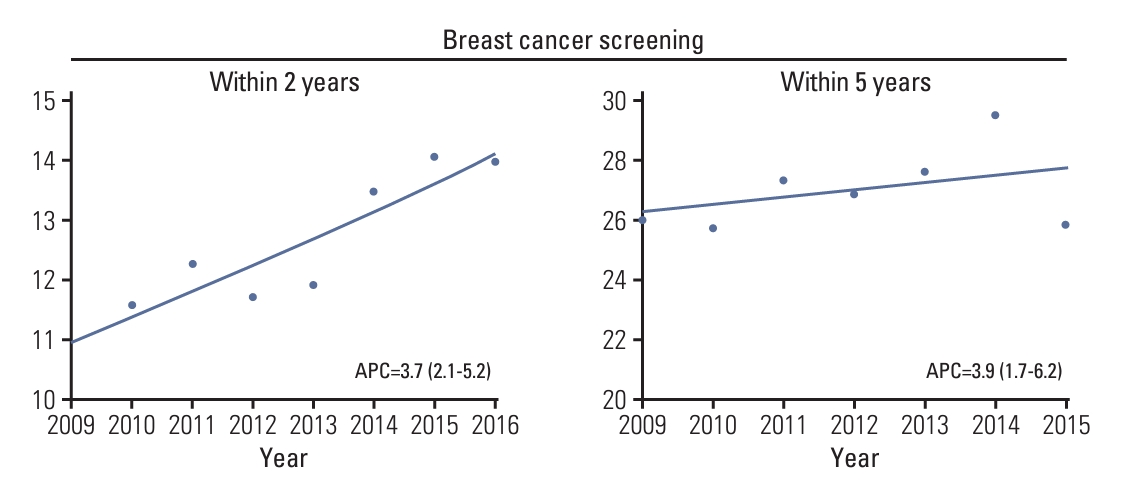
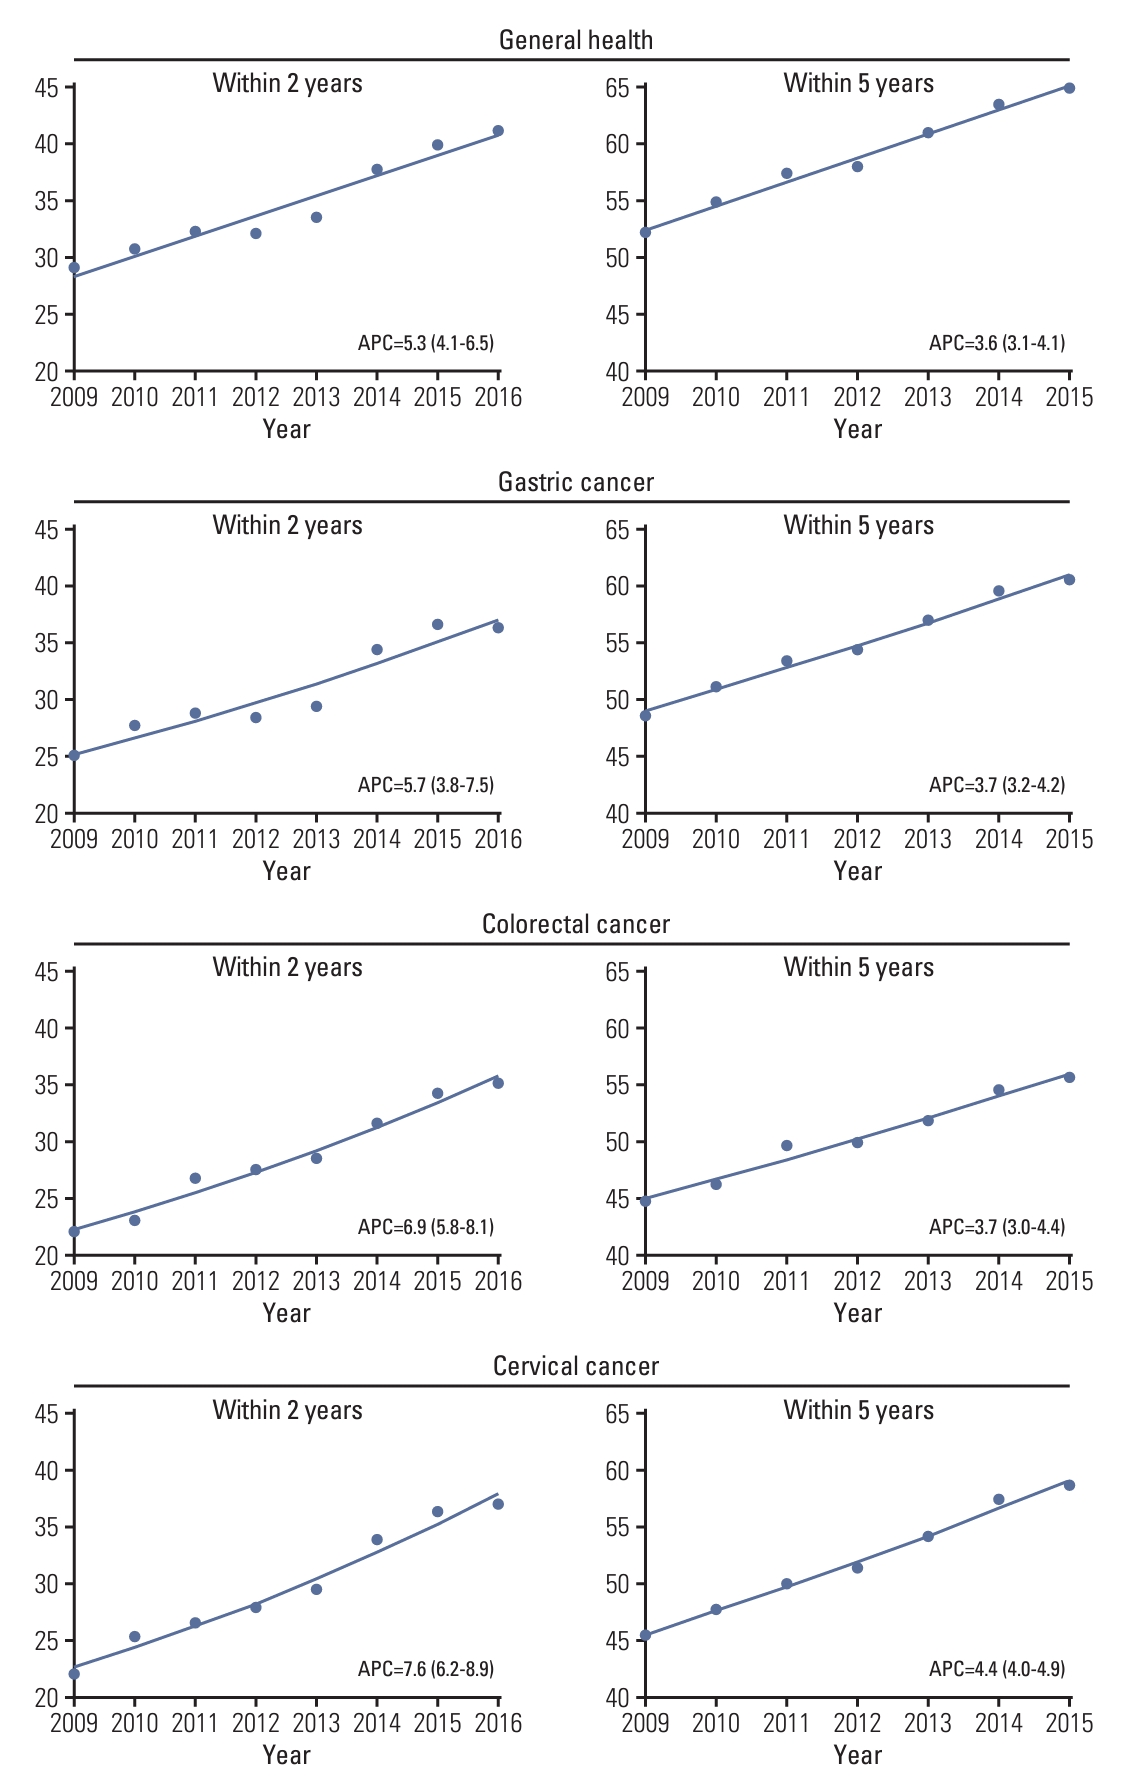
Overall, the breast cancer screening participation rate within a 2-year postdiagnosis gradually increased from 10.9% in 2009 to 14.0% in 2016 (APC of 3.7%; 95% confidence interval [CI], 2.1 to 5.2) (Fig. 2, S2 Table). However, for screening participation within 5 years postdiagnosis, the screening rate gradually increased from 26.0% in 2009 to 29.5% in 2014 but then suddenly decreased to 25.8% in 2015. The general health checkup participation rate within 2 years of diagnosis gradually increased from 29.0% in 2009 to 41.2% in 2016 (Fig. 3, S2 Table). The general health checkup within 5 years after diagnosis also increased from 52.6% to 63.5%, with a 3.6% annual increase (95% CI, 3.1 to 4.1) between 2009 and 2015. Screening for other cancers increased during the study period. In gastric cancer, the participation rate within 2 years postdiagnosis increased from 25.0% in 2009 to 36.4% in 2016 (APC of 5.7%; 95% CI, 3.8 to 7.5), and screening participation within 5 years postdiagnosis increased from 48.5% to 60.5% during 2009-2015 with an APC of 3.7% (95% CI, 3.2 to 4.2). A similar upward trend from 22.1% to 35.2% within 2 years screening and from 44.7% to 55.7% within 5-year screening was observed in the participation rate for CRC. The APC of screening within 2-year screening and 5-year screening was 6.9% (95% CI, 5.8 to 8.1) and 3.7% (95% CI, 3.0 to 4.4), respectively. For cervical cancer screening, an overall increasing trend was also observed, with screening rates ranging from 22.0% in 2009 to 36.9% in 2016 for screening within 2 years postdiagnosis and 45.4% in 2009 to 58.8% in 2016 for screening within 5 years postdiagnosis. However, despite this increasing trend, the 2-year screening rate for each type was less than 40% and that for the 5-year screening period was 60% or less in 2015. The proportion of screening participants and their time trends varied according to age group (Table 2). In all screening modalities, the screening rate of participants aged 70 years was much lower than that of the younger participants. The breast cancer screening rate within 2 years increased in younger age groups, including age groups 40-49 years (APC of 5.6%; 95% CI, 2.9 to 8.4) and 50-59 years (APC of 3.2%; 95% CI, 1.4 to 4.7) but not older age groups. Likewise, the 5-year breast cancer screening rate increased in only the age group 40-49 years with an APC of 3.2% (95% CI, 0.3 to 6.1). The overall breast cancer screening rate was the lowest among all age groups compared to other types of cancer screening or general screening.
Regarding general health checkup, a significant increase in screening participation was seen within 5 years after diagnosis, with an annual increase of 4.2% in the 40-49 age group and an increase of 4.7% in the ≥ 70 age group. Gastric cancer screening increased in all age groups, with the highest increase in APC observed in the 40-49 age group. Increases in CRC screening were more prominent in the older age groups. The cervical cancer screening participation rate was highest among breast cancer survivors aged 50–59 years and lowest among women aged ≥ 70 years. A significant increase in the cervical cancer screening participation rate was observed in all age groups, especially within the 2-year postdiagnosis screening APC, ranging from 6.1% in the 60-69 years age group to an 11.0% increase in the 30-39 years age group.
Discussion
Given Korea’s well-organized health delivery system, in terms of general health checkup and the NCSP, it is worth monitoring the patterns of screen-seeking behaviors among cancer survivors. Using a nationwide database that included all breast cancer cases diagnosed in Korea, this study found a gradual increase in screening for general health and breast, gastric, colorectal, and cervical cancers among women diagnosed with breast cancer between 2009 and 2016. However, the overall screening rate was still relatively low, i.e., less than 40% for the 2-year screening rate, and 60% or less for the 5-year screening rate. Our results further showed some discrepancies in screening uptake across age groups.
Mammography is generally recommended for breast cancer survivors to detect local recurrence and new primary breast cancer. The mammography screening rate in our analysis was approximately 14% within 2 years and 29.5% within 5 years postdiagnosis in 2014, despite a significant increase since 2009. Mammography uptake observed in our study was substantially lower than that reported in the current study of U.S. breast cancer survivors, reaching up to 67% [12]. However, in this study, mammography screening was performed using the NCSP. The low rate of mammography screening in our study might be because breast cancer survivors might undergo their routine medical examinations for cancer treatment during the first few years after diagnosis [13]. Breast cancer survivors are being followed up by oncologists and primary care providers. Thus, we believe that breast cancer survivors prefer comprehensive care related to the breast cancer treatment to the breast cancer screening under the national health-screening program.
Overall, in the last year of the study period, 64% of breast cancer survivors underwent checkup for general health, and less than 60% underwent screening for gastric cancer, CRC, and cervical cancer within 5 years after their initial cancer diagnosis. Few studies have reported screening uptake among breast cancer survivors. A study using the Korean National Health and Nutrition Examination Survey (KNHANES) between 2007 and 2012 reported that 65.2% of breast cancer survivors underwent cervical cancer screening within 2 years of participation in the KNHANES. The 65.2% of breast cancer survivors who sought cervical cancer screening was higher than our findings (a 2-year screening rate of 36.9% and a 5-year screening rate of 58.1% in 2016). One of the differences between the current study and a previous study [13] was that the latter measured screening behavior through a self-reported questionnaire that included both national screening, opportunistic screening, and tests performed for medical purposes rather than screening. However, this study considered only national screening. Thus, the lower screening rate in this study compared with the results from the KNHANES is relevant. Another study using the KNHANES data reported that the screening rates for gastric, colorectal, and cervical cancers among all cancer survivors were 54.7%, 34.7%, and 48.5%, respectively. However, this study used data from 2001 to 2007, older than those of our study [14]. Considering the rapid increase in the national screening participation rate in Korea [9], an analysis based on recent data is warranted.
Recent cancer statistics have reported that the median age of onset of breast cancer among Korean women was approximately 10 years earlier [15] than that in female breast cancer patients in other countries, such as China [16] and the United States [17], which contributes to a higher proportion of younger breast cancer patients and survivors in Korea. Breast cancer survivors are susceptible to recurrence and have an increased risk of other cancers and other long-term health effects compared to the general population. Increases in screening rates among women with breast cancer were comparable to those in the general population during the same period from 2009 to 2016 [9]. Suboptimal cancer screening rates in cancer survivors and disparities in screening uptake in cancer survivors have been raised as problems in the management of secondary cancer prevention in survivorship care plans for cancer survivors [18-21]. Controversial results regarding cancer screening rates in cancer survivors compared with the general population or people without cancer have been reported. Several studies that directly compared cancer screening rates between cancer survivors and individuals without cancer showed higher screening behaviors among cancer survivors than among those without cancer [22,23]. However, other studies have shown lower cancer screening rates among cancer survivors than at the population level [18] or matched controls [24]. In this study, we did not directly compare screening rates between breast cancer survivors and people without cancer. However, compared with results from previous studies focusing on the general population, the national screening rates for general health checkup and cancers were lower among Korean women with a history of breast cancer compared to the national screening participation rate of the general population [9,25].
As recent breast cancer survivorship guidelines recommend regular physical examination for surveillance of breast cancer recurrence during the first 5 years following primary treatment [6], breast cancer patients typically prioritize clinical follow-up for their diagnosed cancer rather than routine cancer screening and general health checkup. According to a cross-sectional study in Korea, adherence to opportunistic screening among female cancer survivors was approximately two times higher than the screening rate in the NCSP (the overall 2-year screening rate was 52.1% vs. 24.4%) [26]. Although the Korean government has made organized cancer screening available to the entire population at no cost, opportunistic screening, albeit at an out-of-pocket expense, continues to be widely practiced. Many medical facilities, including tertiary hospitals and clinics, offer organized and opportunistic health examination programs, and most institutions attempt to provide opportunistic health examination services with large profit margins [27]. Considering the high economic burden among cancer survivors, an organized screening program would be effective in reducing the healthcare cost burden for cancer survivors. Since the data examined in this study did not include cancer screening conducted as part of clinical follow-up or privately paid screenings not covered by national health insurance, there is a likelihood that participation rates in both cancer and general health checkup may have been underestimated. Despite possible underestimation, this study identified the utility of using organized screening programs for cancer survivors. The trend of using organized screening programs has increased for multiple screening modalities, suggesting an increased contribution of organized screening programs to cancer survivors.
Our findings also yielded an inequality in the uptake of screening across age groups, with higher screening rates among the middle-aged groups (50-59 and 60-69 years) relative to those among the younger age group and those among the 70 years and older age groups. A similar disparity in cancer screening rates across age groups was observed in the general Korean population [9]. Meanwhile, a study of U.S. cancer survivors found that cancer survivors aged 65 years were more likely to be screened than younger survivors [18].
Our study has several limitations. First, breast cancer cases were defined using claims data combined with medical records and catastrophic illness codes for cancer patients. This definition of breast cancer may be less accurate than the national cancer registration data. However, a recent study reported that using this operational definition, combining both ICD codes and the catastrophic illness code to define breast cancer cases showed a high sensitivity of up to 98% [28]. Second, this study only considered screening adherence under NCSPs; therefore, information on the uptake of opportunistic screenings or screenings for treatment purposes was excluded. Future studies with screening data available from both national cancer screening and screening for other purposes are necessary. Furthermore, adherence to screening varies depending on the health status and prognosis of breast cancer survivors. However, these clinical features were not available and were therefore not considered in our analysis, which is another limitation of this study.
The results of the present study have several implications. The findings provided an overview of the status of screening uptake in women with breast cancer nationwide. In Korea, the implementation of national cancer screening and enhancement of treatments contributed to an improvement in the 5-year breast cancer survival rate to 90.1% and the 10-year survival rate to 84.6% [29], contributing to more than 200,000 breast cancer survivors by the end of 2017 [2]. Despite rapid increases in the screening uptake rate in breast cancer survivors, suboptimal screening uptake among women with breast cancer in Korea was observed at a rate even lower than that in population-level statistics. Our findings help better understand how women with breast cancer undergo screening after treatment. Second, our results demonstrated an overall increasing trend in general health checkup and cancer screening among women with breast cancer. Future guidelines on screening for cancer survivors might be helpful for better monitoring and for producing more reliable indicators of screening adherence among cancer survivors.