Introduction
Although the incidence of gastric cancer has decreased in previous decades, the disease remains a major public health burden; it is the fifth-most common cancer and third leading cause of cancer-related mortality [1]. The incidence of gastric cancer has markedly increased in Asian countries such as Korea, Japan, and China [1]. Although improvements in hygiene, [2] food storage, and Helicobacter pylori eradication [3,4] have contributed toward a decline in gastric cancer risk, gastric cancer-related mortality remains high, mainly due to late presentation of symptoms and advanced disease stage at diagnosis [5]. Early detection programs using effective gastric cancer screening methods are paramount to early diagnosis, improved outcomes, and reduced mortality rates.
Asian populations account for approximately three-quarters of all new cases of gastric cancer and associated deaths. Consequently, Japan and Korea have established national cancer screening programs for gastric cancer. In Japan, upper gastrointestinal series (UGIS) was adopted for gastric cancer screening in 1983. As recent studies reported the benefits of endoscopic screening in the reduction of gastric cancer mortality [6–9], the Japanese government recommended endoscopy as the primary method for gastric cancer screening from 2017 [10].
In 2002, the Korean government introduced nationwide gastric cancer screening under the Korean National Cancer Screening Program (KNCSP). Korean residents aged ≥ 40 years are eligible for gastric cancer screening by either UGIS or endoscopy, depending on their preference or comorbidities [11,12]. The National Health Insurance Service (NHIS) covers 90%–100% of the screening costs, depending on the patient’s insurance status [13]. Based on the review of evidence, the Korean national guidelines for gastric cancer screening recommend that asymptomatic adults aged 40–74 years undergo endoscopy (recommendation level B) and UGIS (recommendation level C) [14].
In this study, we aimed to assess the trends and performance of UGIS and endoscopy use for gastric cancer screening under the KNCSP during 2007–2016. The analyses were stratified by socioeconomic status to provide more granular evidence base for decision-making.
Materials and Methods
1. Study population
In this study, we included Koreans aged ≥ 40 years who participated in the KNCSP for gastric cancer during 2007–2016 (n=53,931,784). Individuals who were invited for the KNCSP could choose to either undergo UGIS or endoscopy for gastric cancer screening. Participants screened with UGIS who received abnormal results were further provided follow-up endoscopy under the KNCSP guidelines for gastric cancer [14]. Therefore, individuals with screening results from UGIS alone or UGIS and endoscopy were categorized as the UGIS group to calculate performance indicators (n=14,716,886). Meanwhile, persons with screening results of endoscopy alone were categorized as the endoscopy group for the corresponding indicators (n=39,214,898).
From the KNCSP database, we derived information on each participant’s demographic characteristics (age, sex, and NHIS type), screening results, and screening dates during 2007–2016. We divided the NHIS beneficiaries into two groups (upper 50% and lower 50%) depending on the premium set according to household income and assets. The Medical Aid Program (MAP) is a public assistance program that provides medical benefits to individuals from low-income households. We categorized the NHIS status into three categories: NHIS upper 50%, NHIS lower 50%, and MAP and used this as an indicator of socioeconomic status. Screening results were defined as positive by method-specific result variables and final decision variables. Screening results from UGIS and endoscopy were reported under seven categories from 2002 to 2008, namely: negative, peptic ulcer, benign tumor, suspicious gastric cancer, early gastric cancer, advanced gastric cancer, and other. These categories were revised into nine categories after 2009, including gastritis and gastric submucosal tumor. In addition, a final decision variable was included with method-specific screening results as four categories during 2002–2008, including: negative, further checkup required (possible gastric cancer), gastric cancer, and other. These categories were revised as five categories after 2009 onwards, namely: negative, benign tumor, suspicious gastric cancer, gastric cancer, and other. Screening participants were defined as positive if the method-specific variables were coded as possible gastric cancer, early gastric cancer, or advanced gastric cancer, or the final decision variable was coded as possible gastric cancer or gastric cancer. The remaining participants were coded as negative.
We ascertained the screened participants’ gastric cancer diagnosis status using the nationwide Korea Central Cancer Registry (KCCR). From the KCCR, we derived information on primary gastric cancer (International Classification of Disease, 10th Revision [ICD-10] codes: C16.0–C16.9) and the date of gastric cancer diagnosis. We followed each case for up to 12 months from the date of screening to allow any diagnostic work-up to be completed and the results to be fully reported [15].
2. Statistical analysis
Using prospective follow-up data, we conducted a cross-sectional analysis to estimate the performance indicators of gastric cancer screening by UGIS and endoscopy, stratified by sociodemographic factors. Overall, yearly screening rates by UGIS and endoscopy, with specific screening cases from each screening method, were graphically summarized for the period between 2007 and 2016. We measured and compared the positivity rate, cancer detection rate (CDR), interval cancer rate (ICR), positive predictive value (PPV), sensitivity, and specificity estimates as performance indicators of both screening methods. The performance indicators were stratified by sociodemographic factors on a 2-year basis.
The positivity rate referred to the percentage of positive screening results among the total screened cases. The CDR for gastric cancer was the number of gastric cancer cases detected per 1,000 screened individuals. Interval cancers were gastric cancer cases diagnosed within 1 year of the negative screening results. ICR was calculated as the number of interval cancers per 1,000 negative screening results. PPV was the number of screen-detected gastric cancer cases per 100 positive screenings. Sensitivity was the number of screened positives from all diagnosed gastric cancer cases, including true positive and false-negative cases, given that cancer was diagnosed within 12 months of screening. Specificity was the number of screened negatives among healthy participants, including true negative and false-positive cases within 12 months from the screening date. All statistical analyses were performed using SAS ver. 9.3 statistical software (SAS Institute Inc., Cary, NC). The statistical significance of all reported p-values was set at < 0.05.
Results
1. Characteristics of the study population
During 2007–2016, a total of 53,931,784 stomach cancer screenings were conducted, of which 72.7% (n=39,214,898) were examined by endoscopy (Table 1). The number of individuals who underwent endoscopic screening gradually increased from 1,596,080 in 2007 to 6,164,673 in 2017, whereas the number of individuals who underwent UGIS screening gradually decreased from 1,738,331 in 2007 to 979,016 in 2017 (S1 Table). For both screening methods, females comprised over half of the screening population. Meanwhile, patients aged 40–49 years accounted for the highest proportion (34.4%) of endoscopic screening cases, while those aged 50–59 years accounted for the highest proportion (26.8%) of UGIS-based screening cases in Table 1. Among all screened individuals, only 3.3% were Medical Aid recipients, and this proportion was almost two times higher among individuals who underwent UGIS (5.3%) versus among those who underwent endoscopy (2.5%).
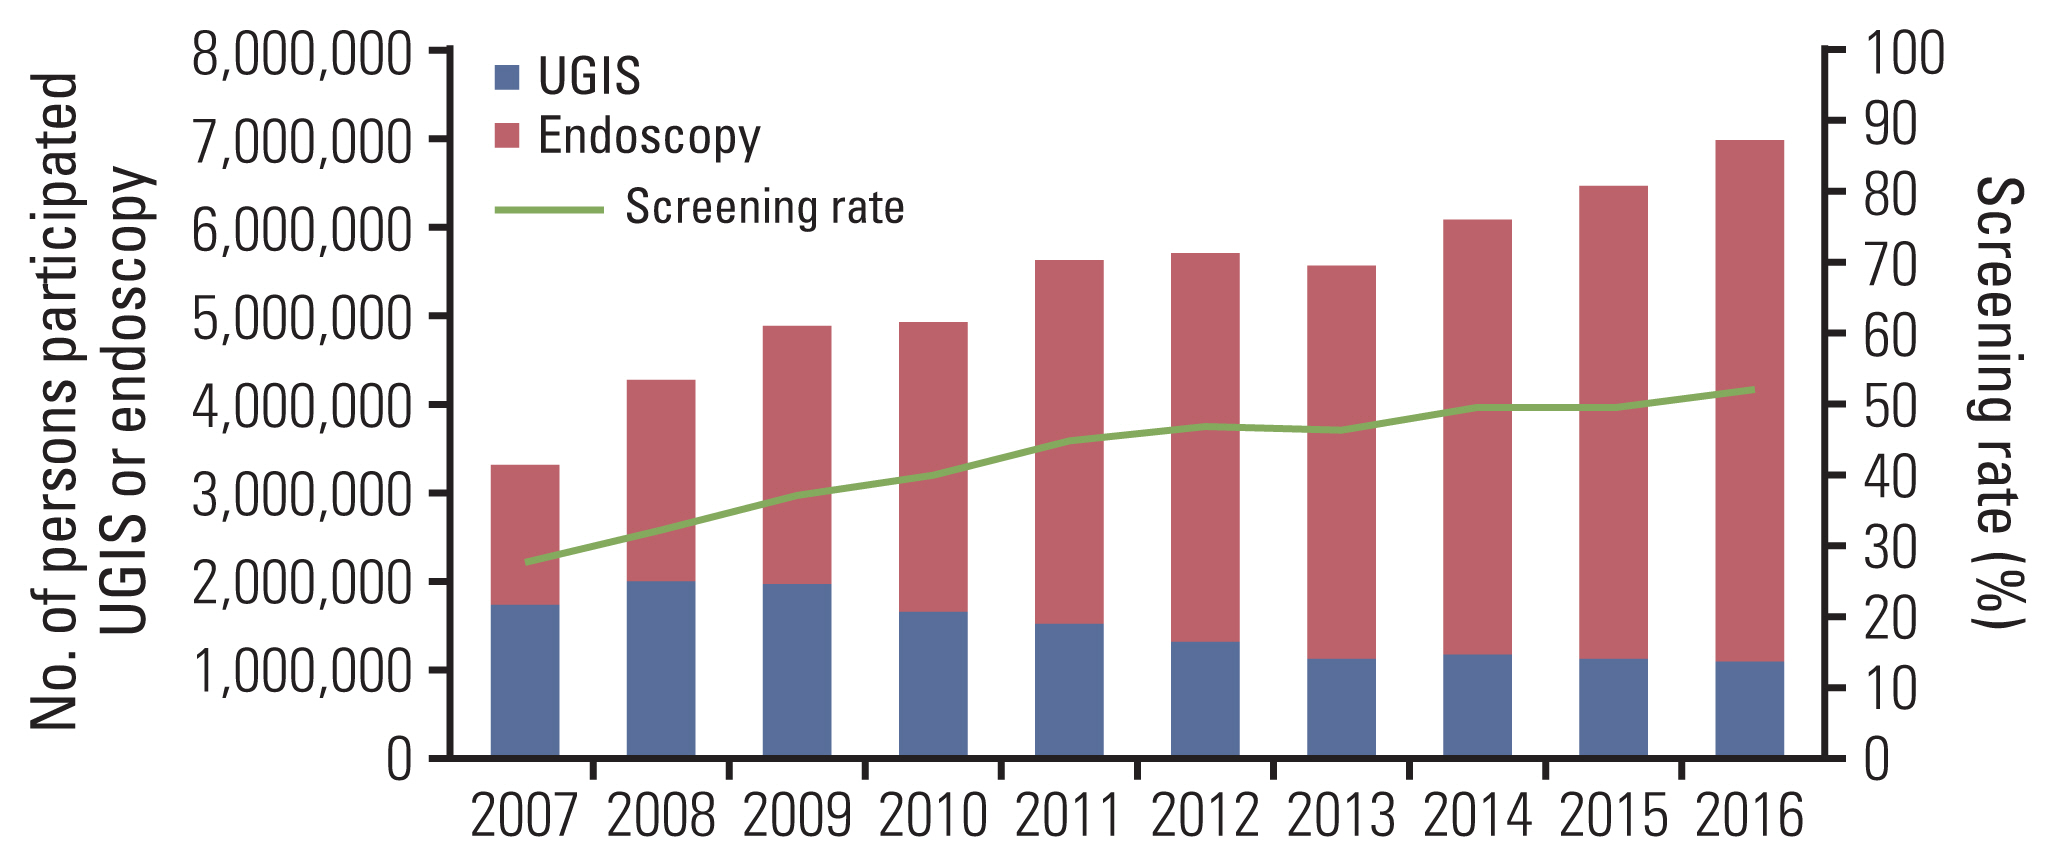
2. Participation rates for gastric cancer screening
The increase in screened participants and participation rates is delineated in Fig. 1. Annual participation rates increased from 28% to 51.9% in 10 years (Fig. 1). The proportion of individuals who underwent endoscopy dramatically increased from 47.8% in 2007 to 84.5% in 2016. Nevertheless, the absolute number of UGIS remained over 1 million until 2016 (n=1,084,531), peaking in 2008 (n=1,991,053), and subsequently gradually decreasing (S1 Table).
3. Performance of gastric cancer screening methods
The overall positive rates declined among both UGIS (from 1% to 0.25%) and endoscopy cases (from 0.40% to 0.29%) during 2007–2016 (Table 2). The positive rates were significantly higher among individuals belonging to the MAP group for both UGIS (from 1.24% to 0.37%) and endoscopy-screened (from 0.59% to 0.41%) cases than among individuals in the NHIS upper 50%.
Among participants with positive UGIS and endoscopy screening results, the CDR in UGIS and endoscopy decreased from 0.41 and 2.25 per 1,000 screened individuals in 2007–2008 to 0.26 and 1.99 in 2015–2016, respectively. The CDR for endoscopy was significantly higher among individuals in the NHIS lower 50% and MAP groups than among individuals in the NHIS upper 50% group, whereas the CDR for UGIS was not significantly different from 2013 to 2016 (Table 2). ICR per 1000 negative screenings decreased from 1.33 in 2007–2008 to 1.21 in 2015–2016 for UGIS, while for endoscopy it decreased from 1.14 in 2007–2008 to 0.88 in 2015–2016. In the UGIS-screened group, the ICR was significantly higher in the NHIS upper 50% and MAP groups than in the NHIS lower 50% group, whereas the ICR in the endoscopy group was significantly higher in the MAP group (Table 2).
There was a significant decrease the number and proportion of false-positive cases with UGIS. For endoscopy, the absolute number of false-positive cases increased; however, with an increase in total screenings, the proportion of false-positives decreased by more than 50% (S2 Table). As for socioeconomic status, the proportion of false-positive cases was two times higher among individuals in the MAP group than among those in the NHIS upper 50% group (S2 Table).
4. PPV, sensitivity, and specificity of gastric cancer screening methods
A steady increase was observed in the estimated PPV of UGIS (4.11% to 10.33%) and endoscopy (55.69% to 69.35%) from 2007 to 2016, both overall and according to NHIS status (Table 3). The sensitivity of UGIS decreased (23.55% to 17.58%), while that of endoscopy increased (66.42% to 69.35%) during the same period. The screening sensitivity of endoscopy was consistently higher than that of UGIS during the follow-up period. The specificity estimates of UGIS and endoscopy during 2007–2016 were similar (both > 99%). The PPV, sensitivity, and specificity were not significantly different among groups according to NHIS status for both UGIS and endoscopy.
Discussion
In this study, we assessed the current participation rates and screening performance of two screening methods for gastric cancer—UGIS and endoscopy—by utilizing the population-based database of the KNCSP for gastric cancer, covering the period from 2007 to 2016. During this period, the participation rate for gastric cancer screening increased from 28% to 51.9%. The number of individuals who underwent endoscopy dramatically increased from 3,875,211 (2007–2008) to 11,246,903 (2015–2016). In addition, the proportion of individuals who underwent UGIS and then endoscopy decreased, and the absolute number of UGIS users declined from 3,729,384 (2007–2008) to 2,219,635 (2016–2017) (S2 Table).
The overall positive rates and CDR for both UGIS and endoscopy decreased over time. This decrease may be associated with the continuous decrease in the incidence of gastric cancer since 1999 [16]. The CDR of endoscopy was 5–8 times higher than that of UGIS. Although the proportion of older adults with gastric cancer was high in the UGIS group, the overall CDR of the endoscopy group was likely associated with the accuracy of the test. The ICR of UGIS remained stable over time, whereas that of endoscopy significantly decreased in a gradual manner.
The differences in CDR and ICR of these methods may have resulted from the possibility of direct inspection and immediate tissue sampling. During endoscopy, it is possible to touch or magnify a suspicious lesion to check its hardness, prominence, or depression. Although it is possible to determine all gastric mucosal abnormalities by proper techniques using UGIS, it only provides superficial images with contrast. Thus, clinicians may assume the presence or absence of gastric cancer based on structural abnormalities captured on the images; these abnormalities may require biopsy to improve the sensitivity and specificity of the test [17]. Considering the trends in positivity rates, CDR, and ICR during the present follow-up period, we believe that the accuracy of detecting gastric cancer using endoscopy has improved over time. The estimated PPV of both UGIS and endoscopy increased throughout the study period. However, the PPV of UGIS increased only by 6.22%, while that of endoscopy increased by 13.66%. The sensitivity of UGIS declined while that of endoscopy increased. In regard to specificity, although both UGIS and endoscopy showed no significant changes, endoscopy showed a slightly higher value. Previous studies revealed that endoscopy had higher sensitivity than did UGIS; this finding is consistent with that of the present study [15,18]. Better performance of endoscopy over UGIS is reflected in the significant and consistent reduction in gastric cancer-related mortality over time [9].
There are several differences between UGIS and endoscopy including procedure, cost-effectiveness, and quality control, all of which may affect patient preference and healthcare system resources. In clinical settings, either UGIS or endoscopy are used, depending on patient preference or comorbidities. Although endoscopy can be performed under sedation, it causes discomfort, which plays an important role in the patients’ decision to opt for UGIS instead of endoscopy. In addition, due to the invasiveness of endoscopy, the individual may experience sore throat, indigestion, and even esophageal or pharyngeal perforation.
Although endoscopy is usually more expensive than UGIS (it requires more healthcare personnel with higher expertise), the cost of endoscopy is almost similar to the cost of UGIS in Korea (UGIS and endoscopy cost $32.67 and $34.89, respectively, in 2008) [19]. Under the KNCSP administration, people can either receive the screening tests for free or at a very low cost (10% copayment); such financial incentives may result in the increased preference for endoscopy. In addition, endoscopy may lower the risk of a need for a re-test. If a suspicious lesion is detected by UGIS, further testing such as a biopsy is usually performed by endoscopy. Thus, considering the higher accuracy rates and concurrent polyp resection possibilities, endoscopy emerges as a more cost-effective mass screening method than UGIS [19–22].
In the early stages of KNCSP for gastric cancer, the availability of well-equipped hospitals and experienced endoscopists was limited. Over time, the number of board-certified endoscopists increased by more than 4,000 in 2008 [19]; in 2018, 370 doctors applied to join the subspecialty board of gastrointestinal endoscopy [23]. Moreover, the NHIS designated all clinics and hospitals with endoscopic equipment as gastric cancer screening units to improve the accessibility to these tests. Consequently, the number of such units increased from 1,830 in 2007 to 2,418 in 2009 [13]. However, there remains large inter- or intra-provider variability, which affects diagnostic sensitivity. To prevent these problems, endoscopy quality control and optimal interval setting for tests need to be ensured. The National Endoscopy Quality Improvement (NEQI) program started in 2009 to improve the performance of the KNCSP for gastric cancer. It rates endoscopists, facilities, procedures, outcomes, and endoscope reprocessing. A follow-up study 5 years after the program launch revealed that the perception of NEQI and endoscopic practice improved substantially in all domains of quality. However, quality standards need to be further refined [24].
The present study had several limitations. First, although opportunistic screening is widely implemented for gastric cancer in Korea, we only provided results from the KNCSP. Second, other than the NHIS status, detailed information on socioeconomic status was not available in the KNCSP database. Nevertheless, the screening effect differed according to NHIS status, determined primarily based on household income and assets, within each group in our study and in a previous study [9]. Third, information on residential areas (i.e., metropolitan, urban, or rural area) was limited; therefore, differences in performance indicators by region could not be analyzed. Furthermore, interval gastric cancer cases may have been missed because of undetected abnormality at the time of screening (false-negative interval cancer case) or because it occurred as a new event after a negative screening result (true interval cancer). Unfortunately, this study could not distinguish false-negative interval gastric cancer cases from true interval gastric cancer cases. Ideally, follow-up endoscopy should be performed for all screened participants to evaluate the incidence of interval gastric cancer. However, this study is based on real-world KNCSP data, and we are therefore unable to provide detailed information regarding interval cancer characteristics. Therefore, at least some of the interval cancers in this study might be initially described as an erosion or ulcer which was not pathologically diagnosed as gastric cancer at the time of the screening endoscopy. In this case, short-term follow-up endoscopy is likely to be performed within 3 to 6 months to exclude malignant tumors, and the cancer found during short-term follow-up is not a missed cancer. Thus, it is possible that the incidence of interval cancer may be overestimated in this study. Finally, key risk factors such as salty diets or H. pylori status were not accounted for in our database. Lastly, our results are generalizable to countries with high gastric cancer incidence, e.g., Japan, but not to countries where the epidemiology of gastric cancer is different.
Our study provided valuable information on the performance of gastric cancer screening methods: UGIS and endoscopy. Through an up-to-date evaluation of long-term performance, we provide evidence on the need for revision and quality control of gastric cancer screening programs in South Korea. Our analysis of performance indicators of UGIS and endoscopy was based on a population sampled from the national screening database, ensuring comparability of the screening methods and associated performance indicators.
Briefly, during a 10-year period (2007–2016), the number of endoscopy-screened cases has tripled. Both UGIS and endoscopy showed a decrease in positivity rate, CDR, and ICR because of a reduced rate of gastric cancer incidence. However, regarding the accuracy of UGIS, both PPV and specificity were found to be improved, but sensitivity was not. For endoscopy, all three indicators were found to be improved.
In conclusion, the use of endoscopy for gastric cancer screening in Korea has increased in recent years, in contrast to that of UGIS for the same purpose; endoscopy performs better than does UGIS at gastric cancer screening. The present findings allow to assess the interim effectiveness of both screening methods and to facilitate quality control adjustments, which may be included in the new screening policies.
Electronic Supplementary Material
Supplementary materials are available at Cancer Research and Treatment website (https://www.e-crt.org).