Introduction
With the effects of changing lifestyles and an aging population, gastrointestinal (GI) cancer has been the leading cause of death and major public health problems in China as the morbidity and mortality rate increases [1]. According to the International Agency for Research on Cancer (IARC) in 2020, China has the largest number of incident cancer cases and deaths for liver cancer, esophageal cancer, and gastric cancer, comprising 1.21 million (two-thirds of the world’s total) newly diagnosed cases. Colorectal cancer in China has also rapidly risen, accounting for more than 40% of the world’s incidence in 2020 [2,3]. Obesity and smoking have been identified as well-established risk factors for cancer and cancer-related mortality [4]. It has been estimated that population attributable risk of GI cancer increased by 13.08% with high body mass index (BMI) in China in 2031 [5]. The situation of GI cancer prevention and control in China is not optimistic.
Obesity, which is often accompanied by several metabolic disorders, may mediate the harmful effect on related GI cancer through several metabolic pathways [6]. However, several studies have recently shown that not all obesity individuals were accompanied by obesity-related metabolic abnormalities, a different phenotype termed as metabolically healthy obese (MHO) [7]. This phenotype was once thought to a benign condition and characterized by the absence of cardiometabolic abnormalities, including insulin resistance, dyslipidemia, and hypertension despite excessive body fat accumulation. Previous cohort studies have shown that MHO phenotype is associated with a higher risk of cardiovascular disease (CVD) or cancer compared with individuals with metabolically healthy normal-weight (MHNW), although inconsistent results have also been reported [8,9]. Due to the lack of uniform criteria for defining MHO, the extent to which metabolically healthy but obese people are at a lower risk for cancer or have a lower risk for mortality, compared with the rest of obese people, is currently under debate.
BMI, waist circumference (WC), and waist-hip ratio (WHR) were used to define general and abdominal obesity in clinical practice, respectively. Previous studies found that distinct body shape phenotypes were differentially associated with the risk of overall cancer [10]. Evidence from large, prospective studies regarding MHO and risk of GI cancer is lacking, especially in the context of high incidence in China. In this study, we used data of the Kailuan Study, an ongoing prospective cohort, investigated associations of metabolically healthy obesity with GI cancer risk. We hypothesized that these MHO phenotype might have different risk by using different criterions for obesity. Furthermore, we examined whether the association differed by sex and age.
Materials and Methods
1. Study participants
The data were obtained from a health examination of employees of the Kailuan Company in the city of Tangshan, Hebei Province, north of China. Tangshan is situated about 90 miles southeast of Beijing and represents the overall Chinese population from a socio-economic perspective. Over the past few decades, Kailuan Group has developed a comprehensive company managing coal production, machine manufacture, transportation, chemical production, education and health care, etc. The Kailuan Study is an ongoing prospective community-based cohort study conducted in Tangshan, China. All participants in the Kailuan Study are employees and retirees of the Kailuan Group. Details of the study design and procedure have been described elsewhere [11]. At baseline, 125,246 participants were recruited, underwent clinical and laboratory examinations, and completed a questionnaire interview (June 2006 to December 2009) at 11 hospitals affiliated with the Kailuan Group. Subsequent examinations involving anthropometric, laboratory examinations, and self-reported questionnaires (including educational level, smoking, drinking, and so on) occurred approximately biennially. Participants were excluded if they had prevalent cancer (n=439), or missing data on BMI or WC at baseline (n=8,388), or missing data on fasting blood glucose (FBG), systolic blood pressure (SBP), diastolic blood pressure, triglyceride (TG), and high density lipoprotein-cholesterol (HDL-C) at baseline (n=1,425). Ultimately, a total of 114,995 participants were enrolled in the present syudy (Fig. 1).
2. Data collection and definitions
Information on demographic and clinical characteristics (age, sex, lifestyle, and family history of cancer, etc.) were collected using a self-reported questionnaire, as detailed elsewhere [12]. Education level was classified as primary school or below, middle school, and high school or above. Smoking and drinking status were classified as current or not. Dietary salt intake was classified as low (< 6 g/day), intermediate (6-12 g/day), and high (> 12 g/day). Active physical exercise was defined as “> 4 times per week and 20 minutes at time.”
Elbow venous blood samples of 5 mL were collected into an anticoagulant tube containing EDTA between 7:00-9:00 am after overnight fasting for at least 8 hours, and the serum was collected after centrifugation at 3,000 ×g for 10 minutes. The supernatant was measured within 4 hours. All biochemical measurement including TG, HDL-C, low-density lipoprotein cholesterol, high-sensitive C-reactive protein (Hs-CRP), FBG, etc. was measured on the Hitachi 747 autoanalyzer (Hitachi, Tokyo, Japan).
3. Definition of metabolic health status
Body weight, height, and WC were reported by trained nurses according to the standard methods. BMI was calculated as weight divided by square of height (kg/m2). The obesity was defined according to categories of BMI (kg/m2) categorized using Chinese standards: normal weight (BMI < 28 kg/m2), and obese (BMI ≥ 28 kg/m2) [13]. For WC criteria, central obesity was defined as WC ≥ 90 cm for males and WC ≥ 85 cm for females [14].
Metabolic status was defined with reference to the JACC Health Promotion Series [15]. Metabolic unhealth status was diagnosed by the presence of any one of four components: (1) serum TG ≥ 150 mg/dL or drug treatment for elevated TG; (2) serum HDL-C < 50 mg/dL in women or < 40 mg/dL in men or drug treatment; (3) systolic blood pressure (BP) ≥ 130 mmHg or diastolic BP ≥ 85 mmHg or drug treatment for elevated BP; and (4) FBG ≥ 100 mg/dL or drug treatment for elevated FBG. Participants who meet 0 of the four components criteria were considered metabolic health status.
Using the above criteria for obesity and metabolic status, participants were categorized into four phenotypes: (1) MHNW, (2) MHO, (3) metabolic unhealthy normal-weight (MUNW), (4) metabolic unhealthy obesity (MUO). For WC criteria, all participants were also classified into four obesity phenotypes.
4. Assessment of GI cancer
Follow-up ended at the first record of GI cancer event, all-cause death or at the end of follow-up on 31 December 2021, whichever came first. The types of GI cancer included esophageal cancer, gastric cancer, colorectal cancer, biliary tract cancer, liver cancer, and pancreatic cancer. We used International Classification of Diseases, 10th revision codes to identify GI cancer cases (C15 for esophageal cancer, C16 for gastric cancer, C18-C21 for colorectal cancer, C22 for liver cancer, C23-C24 for biliary tract cancer, and C25 for pancreatic cancer). In brief, participants with cancer were tracked through biennial health examinations and annual searches of the Tangshan medical insurance system and the Kailuan social security system. Moreover, the outcome information was further confirmed by a medical record review performed by clinical experts. Information on pathological diagnosis, imaging diagnosis (including ultrasonography, computerized tomography, and magnetic resonance imaging), and blood biochemical testing were collected to assess incident cancer.
5. Statistical analysis
Continuous variables were compared using analysis of variance or the Kruskal-Wallis test according to distribution, and categorical variables were compared with the chi-square test.
Cumulative incidence rates were estimated by Kaplan-Meier survival analyses. Cox proportional hazard models were used with follow-up period as the time scale to estimate the hazard ratios for incident GI cancer and cancer type by metabolic health status, and were adjusted for baseline confounders, including age, sex, educational level, drinking (current or not), smoking (current or not), dietary salt intake (low, intermediate, and high), physical exercise (active or inactive), alanine aminotransferase, Hs-CRP and family history of cancer. Certain cancers are sex-specific and age-related. We performed interaction analyses to assess the interaction between metabolic health status and sex and age (≤ 60 years or > 60 years) on the risks of GI cancer. And the interaction effect was estimated by the Wald test.
To examine the robustness of our results, we performed several sensitivity analyses. First, we excluded events occurring in the first 1 year of follow-up to minimize potential reverse causation. Second, to weaken the influence of a treatment bias, we excluded participants with cardiovascular diseases at baseline and repeated analysis. Third, we also excluded participants received treatment with lipid lowering medication, hypoglycemic drug, or antihypertensive medication at baseline. Finally, we also assessed central obesity defined by WHR and waist-to-height ratio (WHtR). And sensitivity analysis was performed on the basis of the new definition of obesity used in the different criteria and metabolic status.
Missing covariates were imputed by multiple imputation using the fully conditional specification method SAS MI procedure. The results were consistent from analyses that excluded participants with missing covariates. The proportional hazard assumption was examined by Schoenfeld residuals. All analyses were done with SAS ver. 9.4 (SAS Institute Inc., Cary, NC), at a two-tailed alpha level of 0.05.
Results
A total of 114,995 eligible participants were included in present analysis, their mean age was 51.08±12.63 years, and 80.34% were men. To baseline characteristics of the study participants according to metabolically healthy phenotypes based on BMI category are shown in Table 1. When compared to the MHNW group, participants in the MUNW and MUO groups were more likely to be older, men, a higher prevalence of current drinkers, had a higher BMI, WC, SBP, FBG, and TG level, and a lower HDL-C level. S1 Table shows the baseline characteristics when using WC for the classification of obesity.
After a mean follow-up of 13.76±2.74 years, incident GI cancer, esophageal cancer, gastric cancer, colorectal cancer, biliary tract cancer, liver cancer, and pancreatic cancer occurred in 2,311, 238, 492, 831, 75, 511, and 164, respectively. Table 2 shows the association between metabolically healthy phenotypes and incident GI cancer based on BMI category. In the multiple-adjusted regression analysis, MHO was positively associated with risk for GI cancer. However, such associations were not found for WC category. In addition, compared with the MHNW group, subjects from the MUNW and MUO groups had a higher risk of incident GI cancer among both BMI and WC category. The consistent results stratified by age and sex are displayed in Table 3. The detailed results of sensitivity analysis are reported in S2 and S3 Tables. In sensitivity analysis, we excluded participants with less than 1-year follow-up, with cardiovascular diseases at baseline, or received treatment with lipid lowering medication at baseline, the results were materially unchanged.
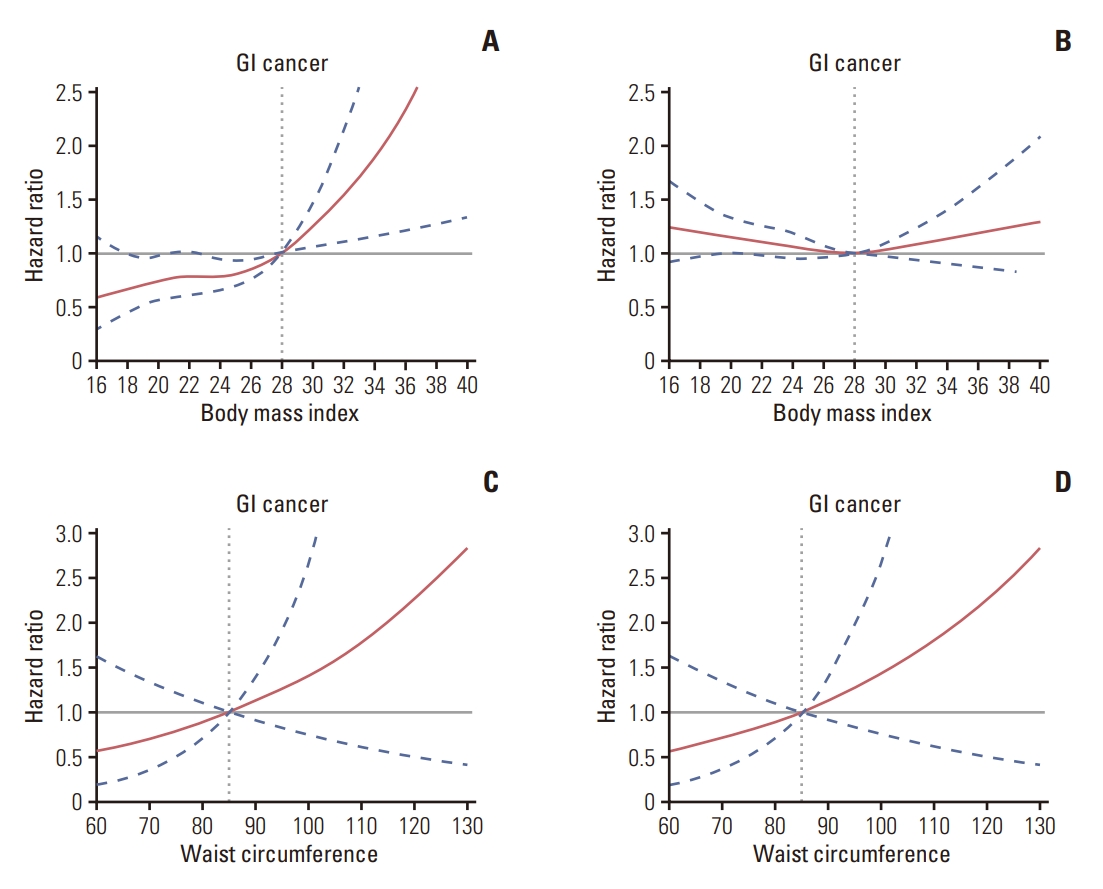
Fig. 2 shows the results of restricted cubic spline analysis. The dose-response relationship between baseline BMI and incident GI cancer was non-linear (p for non-linearity < 0.05) throughout the range of their levels in metabolically healthy participants. However, there was no dose-response relationship between BMI and GI cancer in metabolically unhealthy participants (p > 0.05). And no dose-response relationship was observed between WC and GI cancer regardless of metabolically healthy phenotypes (all p > 0.05).
Table 4 shows that the association between metabolically healthy phenotypes and GI cancer types. Significant differences were also evident for some types. MHO individuals were significantly associated with increased risk of gastric cancer using BMI category, while using WC criteria, individuals have increased risks for colorectal cancer and liver cancer. S3 Table shows that the association between metabolically healthy phenotypes (defined by WHR and WHtR categories) and GI cancer. Subgroup analyses found consistent results (S4-S7 Tables).
Discussion
In this large population-based prospective cohort study and had a long follow-up period of up to 15years, we found an association between metabolically healthy status and risk of GI cancer from Kailuan Study. In our research, we first discovered that differences in the risk of developing GI cancer among different obesity phenotypes using different obese indicators for defining metabolically healthy status in Chinese, and the risk is primarily driven by gastric cancer, liver cancer, and colorectal cancer. We also found that, regardless of body fatness, metabolic disorders associated with increased GI cancer risk.
Scholars believe that MHO is a benign condition in studies in the early stages, who obese do not display the typical adverse metabolic effects of obesity [16,17]. However, current available evidence suggests MHO individuals are at increased risk for developing GI cancer despite normal metabolic traits including the parameters related to glucose and lipid metabolism, and BP. We provide robust evidence of a significant association of MHO with increased risk of GI cancer. In this study, we found that the MHO phenotype increased GI cancer risk during 15-year period compared with the MHNW participants, and the risk is primarily driven by gastric cancer, liver cancer and colorectal cancer. It is important to note that differences in the risk of developing GI cancer among different obesity phenotypes using different obese indicators for defining metabolically healthy status in Chinese. When grouped based on BMI, MHO had increased the risk of gastric cancer. In contrast, MHO individuals are at increased risk for developing liver cancer and colorectal cancer as assessed by using WC. Although BMI is commonly used as a standard measurement of overall adiposity in adults, the skeleton of Chinese population is relatively small, but the abdominal fat is relatively thick, which is one of the reasons that we considered multiple measures of adiposity [18]. When we analyzed the association between MHO and the risk of GI cancer, future studies are required to specifically define these criteria. According to age and sex, the metabolic status is quite different, and the common site-specific cancers are also quite different. In stratified analyses, the younger MHO participants had a higher risk of developing GI cancer compared with the older counterpart. From a life course perspective, early life BMI increase was likely a reflection of the life-long exposure to adiposity and adiposity-induced biologic alterations, which may result in greater impact cumulatively over decades of cancer development [19]. The findings we report in this large-scale study sometimes did not concur with prior, smaller studies [20,21]. This might be due to the following two reasons. On the one hand, there is no gold standard to define metabolically healthy status, inconsistent results have been obtained from different criteria. On the other hand, it takes years to decades for GI cancer development following MHO exposure, the follow-up time relatively short and the results may not necessarily represent long-term outcomes. This in part might also be related to ethnic disparities with the prevalence of GI cancer.
Another critical finding of this study is, regardless of body fatness, metabolic disorders associated with increased GI cancer risk. As shown in Fig. 2, individuals with metabolic abnormalities were at higher risks of GI cancer irrespective of degree of obesity. Although elevated BMI or WC are major risk factors for the development of metabolic disorders such as hypertension, diabetes, and dyslipidemia these metabolic abnormalities could also affect the risk of developing cancer independently, even in normal-weight individuals [22]. We also found that metabolic derangements that place an individual at increased risk of developing GI cancer are found in a proportion of normal-weight individuals (i.e., normal or overweight states), who have one or multiple metabolic abnormalities. Metabolic abnormality and the degree of obesity were more prominent in MUO individuals. As expected, the risk to developing GI cancer is higher in people with MUO compared to MUNW indicating that a potential interaction between obesity and metabolic abnormalities. This conclusion is supported by convergent evidence. In the EPIC prospective study, by using a case control study approach, Murphy et al found that individuals with the metabolically unhealthy/overweight phenotype (with hyperinsulinemia) are at higher colorectal cancer risk than those with normal insulin levels [23]. Concerning the concordance between MUO and the risk of GI cancer, this was also mentioned above [21,24].
As seen above, there are many inconsistencies on metabolically healthy status and risk of GI cancer, it makes it difficult to determine its exact relationship. The reason may be attributed rather to the lack of well-defined criteria to unambiguously define metabolically healthy status. Hence, as past literatures have reported, the impact of different diagnostic criteria on GI cancer suggests that patients with different diagnostic criteria might have different prevalence of disease [9]. That is why there are many non-congruent facts about metabolic healthy status and GI cancer in the literature. In this study, we defined metabolic healthy status according to Lavie criteria, which have been used to classify the risk of GI cancer in BMI categories [15]. And based on existing criteria, we complement many results that defined central obesity based on WC or WHtR. The same is true for the metabolic healthy status. Individuals were also diagnosed with metabolic healthy status if they met any of four diagnostic criteria for metabolic syndrome. Metabolic healthy status was not uniformly defined, which might result in obscure findings. Thus, we might have to be more careful in the selection of criteria. Several potential mechanisms have been identified in relation to the correlation between metabolically healthy phenotypes and the incidence and prognosis of GI cancer. One such mechanism involves chronic inflammation, characterized by alterations in concentrations of inflammatory cytokines and infiltration of immunosuppressive cells [25,26]. Furthermore, insulin resistance associated with metabolic unhealthiness, independent of general obesity, may elevate levels of insulin and insulin-like growth factor I, which are known to impede apoptosis and stimulate the proliferation of cancer cells [27,28]. Future studies are needed to clarify the underlying pathophysiological mechanisms of this association.
The strengths of this study include a cohort design, long follow-up, large sample size, and analysis using various criteria for obesity. However, this study also had several limitations. First, although we adjusted for important confounders in the multiple analysis, we cannot exclude the possibility of residual confounding factors due to unmeasured variables, such as dietary patterns, history of Helicobacter pylori infection or Clonorchis sinensis infection. Second, more evidence suggests that MHO is not a permanent state, but it may be a dynamic nature [29-32]. Approximately 30% to 50% of individuals originally identified as MHO was transitioned to a metabolic abnormality over time [33]. Regrettably, our analysis was based solely on baseline data. Future studies will require studies in focused the associations with the MHO phenotypic transitions and incident GI cancer. Last, our study population comprised participants with Kailuan Study, not covering completely Chinese.
In the present study, we observed that MHO phenotype was associated with increased risk of GI cancer, no matter general or abdominal obesity. Moreover, individuals who complicated by metabolic unhealthy status have an increased risk of developing GI cancer. Hence, clinicians should consider the risk of incident GI cancer in people with abnormal metabolically healthy status and counsel them about metabolic fitness and weight control.