Introduction
Colorectal cancer (CRC) prognosis is predicted by TNM staging. The recent American Joint Committee on Cancer (AJCC) manual also recognizes the following prognostic factors: preoperatively elevated serum carcinoembryonic antigen, satellite tumor deposit, tumor regression grade, circumferential resection margin, microsatellite instability, perineural invasion and KRAS mutational status [1].
Lymph node metastasis (N stage) is the single most important prognostic factor in CRC [2]. Baxter et al. [3] used data from the National Cancer Institute’s Surveillance, Epidemiology, and End Results (SEER) program to determine the proportion of CRC patients in the United States who received adequate lymph node evaluation. Of 116,695 adults with CRC diagnosed from 1988 through 2001 who underwent radical surgery and did not receive neoadjuvant radiation (i.e., at least 12 lymph nodes were examined), only 37% of the patients received adequate lymph node evaluation. For example, the 5-year survival rate for patients classified with stage II disease was 64% when one or two lymph nodes were sampled, it increased to 86% when more than 25 nodes were sampled. In conclusion, 63% of patients with CRC did not receive an accurate staging evaluation because of inadequate lymph node dissection, and these patients likely did not receive the appropriate treatment.
Therefore, the purpose of this paper was to determine whether lymph node metastasis represents a complementary method to the TNM stage method for accurate prediction of prognosis (the number of lymph node metastases) in patients who did not receive adequate lymph node evaluation.
Materials and Methods
1. Study population
A total of 806 patients who underwent surgery for CRC in Yeouido St. Mary's Hospital from January 2004 to December 2011 were analyzed retrospectively, and the data were collected prospectively.
In total, 692 patients were analyzed, including those with adenocarcinoma. Patients who did not undergo colorectal resection, who underwent transanal excision and those whose tumor location was not labeled correctly in the documentation were excluded.
The Yeouido St. Mary’s Hospital Institutional Review Board approved this analysis (SC13OISI0180).
2. Lymph node analysis
To date, there are five types of lymph nodes that could be used for analysis: metastatic lymph nodes (ML), total lymph nodes examined (TL) [4], negative metastatic lymph nodes (NL) [5], lymph node ratio (LR=ML/TL) [6], and apical lymph nodes (APL) [7].
ML were analyzed according to the N stage, and TL were classified as less than 10, 11-20, 21-40, and ≥ 41. NL was scored as ≤ 3, 4-6, 7-12, or ≥ 13. The LR was classified as < 0.2, 0.2-0.5, or ≥ 0.5. APL were measured in approximately 359 patients from whom 2 cm of soft tissue was collected from the origin of the primary feeding arterial vessel (e.g., inferior mesenteric artery, right colic artery, or ileocolic artery), and the presence or absence of ML was noted.
All patients, regardless of the examined lymph node count, were included in the all group (A group). Patients in whom at least 12 lymph nodes were examined were included in the adequate lymph nodes evaluation group (AL group). Patients who did not receive adequate lymph nodes examination were placed in the inadequate lymph node evaluation group (IAL group). We analyzed the statistical significance between these three groups.
Results
1. Patient characteristics
A total of 692 patients with CRC were included in this study; 489 had rectal cancer and 203 were colon cancer patients. The mean ages of the colon cancer and rectal cancer patients were 63.2 and 61.1 years old, respectively.
The male to female ratio of the colon cancer population was 284 (58.1%) to 205 (41.9%), and that for rectal cancer patients was 134 (66%) to 69 (34%). APL were harvested from 252 patients (51.5%) with colon cancer and 107 patients (52.7%) with rectal cancer. Inadequate lymph node evaluation occurred in 138 (28.2%) colon cancer and 104 (51.2%) rectal cancer patients (Table 1).
The mean follow-up period was 83.5 months. In total, the 5-year DFS was 67.5% and the 5-year OS was 85.2%. The 5-year DFS for each stage was as follows: stage I, 92.9%; stage II, 73.7%; stage III, 56.2%; and stage IV, 24.9%. The 5-year OS for each stage was as follows: stage I, 94.2%; stage II, 93.6%; stage III, 83.6%; and stage IV, 30.0%.
2. Various lymph node analysis methods
1) Metastatic lymph node (existing N stage)
Univariate analysis was performed for analysis of the impact of ML on patient outcome. In the rectum, OS did not differ statistically (A group, p=0.062; AL group p=0.241). The number of ML, especially for patients who received inappropriate lymph node dissection (IAL group), did not represent a significant difference in DFS (p=0.339) and OS (p=0.146) for rectal cancer patients and OS (p=0.129) for colon cancer patients (Table 2).
2) Total lymph node
The number of TL was not statistically significant for any parameter, except OS (p=0.042) in the AL group of colon cancer patients. There was no greater efficacy than the existing N stage system (Table 2). In the subgroup analysis for stage I, OS (p=0.049) was significantly different in the AL group of CRC (Table 3). For stage II and III, TL was not statistically significant. For stage IV, the OS of the A group (p=0.02) and AL group (p=0.041) of CRC, and the A group (p=0.0028) and AL group of colon cancer patients showed statistical significance (Table 3). Lymph node harvest (LNH) count (≤ 10, 11-20, 21-40, or ≥ 41) affected the OS in the stage IV CRC and colon groups. Thus, lymph node dissection improved OS in stage IV colon cancer.
4) Metastatic lymph node ratio
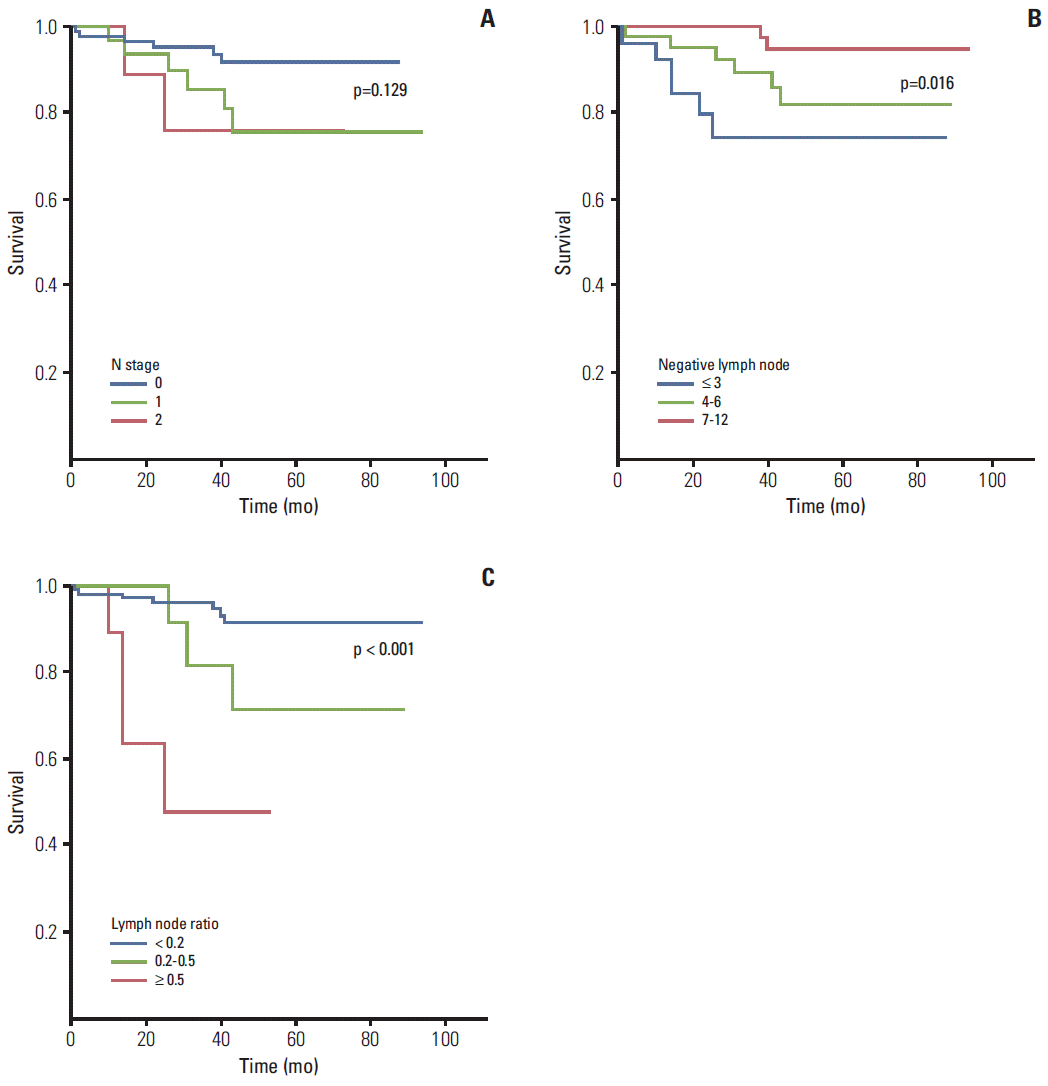
LR was more useful than the conventional N stage system, as it showed statistically significant efficacy for OS (p < 0.001) in the IAL group of colon cancer and for OS in rectal cancer (A group, p=0.026; AL group, p=0.031; and IAL group, p=0.003) (Table 2, Fig. 1).
In the subgroup analysis, stage I, II, and early cancer (node negative cancer) were meaningless for LR because no ML were present. In stage III, IV, and advanced cancer (node positive cancer), the DFS for colon cancer patients who received inappropriate lymph node dissection (IAL group) was statistically significant for LR but not for N stage (Table 3).
5) Apical lymph node
APL showed significance for DFS (p=0.036) of the IAL group of rectal cancer, which was not predicted by the conventional N stage system. APL showed efficacy in predicting DFS in all patients, except the AL group of colon cancer (Table 2).
6) Comparison of the different lymph node analysis methods
ML (conventional N stage) did not show significant differences in the OS of rectal cancer patients. In particular, if patients received inadequate lymph node dissection (IAL group), OS in colon cancer and DFS and OS in rectal cancer were not statistically different.
These limitations were overcome using NL and LR to predict the OS of colon cancer patients and the LR for the OS of rectal cancer patients. APL accurately predicted DFS in the IAL group and in the OS of all patients.
Discussion
Regarding prognostic factors in CRC, the College of American Pathologists consensus statement in 1999 by Compton et al. [8] stated that lymph node metastasis of CRC was definitely proven to be prognostically important (category I). However, due to insufficient data, the use of various analysis methods is still recommended. One limitation of the current N stage system is that it cannot provide a precise prognosis for patients who did not have over 12 lymph nodes dissected. Thus, we sought to identify another lymph node analysis method to complement the N stage system.
In our study, inadequate lymph node evaluation occurred in 138 colon cancer (28.2%) and 104 rectal cancer patients (51.2%). According to a Norwegian national cohort study of 2011, adequate LNH rate from 2007 to 2008 was 69.6% for colon cancers more than 15 cm above the anal verge. Adequate LNH rate was 84.9% in stage II colon cancer of Cleveland Clinic (Cleveland, OH). Adequate LNH rate ranges from 31% to 84.9% in CRCs, and risk factors for poor LNH include early stage CRCs and neoadjuvant concurrent chemoradiotherapy [9-11]. In addition, the rate of adequate LNHs has shown a drastic increase since the National Comprehensive Cancer Network guideline referred to LNH below 12 nodes as a high risk group [12]. In accordance, our study showed 43.8% inadequate LNHs until 2008, while it decreased to 18.4% from 2009 to 2011. Conventional surgery and low ligation was the primary surgical method of our institution until 2008, but conversion to laparoscopic surgery and high ligation as the primary method thereafter has increased the number of adequate LNHs.
ML was used as the reference, and the patients were subdivided further and analyzed statistically. In the case of stage I, II and early cancer, there was no value because the patients were node negative. For stage III of the IAL group of ML, no statistically significant differences were observed in the following groups: DFS (p=0.418) and OS (p=0.19) of CRC patients, DFS (p=0.242) and OS (p=0.44) of colon cancer patients, and DFS (p=0.992) and OS (p=0.303) of patients with rectal cancer. No statistically significant differences were observed for stage IV of ML. In advanced cancer (node positive), the ML was statistically significant for OS but not DFS (Table 3).
Chang et al. [4], who systematically reviewed 17 studies (including two nested cohort studies) regarding lymph node evaluation after the curative resection of colon cancer, concluded that the number of lymph nodes evaluated after surgical resection was positively associated with the survival of patients with stage II and stage III colon cancer [4]. The effect of increased lymph node recovery on improving survival may not be fully explained by improved staging accuracy alone. Chang et al. [4] also described various TL classification criteria; however, we used two criteria in our data analysis: (1) ≤ 10, 11-20, 21-40, and ≥ 41 and (2) ≤ 11 and ≥ 12. The former criteria showed statistical significance, therefore we used those criteria, but they showed no additional utility compared to ML.
Ogino et al. [5] reported that patients with 0-3, 7-12, and ≥ 13 negative lymph nodes showed a significant reduction in cancer-specific and overall mortality. Using a similar system, we performed statistical analysis of patient parameters based on different subdivisions. In stage I, only the OS (p=0.039) of the AL group of colon cancer was significant. For stage II in the IAL group, NL showed a statistically significant difference in the DFS (p=0.003) and OS (p=0.003) of CRC patients and DFS (p=0.02) and OS (p=0.012) of rectal cancer patients. Importantly, it predicted a significant decrease in the survival of patients with three or less lymph node compared the four to six and 7 to 11 lymph node count groups (Table 3, Fig. 2). Therefore, for stage II rectal cancer patients, NL count (i.e., the LNH number was three or less) indicated that short-term follow-up and additional treatment were necessary.
For the early IAL rectal cancer group (i.e., node negative patients who underwent polypectomy or endoscopic submucosal dissection before surgery due to incorrect T staging of the primary tumor), NL showed a statistical value in predicting DFS (p=0.016) and OS (p=0.014) (Table 3, Fig. 2). Therefore, in patients with three or less total lymph node, there was a difference in the DFS and OS, and close observation is warranted.
Johnson et al. [13] reported that increasing the negative lymph node count is independently associated with improved long-term survival in stage IIIB and IIIC colon cancer but not stage IIIA. They also divided patients into subgroups of those with ≤ 3, 4-7, 8-12, or ≥ 13 negative lymph nodes. Cumulative 5-year cancer mortality was 27% in stage IIIB patients with ≥ 13 negative nodes identified versus 45% in those with three or fewer negative lymph nodes evaluated (p < 0.001). In patients with stage IIIC cancer, those with ≥ 13 negative nodes had a 5-year mortality of 42% versus 65% in those with ≤ 3 negative lymph nodes evaluated (p < 0.001) [13].
For stage III in the IAL group, ML was not statistically meaningful. However, NL was statistically significant in predicting DFS (p=0.002) and OS (p=0.0027) for colon cancer patients (Table 3). Therefore, for patients in the IAL group of colon cancer, NL (with 3 or less, 4-6, and 7-11) complemented the existing N stage.
For stage IV cancer, the DFS of the A group (p=0.004) and IAL group (p=0.009) of CRC, and the DFS of the A group (p=0.011) and IAL group (p=0.013) and the OS of the AL group (p < 0.001) of colon cancer patients were statistically significant (Table 3).
In the case of advanced cancer, NL complimented the N stage system for predicting the limit of DFS. For example, the DFS (p=0.001) of the AL group of CRC, the DFS (p < 0.001) of the A group of colon, the DFS (p=0.004) of the AL group of colon, and the DFS (p=0.004) of the IAL group of colon showed increased efficacy with the N stage system (Table 3).
Ogino et al. [5] also concluded that smaller LR was associated with improved survival in stage III and stage IV using LR of < 0.2, 0.2-0.39, and ≥ 0.4. Ceelen et al. [6], who analyzed 16 studies, including 33,984 patients with stage III and IV CRC, identified LR as an independent prognostic factor for patients with stage III cancer of the colon or rectum. The prognostic separation obtained by LR was superior to that of the number of positive nodes (N stage). We analyzed the LR using the following three criteria: first, < 0.2, 0.2-0.5, and ≥ 0.5; second, ≤ 0.17, 0.17-0.41, 0.41-0.7, and > 0.7; third, < 0.2, 0.2-0.4, and > 0.4. We described only the first criteria because it was the most statistically significant in our data.
The APL was defined as the node nearest the point of ligature of the main vascular pedicle [7,14]. Malassagne et al. [7] concluded that the involvement of APLs has a significant effect on colon cancer prognosis. Kang et al. [15] concluded that the presence of inferior mesenteric artery lymph node metastasis should be considered a predictive factor for high systemic recurrence in sigmoid and rectal cancer, and it should be treated and followed up. However, Yi et al. [16] concluded that apical node metastasis is not a poor prognostic factor for stage III sigmoid colon or rectal cancer after high ligation. Interestingly, Huh et al. [17] reported that in patients with pN1 tumors, OS and DFS did not differ significantly according to the distribution of lymph node metastases (lymph node; i.e., APL metastases). However, for patients with pN2 tumors, the OS and DFS curves among the distribution of lymph node metastasis groups were significantly different (p < 0.001 and p < 0.001, respectively) [17]. In granular analysis of our data, APL was not efficient in the IAL group, but it was statistically valuable for predicting OS for colon cancer and DFS for rectal cancer in the stage III and advanced cancer AL group.