| Home | E-Submission | Sitemap | Contact Us |  
top_img
Cancer Research and Treatment > Volume 54(4); 2022 > Article
Sun, Feng, Zhang, Huang, Zhao, Zhang, Yue, and Wang: The Role of Neutrophil-to-Lymphocyte Ratio in Predicting Pathological Response for Resectable Non–Small Cell Lung Cancer Treated with Neoadjuvant Chemotherapy Combined with PD-1 Checkpoint Inhibitors

Abstract

Purpose

The aim of our study was to investigate the value of baseline and preoperative neutrophil-to-lymphocyte ratio (NLR) in predicting the pathological response and disease-free survival (DFS) of neoadjuvant chemotherapy alone or combined with programmed cell death-1 (PD-1) checkpoint inhibitors in patients with resectable non–small cell lung cancer (NSCLC).

Materials and Methods

Resectable NSCLC patients who underwent neoadjuvant chemotherapy alone or combined with PD-1 checkpoint inhibitors between January 2018 and January 2020 were included. Peripheral venous blood samples of the patients were collected within 3 days prior to the first neoadjuvant treatment and within 3 days prior to surgery.

Results

A total of 79 patients in neoadjuvant chemotherapy combined with PD-1 checkpoint inhibitors group and 89 patients in neoadjuvant chemotherapy alone group were included. Thirty-five point four percent of the patients achieved pathological complete response (pCR) in neoadjuvant chemotherapy combined with PD-1 checkpoint inhibitors group, whereas only 9.0% reached pCR in the group of neoadjuvant chemotherapy. High NLR level were correlated with poor pathological response and DFS in neoadjuvant chemotherapy or combined with PD-1 checkpoint inhibitors group. Multivariate analysis revealed that baseline NLR could independently predict pathological response and DFS in the neoadjuvant chemotherapy combined with PD-1 checkpoint inhibitors group.

Conclusion

High NLR level were correlated with poor pathological response and shorter DFS in patients with NSCLC undergoing neoadjuvant chemotherapy or combined with PD-1 checkpoint inhibitors. Meanwhile, baseline NLR could independently predict response to pathological response and DFS, revealing its potential as a screening tool in NSCLC patients who received neoadjuvant chemotherapy combined with PD-1 checkpoint inhibitors.

Introduction

Global cancer statistics showed that lung cancer is the leading cause of cancer death [1]. Non–small cell lung cancer (NSCLC) accounts for 85% of all lung cancer, mainly consisting of adenocarcinoma and squamous cell carcinoma [2]. The emergence of immune checkpoint blockade targeting programmed cell death-1/programmed cell death ligand-1 (PD-1/PD-L1) has revolutionized the treatment of NSCLC. These drugs unleash antitumor immunity, resulting in tumor regression and improved survival in some patients with advanced NSCLC [3,4]. Combining anti–PD-1/PD-L1 with chemotherapy in metastatic NSCLC has also shown a survival advantage over chemotherapy alone, regardless of the level of PD-L1 expression or tumor mutation burden [5,6]. It has been hypothesized that neoadjuvant immunotherapy for early-stage NSCLC has the advantage of maximizing T-cell activation using the primary tumor as an antigen source, thereby systemically eliminating micro-metastases [7]. Using immune checkpoint inhibitors as neoadjuvant treatment could be superior to using them as adjuvant treatment since they could release neoantigens from dying tumor cells and stimulate the priming and expansion of neoantigen-specific T cells in the tumor before surgical resection [8]. A trial of neoadjuvant ipilimumab combined with chemotherapy showed that 58% of patients with NSCLC had an objective response [9].
There is a pressing need to find easy-to-use, reliable, and inexpensive biomarkers to identify NSCLC patients who may respond to neoadjuvant anti–PD-1 antibody. Cancer-related inflammation is a critical determinant of disease progression and survival in most cancers [10]. Hematologic parameters neutrophil-to-lymphocyte ratio (NLR) that may reflect the balance between inflammation and immune response, has been shown to be useful for predicting the prognosis of patients with advanced NSCLC after immunotherapy [11,12].
The predictive value of NLR has not been evaluated in patients with NSCLC after neoadjuvant chemotherapy combined with immunotherapy, the aim of our study was to investigate the baseline and preoperative hematologic para-meter NLR to predict the pathological response and disease-free survival (DFS) of NSCLC patients receiving neoadjuvant chemotherapy combined with immunotherapy compared with neoadjuvant chemotherapy alone.

Materials and Methods

1. Patients

A total of 79 resectable NSCLC patients (II and IIIA stage) receiving surgery after neoadjuvant chemotherapy combined with PD-1 checkpoint inhibitors and 89 patients receiving surgery after neoadjuvant chemotherapy alone were enrolled in Tianjin cancer Hospital (Tianjin, China) from January 2018 to January 2020. The inclusion criteria were as follows: (1) patients with NSCLC confirmed by bronchoscopy biopsy or computed tomography (CT) guided puncture biopsy; (2) the preoperative staging was done with contrast-enhanced CT or positron emission tomography; (3) neoadjuvant chemotherapy combined with PD-1 checkpoint inhibitors (nivolumab, camrelizumab, or tislelizumab) or neoadjuvant chemotherapy alone were applied for at least two cycles before surgery; (4) peripheral blood was collected before neoadjuvant therapy initiation and surgery, respectively. The following data were collected from the medical records: age, sex, smoking history, histology, neoadjuvant therapy number of cycles, tumor size at baseline, and pathological response. The rate of major pathologic response (MPR; residual viable tumor in NSCLC ≤ 10%), pathological complete response (pCR; absence of any viable invasive tumor in the lung tissue and lymph node) and DFS which was defined by the symptom-, metastasis-, and recurrence-free survival time of patients after treatment were well calculated. The cutoff date was June 31, 2021.

2. Specimen collection

Peripheral venous blood samples of the patients were collected within 3 days prior to the first neoadjuvant treatment and within 3 days prior to surgery. Total white blood cell count (WBC), absolute neutrophil count (ANC), platelet count (PLT), absolute lymphocyte count (ALC), and tumor markers (carcinoembryonic antigen [CEA], squamous cell carcinoma antigen [SCC], and total prostate specific antigen [TPSA]) were collected. NLR was defined as the ratio of ANC to ALC. The upper limit of normal value is 5 μg/L for CEA, 1.5 μg/L for SCC, and 80 U/L for TPSA, respectively. Based on the reference range, the baseline levels of serum tumor markers CEA, SCC, and TPSA were categorized into normal and high.

3. Statistical analysis

Categorical variables were summarized as frequencies and percentages and analyzed by using the chi-square test or Fisher’s exact test. Continuous variables were analyzed by using Mann-Whitney U test for skewed distributed variables. The receiver operating characteristic (ROC) curve was plotted to determine the optimal cutoff values of baseline and preoperative NLR. The univariate and multivariate logistic regression analyses were performed to identify the independent predictors for pathological responses of neoadjuvant chemotherapy combined with PD-1 checkpoint inhibitors and neoadjuvant chemotherapy alone by using a forward stepwise procedure. The Kaplan-Meier method was used to estimate the probability of DFS, and the log-rank test was used to investigate the significance of differences between different NLR groups. The prognostic values of each variable were evaluated with univariate cox proportional hazard regression analyses. Multivariate analysis for DFS was performed using the variables that were significant on univariate analysis. The p-value less than 0.05 was considered statistically significant. SPSS ver. 24 (IBM Corp., Armonk, NY) was used for statistical analysis.

Results

1. Baseline clinical characteristics of patients

The main clinical characteristics of participants were presented in Table 1. The neoadjuvant chemotherapy combined with PD-1 checkpoint inhibitors group had 79 NSCLC patients (79.7% were smokers or ex-smokers), whose median age was 61 years old (range, 40 to 77 years), including 63 men (79.7%) and 16 women (20.3%). The squamous cell carcinomas, adenocarcinoma, and large cell carcinoma accounted for 55.7%, 26.6%, and 17.7% of these patients, respectively. The postoperative pathological results that there were 21 patients (26.6%) who had lymph node metastasis. Before surgery, all patients had received two or more cycles of neoadjuvant chemotherapy combined with PD-1 checkpoint inhibitors treatment: 39 (49.4%) cases had received two cycles of neoadjuvant treatment, 30 (38.0%) had received three cycles, and 10 (12.6%) had received four cycles.
The neoadjuvant chemotherapy alone group had 89 NSCLC patients (86.5% were smokers or ex-smokers), including 73 men (82.0%) and 16 women (18.0%). The squamous cell carcinomas, adenocarcinoma, and large cell carcinoma accounted for 60.7%, 33.7%, and 5.6% of these patients, respectively. There were 38 patients (42.7%) who had pathological lymph node metastasis.

2. Cutoff determination of baseline and preoperative NLR

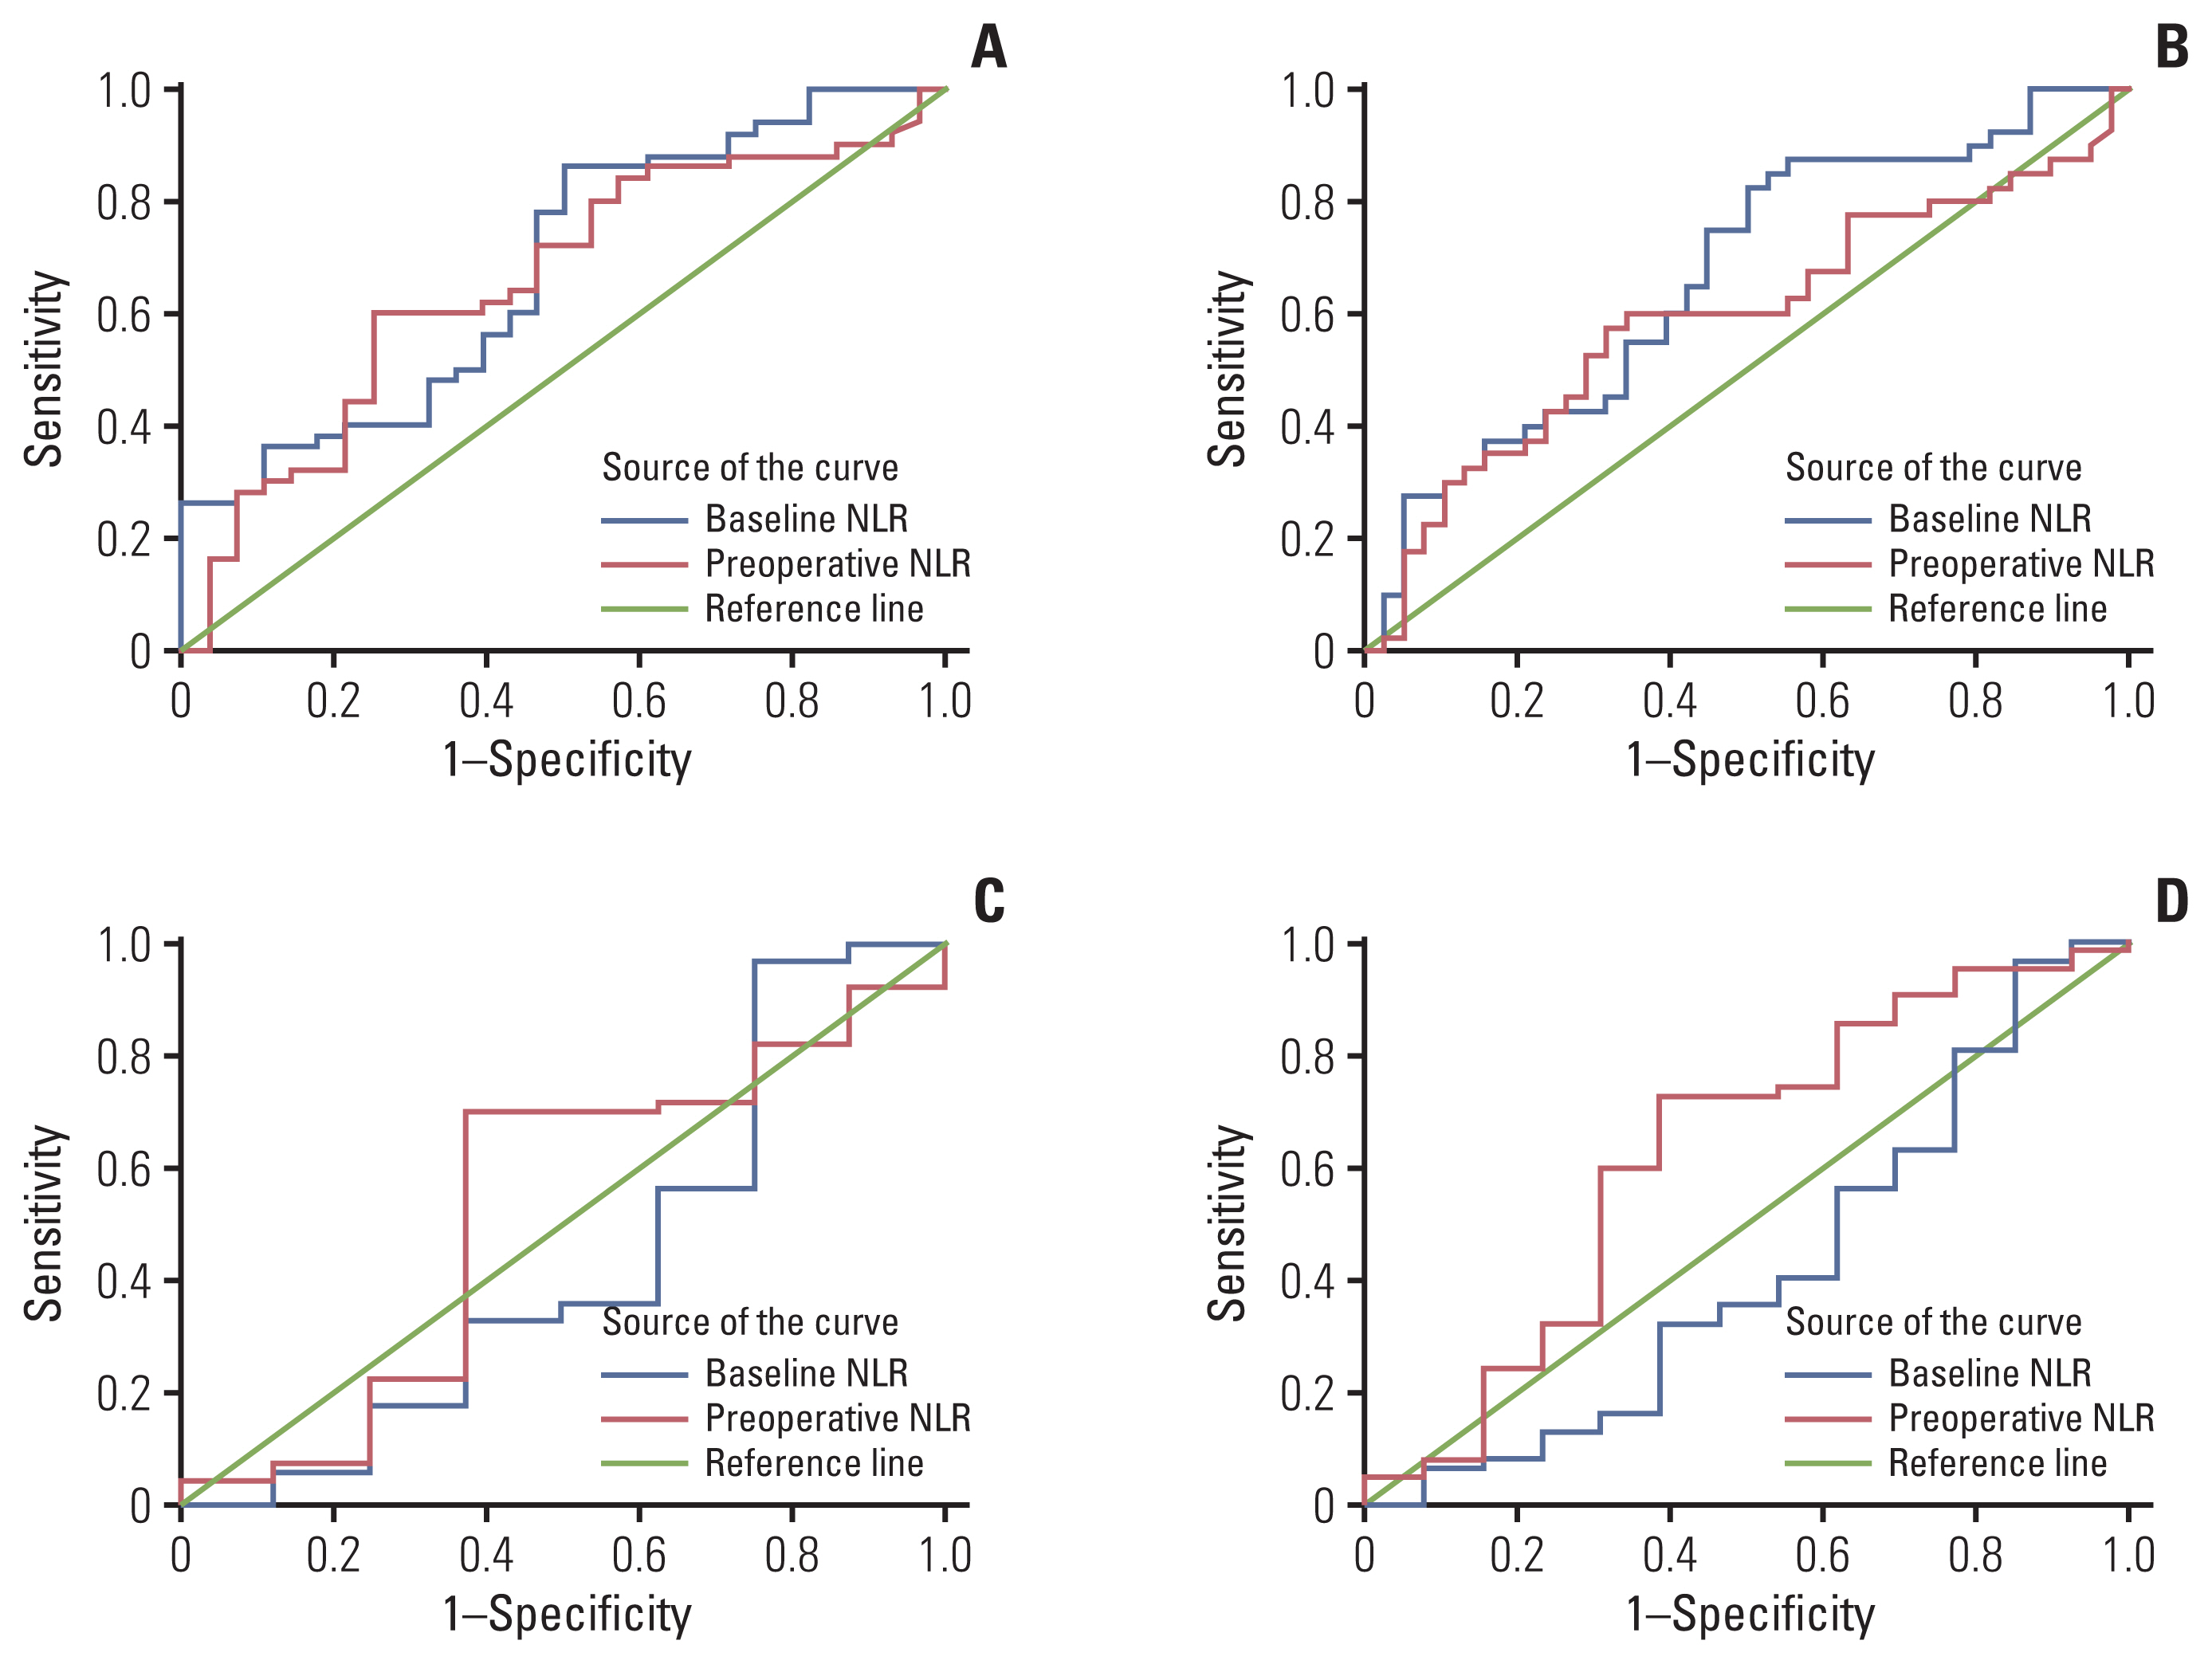
The optimum cutoff values for baseline and preoperative NLR were determined by ROC analysis, respectively. In neoadjuvant chemotherapy combined with PD-1 checkpoint inhibitors group, the cutoff point of baseline and preoperative NLR for predicting pCR were 1.96 (area under the curve [AUC], 0.679; sensitivity, 0.860; specificity, 0.500) and 1.89 (AUC, 0.657; sensitivity, 0.600; specificity, 0.750). The cutoff point of baseline NLR for predicting MPR was 2.05 (AUC, 0.664; sensitivity, 0.829; specificity, 0.500) and preoperative NLR for predicting MPR was 1.93 (AUC, 0.594; sensitivity, 0.575, specificity, 0.684). In neoadjuvant chemotherapy alone group, the cutoff point of baseline and preoperative NLR for predicting pCR were 1.01 (AUC, 0.433; sensitivity, 0.97; specificity, 0.25) and 1.43 (AUC, 0.516; sensitivity, 0.61; specificity, 0.63). The cutoff point of baseline NLR for predicting MPR was 1.01 (AUC, 0.422; sensitivity, 0.968; specificity, 0.154) and preoperative NLR for predicting MPR was 1.43 (AUC, 0.615; sensitivity, 0.694; specificity, 0.615) (Fig. 1). Patients were then divided into low and high NLR groups according to the cutoff values.

3. Correlations between baseline and preoperative hematological parameters and pathological response of neoadjuvant treatment

In neoadjuvant chemotherapy combined with PD-1 checkpoint inhibitors group, 48.1% (n=38) and 35.4% (n=28) of the patients reached MPR and pCR. While in the group of neoadjuvant chemotherapy alone group, the MPR and pCR were only 14.6% and 9.0%, respectively. The patients were divided into two groups: the group that achieved pCR after neoadjuvant therapy and the group that did not achieve pCR. The clinicopathological characteristics and hematological parameters between patients showing pCR and those not showing pCR were compared in Tables 1 and 2, respectively.
In neoadjuvant chemotherapy combined with PD-1 checkpoint inhibitors group, higher baseline and preoperative WBC, neutrophils, NLR, and higher preoperative PLT were observed in the non-pCR group than pCR group. However, in neoadjuvant chemotherapy alone group, there were no significant differences in these hematological parameters between the non-pCR and pCR group (Table 2).
Then we assessed the correlations between NLR and MPR and found that higher baseline NLR was observed in the non-MPR groups in neoadjuvant chemotherapy combined with PD-1 checkpoint inhibitors group. What’s more, there were no significant differences between NLR and MPR in neoadjuvant chemotherapy alone group (Fig. 2). Fig. 2 showed the correlations between NLR and pathological responses.
Univariate logistic regression analysis (Table 3) showed that histology, lymph node metastasis or not, baseline CEA, baseline and preoperative NLR were significantly correlated with pCR and MPR in neoadjuvant chemotherapy combined with PD-1 checkpoint inhibitors group. Lymph node metastasis, baseline and preoperative NLR were significantly correlated with pCR and MPR in neoadjuvant chemotherapy alone group. Multivariate logistic regression analysis (Table 4) revealed that lymph node metastasis or not (pCR: p=0.033; hazard ratio [HR], 11.741; 95% confidence interval [CI], 1.212 to 11.371; MPR: p=0.013; HR, 26.385; 95% CI, 1.980 to 35.163), and baseline NLR (pCR: p=0.030; HR, 5.407; 95% CI, 1.178 to 24.825; MPR: p=0.015; HR, 10.549; 95% CI, 1.562 to 72.924) could independently predict pCR and MPR after neoadjuvant chemotherapy combined with PD-1 checkpoint inhibitors in patients with NSCLC. However, the baseline and preoperative NLR were not independently predictive factor for pCR or MPR in neoadjuvant chemotherapy alone group.

4. Correlations between baseline and preoperative NLR and DFS

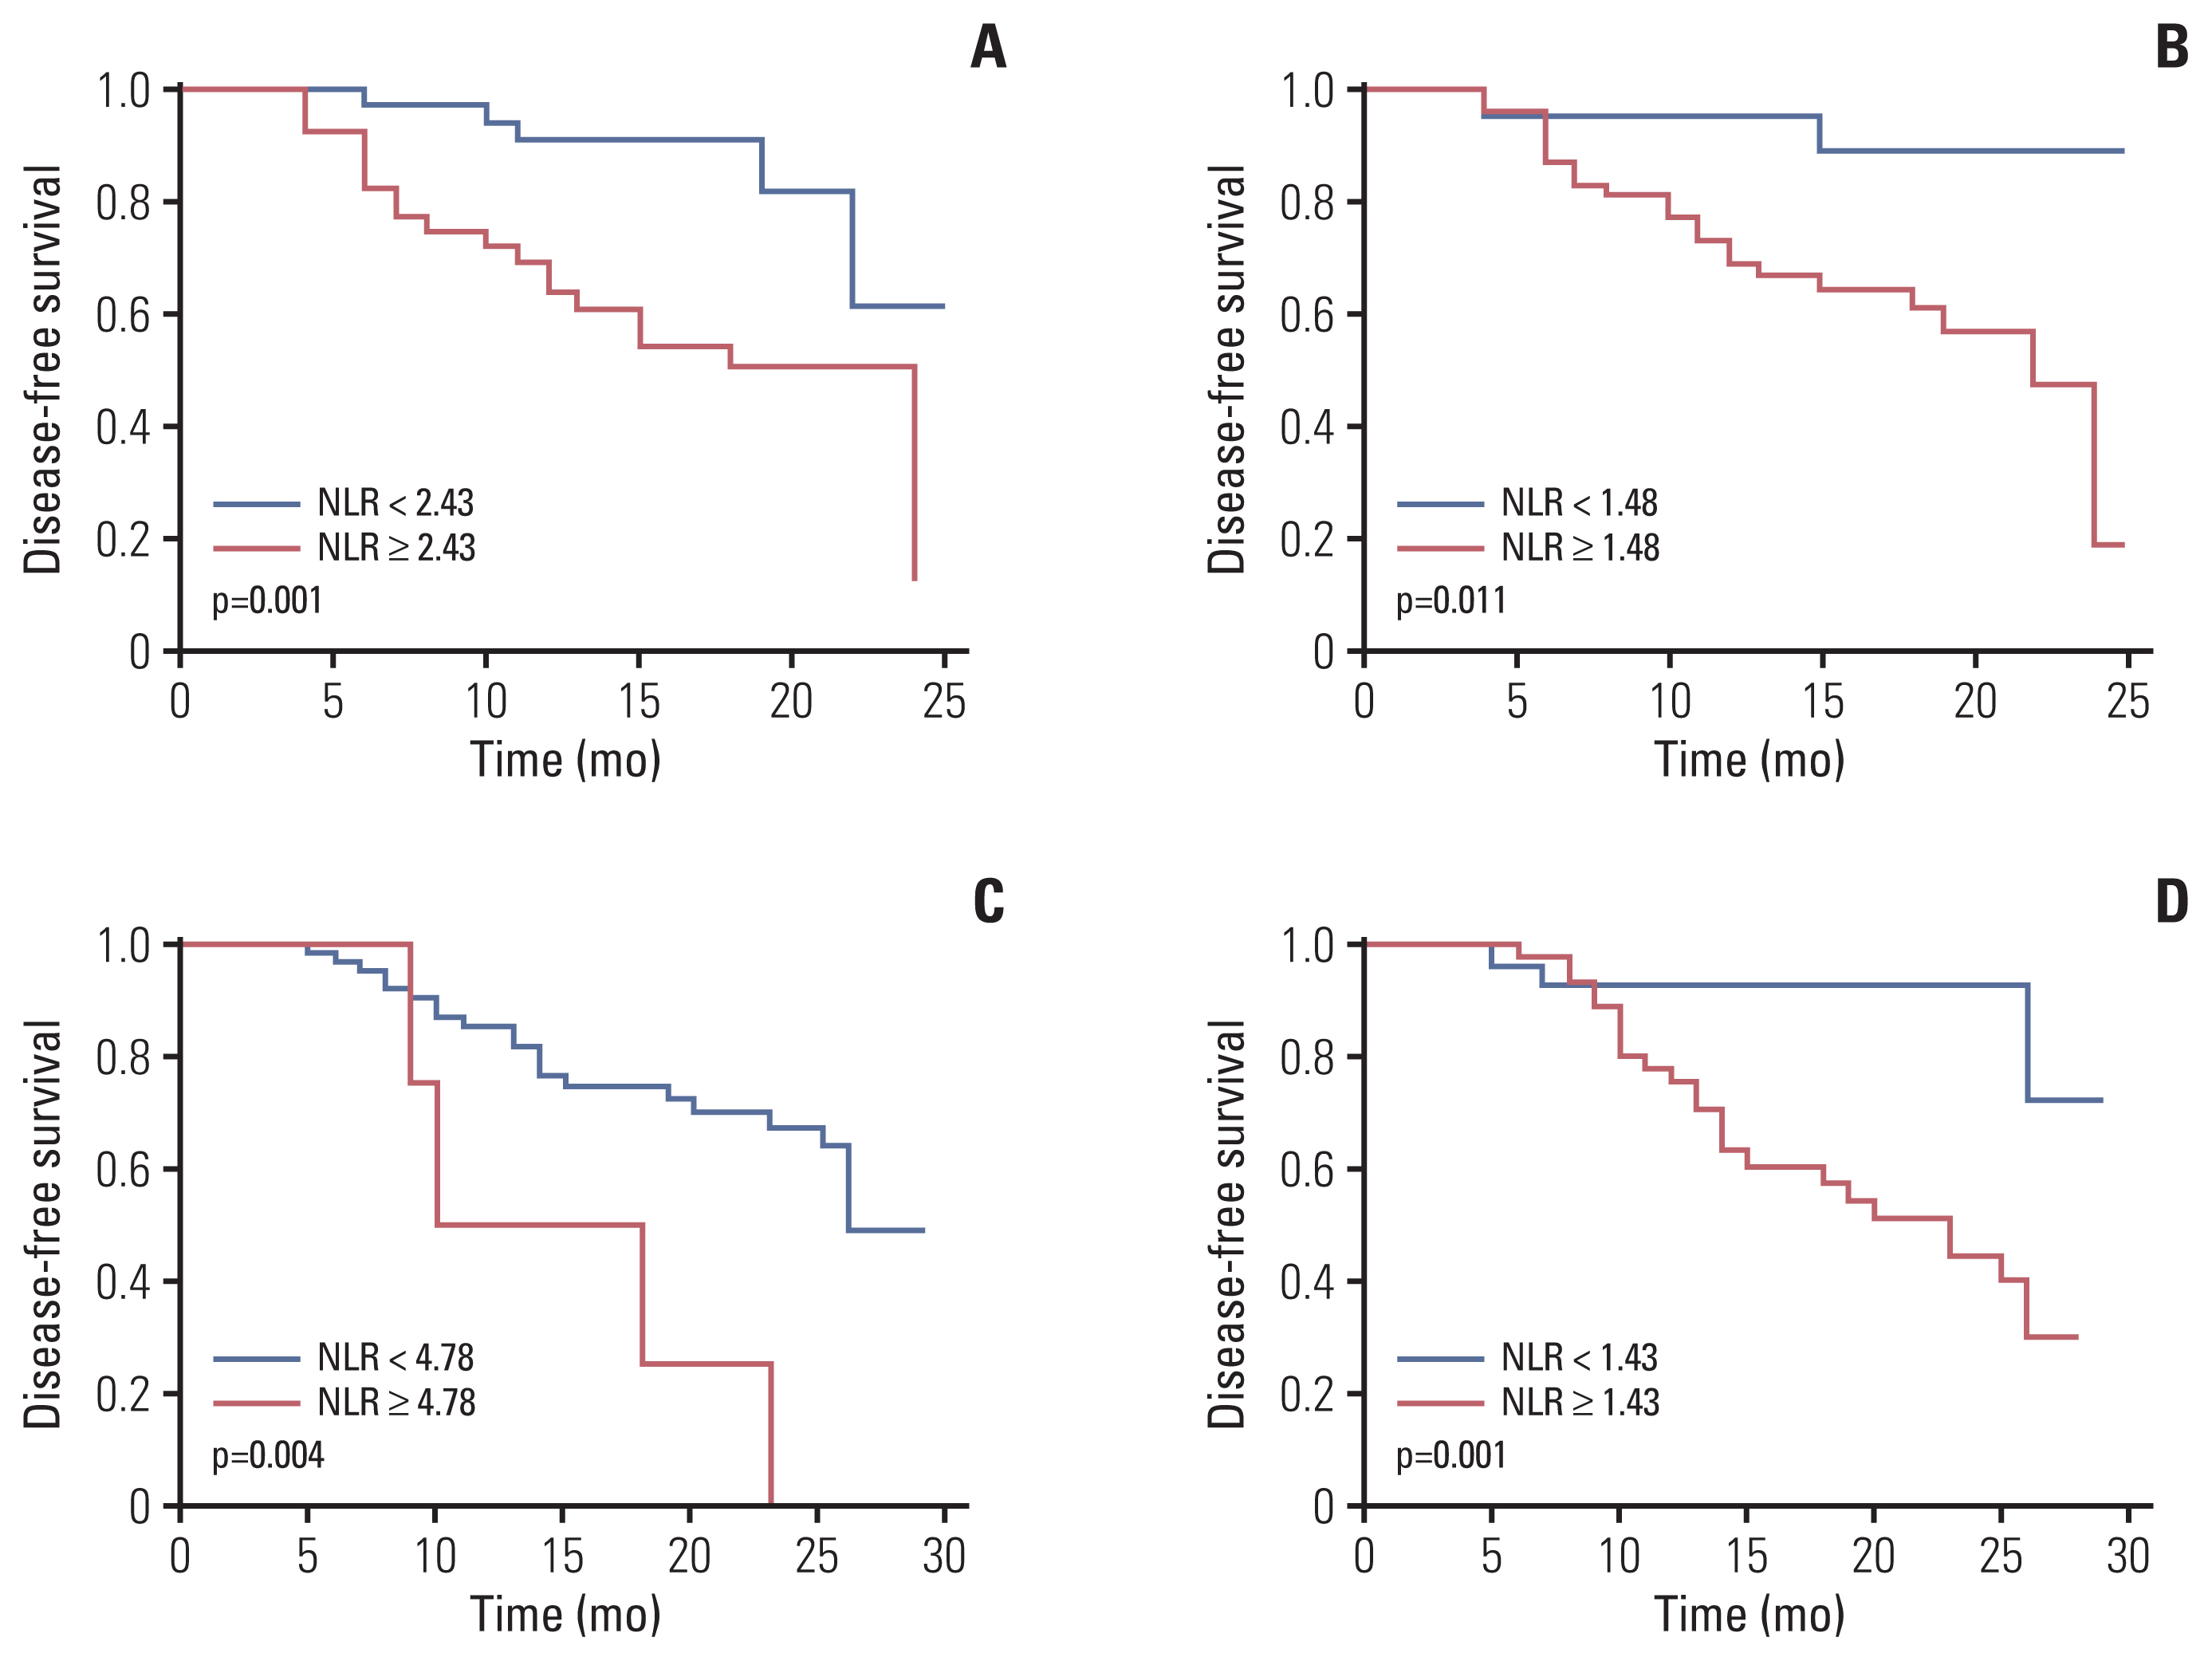
We further analyzed the correlations between NLR and DFS in neoadjuvant chemotherapy combined with PD-1 checkpoint inhibitors group. After a median follow-up of 18 months for the entire cohort, 26 patients had disease relapse or progression. The optimum cutoff values of baseline and preoperative NLR for predicting DFS were 2.43 and 1.48 determined by ROC analysis as mentioned above. Low baseline and preoperative NLR group had better DFS than high baseline and preoperative NLR group (Fig. 3). The univariate cox analysis results revealed that the baseline NLR and preoperative NLR were significantly correlated with DFS, as well as lymph node metastasis or not and baseline CEA. Multivariate cox regression analysis determined that baseline NLR and lymph node metastasis or not were independent predictors of DFS in patients with NSCLC in neoadjuvant chemotherapy combined with PD-1 checkpoint inhibitors group (Table 5).
In neoadjuvant chemotherapy alone group, after a median follow-up of 24 months for the entire cohort, 33 patients had disease relapse or progression. The optimum cutoff values of baseline and preoperative NLR for predicting DFS were 4.78 and 1.43, respectively. Low baseline and preoperative NLR group had better DFS than high baseline and preoperative NLR group (Fig. 3). However, the baseline and preoperative NLR were not independently predictive factor for DFS in neoadjuvant chemotherapy alone group (Table 5).

Discussion

To the best of our knowledge, this study is the first time to evaluate the predictive values of baseline and preoperative inflammatory factor NLR for pathological response and DFS of patients with resectable NSCLC receiving neoadjuvant chemotherapy or combined with PD-1 checkpoint inhibitors. The findings suggested that high baseline and preoperative NLR level were correlated with poor pathological response and DFS in NSCLC patients undergoing neoadjuvant chemotherapy alone or combined with PD-1 checkpoint inhibitors. In addition, NLR level significantly declined from baseline to preoperative after neoadjuvant therapy. Furthermore, baseline NLR could independently predict pCR, MPR, and DFS of NSCLC patients undergoing neoadjuvant chemotherapy combined with PD-1 checkpoint inhibitors.
It is very well known that patients achieving pCR or MPR after neoadjuvant immunotherapy usually had longer DFS and overall survival (OS) compared with neoadjuvant therapy. For this reason, primary endpoint in recent neoadjuvant therapy studies are pCR and MPR to predict the DFS and OS [13]. Previous studies showed that only 5%-8% of patients had pCR for neoadjuvant chemotherapy alone in patients with stage IIIA NSCLC [14]. Neoadjuvant chemotherapy combined with PD-1/PD-L1 inhibitors has changed the treatment landscape of metastatic NSCLC, which guided us to explore the effectiveness of this strategy in the neoadjuvant therapy. Our study showed that 48.1% of patients had MPR and 35.4% of patients achieved pCR in neoadjuvant chemotherapy combined with PD-1 checkpoint inhibitors group, whereas the MPR and pCR were only 14.6% and 9.0% in neoadjuvant chemotherapy alone group, respectively.
Inflammation can stimulate angiogenesis and affect immune surveillance as well as treatment response [15]. Tumorigenesis and progress are driven by the production of inflammatory cytokines, which could recruit inflammatory cells like neutrophils and platelet counts. Lymphopenia has a negative effect on cell-mediated immunity that initiate tumor cell death, and there has been growing evidence supporting the relationship between lymphopenia during neoadjuvant therapy and pathological response in patients with cancer [16,17]. Fang et al. [18] found that a higher lymphocyte level during neoadjuvant therapy was associated with a higher rate of pCR in patients with esophageal adenocarcinoma. In this study, baseline and preoperative WBC, neutrophils, and preoperative platelet counts were significantly higher in the non-PCR group than in the pCR group in neoadjuvant chemotherapy combined with PD-1 checkpoint inhibitors group. Thus, by assessing the status of these tumor-associated inflammatory responses, this might be evidence for early clinical evaluation of antitumor activity and potential therapeutic effects. This could be further explored to help differentiate between those who are not achieved pCR responding to treatment versus those achieved pCR.
Recent study reported that pretreatment derived neutrophil-to-lymphocyte ratio was found to be a predictive factor for pCR in patients with breast cancer treated with neoadjuvant chemotherapy [19]. While high NLR was found to be associated with poor survival in NSCLC patients receiving neoadjuvant chemotherapy [20], its relationship with pathological response is uncertain. Our results indicated that high baseline NLR was related to poor pCR and MPR in patients with NSCLC receiving neoadjuvant chemotherapy combined with PD-1 checkpoint inhibitors, as well as baseline CEA and lymph node metastasis or not. CEA has been mainly investigated as prognostic or predictive markers in NSCLC patients treated with chemotherapy. Recent study reported that CEA may serve as a reliable marker of efficacy in NSCLC patients treated with nivolumab when considering the determination of the markers at baseline [21]. Lymph node stations is a more accurate prognostic indicator in patients with completely resected non-small cell lung cancer [22]. But their effect on pathological responses and prognosis in neoadjuvant therapy has rarely been reported and needs further investigation. However, there were no significant differences in neoadjuvant chemotherapy alone group and it might be due to the low number of patients reaching pCR or MPR. We will increase the sample size for further verification in the subsequent study.
Hematologic parameter NLR value has been reported as a prognostic biomarker in patients with solid tumor [23,24]. Recent studies have showed that NLR was significantly associated with prognosis in patients with NSCLC and other metastatic solid tumors treated with immunotherapy [25,26]. It was reported that high pretreatment NLR (≥ 5) was independently related to poorer OS and PFS in advanced NSCLC patients treated with nivolumab [11,26]. In operable NSCLC patient, previous studies showed that a high preoperative NLR was an independent negative prognostic indicator [27]. Our results indicate that a high degree of NLR was corresponded to a poor DFS in patients with NSCLC and to the best of our knowledge is the first to report the prognostic value of inflammatory factor NLR in NSCLC patients receiving neoadjuvant chemotherapy combined with PD-1 checkpoint inhibitors.
In this study, baseline NLR showed an independent predictive ability for pathological response and DFS after neoadjuvant chemotherapy combined with PD-1 checkpoint inhibitors. However, the preoperative NLR did not show an independent predictive ability for pCR or MPR in multivariate analysis, which may be related to the inherent correlation between baseline and preoperative NLR. This phenomenon has been described in some studies [28], and it still needs to be further explored.
Because of readily available, non-invasive, and economic advantages, NLR can be used as a predictor of efficacy of neoadjuvant chemotherapy combined with PD-1 checkpoint inhibitors. We are aware of the limitations of our study. The study is a retrospective study and cannot control the influence of confounding factors on the results. In addition, the sample size is small and samples only come from single center and single-race that will not be generalized. No significant difference in NLR between the different pathological response groups especially in neoadjuvant chemotherapy alone group might due to the limited sample size. We will further expand the sample size for verification in the future. Therefore, whether it can be widely used in clinical practice to help evaluate the pathological response and prognosis of NSCLC patients treated with neoadjuvant therapy will require further study.
Our study proposed that a high baseline and preoperative NLR level were correlated with poor pathological response and DFS in NSCLC patients undergoing neoadjuvant chemotherapy alone or combined with PD-1 checkpoint inhibitors. Moreover, baseline NLR could independently predict pCR, MPR and DFS in neoadjuvant chemotherapy combined with PD-1 checkpoint inhibitors group. We believe that the inflammatory factor NLR, which can be detected in a simple, quick, cheap, and practical manner, may be used as an auxiliary clinical indicator to increase the predictability of pathological response and DFS in NSCLC patients undergoing neoadjuvant chemotherapy combined with PD-1 checkpoint inhibitors.

Notes

Ethical Statement

The study was approved by the Ethics Committee of Tianjin Medical University Cancer Institute and Hospital. Individual written informed consent for this study was acquired (approval number: bc2021187).

Author Contributions

Conceived and designed the analysis: Sun X, Feng Y, Zhao X, Zhang B.

Collected the data: Sun X, Feng Y.

Contributed data or analysis tools: Sun X, Feng Y, Huang W, Zhao X, Zhang H.

Performed the analysis: Sun X, Feng Y, Huang W.

Wrote the paper: Sun X, Feng Y.

Corrected the manuscript critically for important intellectual content: Zhang B, Yue D, Wang C.

Conflicts of Interest

Conflict of interest relevant to this article was not reported.

Acknowledgments

This work was supported by National Natural Science Foundation of China (grant number 81772484); Tianjin Cancer Hospital Clinical Trial Project (grant number: C1705). We thank all the participants who contributed to the article.

Fig. 1
Receiver operating characteristic curve identified the cutoff point of neutrophil-to-lymphocyte ratio (NLR). (A) Baseline and preoperative NLR for predicting pathological complete response (pCR) were 1.96 (area under the curve [AUC], 0.679; sensitivity, 0.86; specificity, 0.50] and 1.89 (AUC, 0.657; sensitivity, 0.60; specificity, 0.75) in neoadjuvant chemotherapy combined with immunotherapy group. (B) Baseline and preoperative NLR for predicting major pathologic response (MPR) were 2.05 (AUC, 0.664; sensitivity, 0.829; specificity, 0.500) and 1.93 (AUC, 0.594; sensitivity, 0.575; specificity, 0.684) in neoadjuvant chemotherapy combined with immunotherapy group. (C) Baseline and preoperative NLR for predicting pCR were 1.01 (AUC, 0.433; sensitivity, 0.97; specificity, 0.25) and 1.43 (AUC, 0.516; sensitivity, 0.61; specificity, 0.63) in neoadjuvant chemotherapy alone group. (D) Preoperative NLR for predicting MPR were 1.01 (AUC, 0.422; sensitivity, 0.968; specificity, 0.154) and 1.43 (AUC, 0.615; sensitivity, 0.694; specificity, 0.615) in neoadjuvant chemotherapy alone group.
crt-2021-1007f1.jpg
Fig. 2
The correlations between baseline and preoperative neutrophil-to-lymphocyte ratio (NLR) and pathological responses. (A–D) Neoadjuvant chemotherapy combined with programmed death-1 (PD-1) checkpoint inhibitors group. (A) The difference of baseline NLR between pathological complete response (pCR; mean±standard deviation, 2.39±1.19) and non-pCR (3.60±2.27) patients (p=0.009). (B) The difference of preoperative NLR between pCR (2.33±3.84) and non-pCR (2.32±1.30) patients (p=0.022). (C) The difference of baseline NLR between major pathologic response (MPR; 2.76±2.15) and non-MPR (3.55±1.86) patients (p=0.012). (D) The difference of preoperative NLR between MPR (2.35±3.33) and non-MPR (2.30±1.33) patients (p=0.154). (E–H) Neoadjuvant chemotherapy alone group. (E) The difference of baseline NLR between pCR (3.98±4.56) and non-pCR (2.48±1.11) patients (p=0.537). (F) the difference of preoperative NLR between pCR (2.50±2.04) and non-pCR (2.29±2.21) patients (p=0.880). (G) The difference of baseline NLR between MPR (3.52±3.60) and non-MPR (2.45±1.12) patients (p=0.378). (H) The difference of preoperative NLR between MPR (2.03±1.72) and non-MPR (2.36±2.26) patients (p=0.187).
crt-2021-1007f2.jpg
Fig. 3
Kaplan-Meier analysis of disease-free survival in relation to neutrophil-to-lymphocyte ratio (NLR). Kaplan-Meier curves for disease-free survival (DFS). (A) DFS curve of patients with baseline NLR in neoadjuvant chemotherapy combined with programmed death-1 (PD-1) checkpoint inhibitors group (p=0.001). (B) DFS curve of patients with preoperative NLR in neoadjuvant chemotherapy combined with PD-1 checkpoint inhibitors group (p=0.011). (C) DFS curve of patients with baseline NLR in neoadjuvant chemotherapy alone group (p=0.004). (D) DFS curve of patients with preoperative NLR in neoadjuvant chemotherapy alone group (p=0.001).
crt-2021-1007f3.jpg
Table 1
The correlation between pathological response and clinical-pathological variables in the two different treatment groups
Characteristic Neoadjuvant chemotherapy combined with immunotherapy group Neoadjuvant chemotherapy group


pCR (n=28) Non-pCR (n=51) Total p-value pCR (n=8) Non-pCR (n=81) Total p-value
Sex

 Male 25 38 63 (79.7) 0.118 6 67 73 (82.0) 0.593

 Female 3 13 16 (20.3) 2 14 16 (18.0)

Age (yr)

 < 61 9 22 31 (39.2) 0.338 4 40 44 (49.4) 0.973

 ≥ 61 19 29 48 (60.8) 4 41 45 (50.6)

Smoking history

 Smoker or ex-smoker 23 40 63 (79.7) 0.695 8 69 77 (86.5) 0.262

 Never smoker 5 11 16 (20.3) 0 11 11 (12.4)

Histology

 Squamous cell carcinomas 19 25 44 (55.7) 0.061 5 49 54 (60.7) 0.462

 Adenocarcinoma 3 18 21 (26.6) 2 28 30 (33.7)

 Large cell carcinoma 6 8 14 (17.7) 1 4 5 (5.6)

Neoadjuvant therapy number of cycles

 2 11 28 39 (49.4) 0.095 6 52 58 (65.2) 0.857

 3 15 15 30 (38.0) 1 19 20 (22.5)

 4 2 8 10 (12.6) 1 10 11 (12.4)

N stage

 N0 27 31 58 (73.4) 0.003 7 44 51 (57.3) 0.070

 N1–2 1 20 5 (26.6) 1 37 38 (42.7)

Baseline CEA

 Normal 18 23 41 (56.9) 0.029 5 48 53 (59.6) 0.859

 High 6 25 31 (43.1) 3 33 36 (40.4)

Baseline SCC

 Normal 13 32 45 (62.5) 0.302 5 52 57 (64.0) 0.920

 High 11 16 27 (37.5) 3 29 32 (36.0)

Baseline TPSA

 Normal 13 26 39 (59.1) 0.539 5 44 49 (55.1) 0.657

 High 11 16 27 (40.9) 3 37 40 (44.9)

CEA, carcinoembryonic antigen; pCR, pathological complete response; SCC, squamous cell carcinoma antigen; TPSA, total prostate specific antigen.

Table 2
The correlation between pathological response and hematologic parameters in the two different neoadjuvant treatment groups
Characteristic Neoadjuvant chemotherapy combined with immunotherapy group Neoadjuvant chemotherapy group


pCR (n=28) Non-pCR (n=51) Total p-value pCR (n=8) Non-pCR (n=81) Total p-value
Baseline WBC (×109/L) 6.69 (4.99–12.18) 8.12 (3.35–23.56) 7.42 (3.35–23.56) 0.009 7.19 (4.95–12.47) 7.05 (3.23–18.99) 7.06 (3.23–18.99) 0.605

Baseline neutrophils (×109/L) 3.93 (2.34–9.01) 5.60 (1.73–19.24) 4.80 (1.73–19.24) 0.001 4.70 (1.94–10.85) 4.32 (1.5–12.53) 4.38 (1.50–12.53) 0.789

Baseline monocytes (×109/L) 0.51 (0.11–1.03) 0.56 (0.06–5.90) 0.53 (0.06–5.90) 0.166 0.52 (0.27–0.84) 0.53 (0.09–1.13) 0.53 (0.09–1.13) 0.746

Baseline lymphocyte (×109/L) 2.10 (1.16–3.75) 1.84 (0.78–3.99) 1.90 (0.78–3.99) 0.335 1.92 (0.73–3.52) 1.88 (0.82–5.07) 1.89 (0.73–5.07) 0.817

Baseline platelet (×109/L) 248.50 (103.00–387.00) 286.00 (146.00–541.00) 267.00 (103.00–541.00) 0.026 272.00 (145.00–317.00) 277.00 (160.00–563.00) 273.00 (145.00–563.00) 0.733

Baseline NLR 2.00 (0.85–4.76) 2.88 (1.20–13.23) 2.61 (0.85–13.23) 0.009 2.74 (0.77–14.86) 2.25 (0.86–6.28) 2.31 (0.77–14.86) 0.537

Preoperative WBC (×109/L) 5.30 (3.80–15.36) 6.47 (2.43–12.66) 5.86 (2.43–15.36) 0.035 5.28 (4.39–7.29) 6.14 (3.06–15.70) 5.99 (3.06–15.70) 0.128

Preoperative neutrophils (×109/L) 2.76 (1.21–13.65) 3.31 (1.04–9.34) 3.19 (1.04–13.65) 0.013 2.86 (2.27–3.58) 3.37 (0.58–12.63) 3.32 (0.58–12.63) 0.127

Preoperative monocytes (×109/L) 0.56 (0.30–1.08) 0.60 (0.18–1.35) 0.58 (0.18–1.35) 0.059 0.48 (0.33–0.93) 0.57 (0.24–1.44) 0.56 (0.24–1.44) 0.134

Preoperative lymphocyte (×109/L) 2.06 (0.63–2.79) 1.73 (0.79–3.09) 1.83 (0.63–3.09) 0.632 1.78 (0.84–3.30) 2.03 (0.47–3.83) 2.02 (0.47–3.83) 0.851

Preoperative platelet (×109/L) 222.00 (93.00–690.00) 237.50 (147.00–384.00) 233.50 (93.00–690.00) 0.186 215.50 (166.00–260.00) 230.00 (117.00–509.00) 224.00 (117.00–509.00) 0.489

Preoperative NLR 1.63 (0.53–21.67) 2.02 (0.79–7.52) 1.83 (0.53–21.67) 0.022 1.38 (0.85–6.20) 1.83 (0.21–17.68) 1.69 (0.21–17.68) 0.880

Values are presented as median (range). NLR, neutrophil-to-lymphocyte ratio; pCR, pathological complete response; WBC, white blood cell.

Table 3
Univariate analysis of pCR and MPR for neoadjuvant chemotherapy or combined with immunotherapy group
Characteristic Univariate for pCR and MPR in neoadjuvant chemotherapy combined with immunotherapy group Univariate for pCR and MPR in neoadjuvant chemotherapy group


p-value for pCR Odds ratio (95% CI) p-value for MPR Odds ratio (95% CI) p-value for pCR Odds ratio (95% CI) p-value for MPR Odds ratio (95% CI)
Sex

Male or female 0.129 2.851 (0.737–11.031) 0.102 3.517 (1.023–12.097) 0.590 - 0.793 0.805 (0.160–4.046)

Age (yr)

 < 61 or ≥ 61 0.340 0.624 (0.237–1.643) 0.388 0.534 (0.922–5.930) 0.973 0.976 (0.228–4.171) 0.349 0.563 (0.169–1.876)

Smoking history (smoker, ex-smoker or never smoker) 0.695 1.265 (0.391–4.096) 0.138 2.420 (0.753–7.774) 0.860 1.217 (0.137–10.803) 0.456 2.250 (0.267–18.955)

Histology 0.082 0.014 0.644 0.349

 Squamous cell carcinomas 0.983 0.987 (0.293–3.326) 0.897 0.923 (0.273–3.118) 0.460 0.408 (0.038–4.395) 0.935 0.909 (0.091–9.035)

 Adenocarcinoma 0.068 4.500 (0.893–22.668) 0.025 5.777 (1.241–25.878) 0.349 0.286 (0.021–3.921) 0.349 0.286 (0.021–3.921)

 Others 1 1 1 1

Neoadjuvant therapy number of cycles (≤ 2 or >2) 0.187 0.532 (0.208–1.358) 0.429 0.699 (0.288–1.696) 0.544 1.673 (0.317–8.830) 0.342 1.944 (0.493–7.666)

N (N0 or N1–2) 0.007 17.419 (2.190–138.540) 0.001 9.130 (2.413–34.546) 0.095 0.162 (0.019–1.374) 0.039 0.192 (0.040–0.923)

Baseline CEA (normal or high) 0.033 3.261 (1.103–9.637) 0.018 3.281 (1.231–8.745) 0.859 1.146 (0.256–5.127) 0.874 1.102 (0.330–3.687)

Preoperative CEA (normal or high) 0.150 3.266 (0.653–16.338) 0.296 2.000 (0.545–7.337) 0.657 0.710 (0.156–3.221) 0.988 0.990 (0.275–3.561)

Baseline SCC (normal or high) 0.304 0.591 (0.217–1.610) 0.164 0.502 (0.191–1.324) 0.924 0.929 (0.207–4.173) 0.410 0.607 (0.185–1.992)

Preoperative SCC (normal or high) 0.564 0.684 (0.189–2.478) 0.135 2.640 (0.738–9.439) 0.409 0.540 (0.125–2.332) 0.643 0.741 (0.208–2.640)

Baseline TPSA (normal or high) 0.539 0.727 (0.263–2.009) 0.964 0.977 (0.366–2.609) 0.658 1.403 (0.314–6.260) 0.612 1.366 (0.409–4.557)

Preoperative TPSA (normal or high) 0.173 2.631 (0.654–10.590) 0.101 3.136 (0.878–10.209) 0.628 1.429 (0.260–7.854) 0.643 1.343 (0.386–4.668)

Baseline NLR (normal or high) 0.001 6.286 (2.117–18.668) 0.005 4.371 (1.556–12.282) 0.020 12.000 (1.498–11.28) 0.090 6.000 (0.756–47.63)

Preoperative NLR (normal or high) 0.004 4.500 (1.614–12.549) 0.023 2.931 (1.159–7.413) 0.032 6.240 (1.175–33.144) 0.039 3.636 (1.069–12.375)

CEA, carcinoembryonic antigen; CI, confidence interval; MPR, major pathologic response; NLR, neutrophil-to-lymphocyte ratio; pCR, pathological complete response; SCC, squamous cell carcinoma antigen; TPSA, total prostate specific antigen.

Table 4
Multivariate analysis of pCR and MPR for neoadjuvant chemotherapy or combined with immunotherapy group
Characteristic Multivariate for pCR and MPR in neoadjuvant chemotherapy combined with immunotherapy group Multivariate for pCR and MPR in neoadjuvant chemotherapy group


p-value for pCR Odds ratio (95% CI) p-value for MPR Odds ratio (95% CI) p-value for pCR Odds ratio (95% CI) p-value for MPR Odds ratio (95% CI)
Histology 0.654 - 0.313 - - - - -

Squamous cell carcinomas 0.820 0.839 (0.185–3.809) 0.334 0.375 (0.051–2.744) - - - -

Adenocarcinoma 0.531 1.851 (0.270–12.697) 0.710 1.522 (0.166–13.960) - - - -

Others 1 1

N (N0 or N1–2) 0.033 11.741 (1.212–11.371) 0.013 26.385 (1.980–35.163) 0.278 0.275 (0.027–2.830) 0.129 0.271 (0.050–1.460)

Baseline CEA (normal or high) 0.333 1.908 (0.516–7.052) 0.834 1.172 (0.267–5.144) - - - -

Baseline NLR (normal or high) 0.030 5.407 (1.178–24.825) 0.015 10.549 (1.562–72.924) 0.095 7.774 (0.700–8.628) 0.318 3.284 (0.319–33.795)

Preoperative NLR (normal or high) 0.546 1.520 (0.391–5.916) 0.876 1.130 (0.190–4.119) 0.264 2.979 (0.439–20.192) 0.109 3.223 (0.770–13.480)

CEA, carcinoembryonic antigen; CI, confidence interval; MPR, major pathologic response; NLR, neutrophil-to-lymphocyte ratio; pCR, pathological complete response.

Table 5
Univariate and multivariate analysis of DFS in neoadjuvant chemotherapy or combined with immunotherapy group
Characteristic Univariate for DFS in neoadjuvant chemotherapy combined with immunotherapy group Multivariate for DFS in neoadjuvant chemotherapy combined with immunotherapy group Univariate for DFS in neoadjuvant chemotherapy group Multivariate for DFS in neoadjuvant chemotherapy group


p-value Odds ratio (95% CI) p-value Odds ratio (95% CI) p-value Odds ratio (95% CI) p-value Odds ratio (95% CI)
Sex (male or female) 0.284 1.579 (0.685–3.639) - - 0.500 0.755 (0.334–1.708) - -

Age (< 61 yr or ≥ 61 yr) 0.524 0.756 (0.320–1.787) - - 0.319 0.682 (0.322–1.448) - -

Smoking history (smoker, ex-smoker or never smoker) 0.336 1.532 (0.642–3.657) - - 0.245 1.626 (0.717–3.689) - -

Histology 0.120 - - - 0.284 - - -

 Squamous cell carcinomas 0.247 2.413 (0.543–10.721) 0.945 1.074 (0.140–8.219)

 Adenocarcinoma 0.061 4.232 (0.933–19.187) - - 0.526 1.928 (0.254–14.638) - -

 Others 1 1

Neoadjuvant therapy number of cycles (≤ 2 or > 2) 0.587 0.807 (0.373–1.749) - - 0.849 1.076 (0.507–2.283) - -

N (N0 or N1–2) 0.001 4.067 (1.739–9.512) 0.038 1.645 (1.028–2.633) 0.002 0.265 (0.113–0.621) 0.212 0.549 (0.214–1.410)

Baseline CEA (normal or high) 0.010 3.108 (1.310–7.375) 0.077 2.277 (0.915–5.663) 0.336 1.433 (0.688–2.982) - -

Preoperative CEA (normal or high) 0.922 1.056 (0.355–3.141) - - 0.374 0.714 (0.340–1.500) - -

Baseline SCC (normal or high) 0.143 0.496 (0.194–1.268) - - 0.335 0.658 (0.281–1.542) - -

Preoperative SCC (normal or high) 0.808 0.882 (0.321–2.423) - - 0.343 0.695 (0.327–1.476) - -

Baseline TPSA (normal or high) 0.491 0.711 (0.269–1.877) - - 0.122 1.789 (0.856–3.741) - -

Preoperative TPSA (normal or high) 0.302 1.625 (0.647–4.082) - - 0.425 1.396 (0.615–3.172) - -

Baseline NLR (normal or high) 0.004 4.264 (1.605–11.328) 0.019 3.848 (1.252–11.827) 0.008 4.337 (1.460–12.886) 0.109 2.517 (0.813–7.791)

Preoperative NLR (normal or high) 0.026 5.131 (1.212–21.727) 0.151 3.034 (0.668–13.776) 0.004 4.741 (1.644–13.669) 0.067 2.904 (0.926–9.102)

CEA, carcinoembryonic antigen; CI, confidence interval; DFS, disease-free survival; NLR, neutrophil-to-lymphocyte ratio; SCC, squamous cell carcinoma antigen; TPSA, total prostate specific antigen.

References

1. Torre LA, Bray F, Siegel RL, Ferlay J, Lortet-Tieulent J, Jemal A. Global cancer statistics, 2012. CA Cancer J Clin. 2015;65:87–108.
crossref pmid pdf
2. Liu L, Wei S. Research progress of KRAS mutation in non-small cell lung cancer. Zhongguo Fei Ai Za Zhi. 2018;21:419–24.
pmid pmc
3. Antonia SJ, Villegas A, Daniel D, Vicente D, Murakami S, Hui R, et al. Durvalumab after chemoradiotherapy in stage III non-small-cell lung cancer. N Engl J Med. 2017;377:1919–29.
crossref pmid
4. Garon EB, Rizvi NA, Hui R, Leighl N, Balmanoukian AS, Eder JP, et al. Pembrolizumab for the treatment of non-small-cell lung cancer. N Engl J Med. 2015;372:2018–28.
crossref pmid
5. Gandhi L, Rodriguez-Abreu D, Gadgeel S, Esteban E, Felip E, De Angelis F, et al. Pembrolizumab plus chemotherapy in metastatic non-small-cell Lung Cancer. N Engl J Med. 2018;378:2078–92.
crossref pmid
6. Paz-Ares L, Luft A, Vicente D, Tafreshi A, Gumus M, Mazieres J, et al. Pembrolizumab plus chemotherapy for squamous non-small-cell lung cancer. N Engl J Med. 2018;379:2040–51.
crossref pmid
7. Ling Y, Li N, Li L, Guo C, Wei J, Yuan P, et al. Different pathologic responses to neoadjuvant anti-PD-1 in primary squamous lung cancer and regional lymph nodes. NPJ Precis Oncol. 2020;4:32.
crossref pmid pmc pdf
8. Liu J, Blake SJ, Yong MC, Harjunpaa H, Ngiow SF, Takeda K, et al. Improved efficacy of neoadjuvant compared to adjuvant immunotherapy to eradicate metastatic disease. Cancer Discov. 2016;6:1382–99.
crossref pmid pdf
9. Yi JS, Ready N, Healy P, Dumbauld C, Osborne R, Berry M, et al. Immune activation in early-stage non-small cell lung cancer patients receiving neoadjuvant chemotherapy plus ipilimumab. Clin Cancer Res. 2017;23:7474–82.
crossref pmid pmc pdf
10. Hanahan D, Weinberg RA. The hallmarks of cancer. Cell. 2000;100:57–70.
crossref pmid
11. Russo A, Russano M, Franchina T, Migliorino MR, Aprile G, Mansueto G, et al. Neutrophil-to-lymphocyte ratio (NLR), platelet-to-lymphocyte ratio (PLR), and outcomes with nivolu-mab in pretreated non-small cell lung cancer (NSCLC): a large retrospective multicenter study. Adv Ther. 2020;37:1145–55.
crossref pmid pdf
12. Wang Y, Li Y, Chen P, Xu W, Wu Y, Che G. Prognostic value of the pretreatment systemic immune-inflammation index (SII) in patients with non-small cell lung cancer: a meta-analysis. Ann Transl Med. 2019;7:433.
crossref pmid pmc
13. Pisters KM, Kris MG, Gralla RJ, Zaman MB, Heelan RT, Martini N. Pathologic complete response in advanced non-small-cell lung cancer following preoperative chemotherapy: implications for the design of future non-small-cell lung cancer combined modality trials. J Clin Oncol. 1993;11:1757–62.
crossref pmid
14. Betticher DC, Hsu Schmitz SF, Totsch M, Hansen E, Joss C, von Briel C, et al. Mediastinal lymph node clearance after docetaxelcisplatin neoadjuvant chemotherapy is prognostic of survival in patients with stage IIIA pN2 non-small-cell lung cancer: a multicenter phase II trial. J Clin Oncol. 2003;21:1752–9.
crossref pmid
15. Grivennikov SI, Greten FR, Karin M. Immunity, inflammation, and cancer. Cell. 2010;140:883–99.
crossref pmid pmc
16. Li Q, Zhou S, Liu S, Liu S, Yang H, Zhao L, et al. Treatment-related lymphopenia predicts pathologic complete response and recurrence in esophageal squamous cell carcinoma undergoing neoadjuvant chemoradiotherapy. Ann Surg Oncol. 2019;26:2882–9.
crossref pmid pdf
17. Heo J, Chun M, Noh OK, Oh YT, Suh KW, Park JE, et al. Sustaining blood lymphocyte count during preoperative chemoradiotherapy as a predictive marker for pathologic complete response in locally advanced rectal cancer. Cancer Res Treat. 2016;48:232–9.
crossref pmid pmc pdf
18. Fang P, Jiang W, Davuluri R, Xu C, Krishnan S, Mohan R, et al. High lymphocyte count during neoadjuvant chemoradiotherapy is associated with improved pathologic complete response in esophageal cancer. Radiother Oncol. 2018;128:584–90.
crossref pmid
19. Cullinane C, Creavin B, O’Leary DP, O’Sullivan MJ, Kelly L, Redmond HP, et al. Can the neutrophil to lymphocyte ratio predict complete pathologic response to neoadjuvant breast cancer treatment? A systematic review and meta-analysis. Clin Breast Cancer. 2020;20:e675–81.
crossref pmid
20. Choi JE, Villarreal J, Lasala J, Gottumukkala V, Mehran RJ, Rice D, et al. Perioperative neutrophil:lymphocyte ratio and postoperative NSAID use as predictors of survival after lung cancer surgery: a retrospective study. Cancer Med. 2015;4:825–33.
crossref pmid pmc pdf
21. Dal Bello MG, Filiberti RA, Alama A, Orengo AM, Mussap M, Coco S, et al. The role of CEA, CYFRA21–1 and NSE in monitoring tumor response to Nivolumab in advanced non-small cell lung cancer (NSCLC) patients. J Transl Med. 2019;17:74.
crossref pmid pmc pdf
22. Kojima H, Terada Y, Yasuura Y, Konno H, Mizuno T, Isaka M, et al. Prognostic impact of the number of involved lymph node stations in patients with completely resected non-small cell lung cancer: a proposal for future revisions of the N classification. Gen Thorac Cardiovasc Surg. 2020;68:1298–304.
crossref pmid pdf
23. Wu Y, Chen J, Zhao L, Li Q, Zhu J, Yang H, et al. Prediction of pathologic response to neoadjuvant chemoradiotherapy in patients with esophageal squamous cell carcinoma incorporating hematological biomarkers. Cancer Res Treat. 2021;53:172–83.
crossref pmid pmc pdf
24. Powell A, Chin C, Coxon AH, Chalishazar A, Christian A, Roberts SA, et al. Neutrophil to lymphocyte ratio as a predictor of response to neoadjuvant chemotherapy and survival in oesophageal adenocarcinoma. BJS Open. 2020;4:416–23.
crossref pmid pmc pdf
25. Ferrucci PF, Ascierto PA, Pigozzo J, Del Vecchio M, Maio M, Antonini Cappellini GC, et al. Baseline neutrophils and derived neutrophil-to-lymphocyte ratio: prognostic relevance in metastatic melanoma patients receiving ipilimumab. Ann Oncol. 2016;27:732–8.
crossref pmid
26. Bagley SJ, Kothari S, Aggarwal C, Bauml JM, Alley EW, Evans TL, et al. Pretreatment neutrophil-to-lymphocyte ratio as a marker of outcomes in nivolumab-treated patients with advanced non-small-cell lung cancer. Lung Cancer. 2017;106:1–7.
crossref pmid
27. Zhang H, Xia H, Zhang L, Zhang B, Yue D, Wang C. Clinical significance of preoperative neutrophil-lymphocyte vs platelet-lymphocyte ratio in primary operable patients with non-small cell lung cancer. Am J Surg. 2015;210:526–35.
crossref pmid
28. Li A, He K, Guo D, Liu C, Wang D, Mu X, et al. Pretreatment blood biomarkers predict pathologic responses to neo-CRT in patients with locally advanced rectal cancer. Future Oncol. 2019;15:3233–42.
crossref pmid
Editorial Office
Korean Cancer Association
Room 1824, Gwanghwamun Officia
92 Saemunan-ro, Jongno-gu, Seoul 03186, Korea
TEL: +82-2-3276-2410   FAX: +82-2-792-1410   E-mail: journal@cancer.or.kr
About |  Browse Articles |  Current Issue |  For Authors and Reviewers
Copyright © Korean Cancer Association.                 Developed in M2PI