Introduction
Considerable progress in bioimaging technology, particularly at the single-cell level, has provided powerful methods for gaining insight into spatial cancer biology. These techniques have proven instrumental in determining the complexities of the tumor microenviroment (TME). The TME denotes the intricate ecosystem within a tumor, comprising a diverse array of cell types, including cancer, stromal, immune, and endothelial cells [1,2]. The heterogeneous composition and position of different cells and their interactions within a spatial context influence tumor initiation, subclone selection, and treatment response [3,4]. Therefore, understanding the complex nature of the TME at the single-cell level is imperative in cancer research. Techniques such as single-cell RNA sequencing (scRNA-seq) and flow cytometry provide valuable insights into the tumor ecosystem, allowing the inference of different cellular compositions and their interactions [5-7], but they fail to provide information on the spatial extent of cellular interactions [2,8,9]. Recent spatial mapping technology has enabled the quantification of spatially resolved multi-omic information pertaining to the genome, transcriptome, and proteome at the single-cell and subcellular levels [10], which contain substantial information for personalized treatment.
Spatial techniques fall into the following three categories: (1) capture-based approaches, which encode positional information onto transcripts prior to sequencing; (2) imaging-based approaches, which preserve the spatial context through iterative hybridization or on-tissue sequencing [11]; and (3) antibody-based approaches, including cyclic multiplexing, mass spectrometry (MS)–based methods, and DNA barcoding-based multiplexing [12,13]. Cutting-edge technologies have been extensively reviewed in various publications [10-32]. In this review, we focus on commercially available modalities, as their availability impacts their utilization. We provide an overview of spatial technologies based on these categories and explore their applications in cancer research. Furthermore, we discuss the experimental considerations across each method to guide prospective users in making informed decisions when conducting research or clinical work using these spatial techniques.
Spatial Transcriptomics Technologies
1. Capture-based approach
1) Visium (10× Genomics)
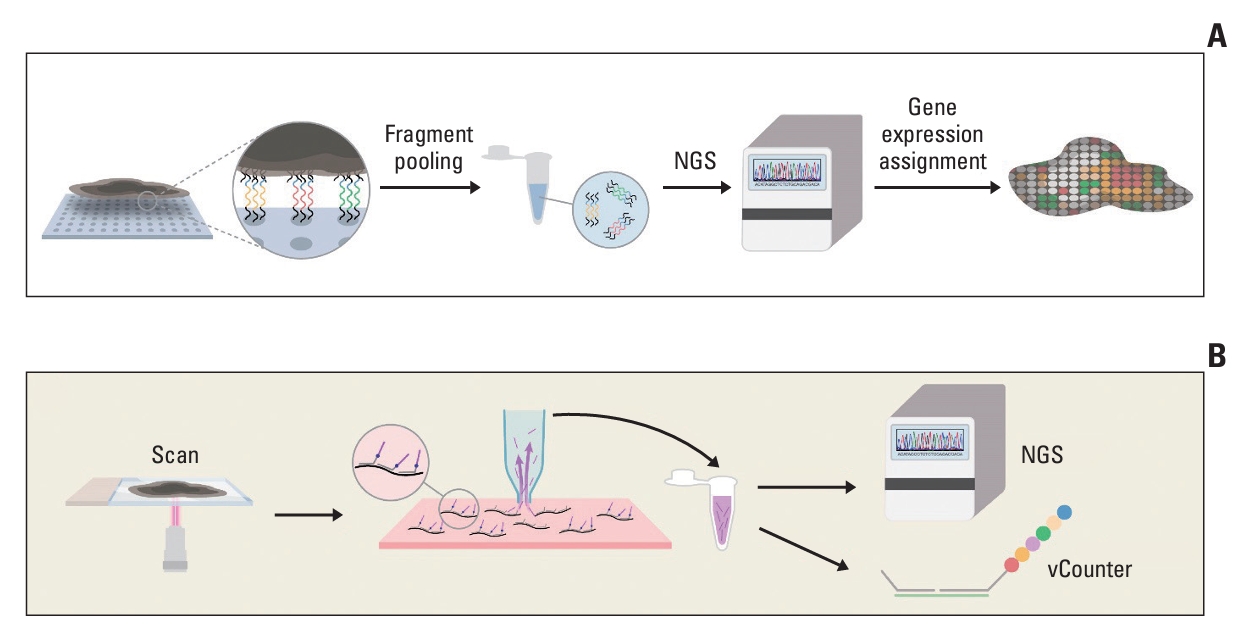
The 10× Genomics Visium (Pleasanton, CA) technology, derived from an initial array-based technique known as spatial transcriptomics [33], has provided a sequencing-based approach for spatially resolved transcriptomics since its commercial availability in 2019. The technology utilizes an array of 55-μm-diameter spots, spaced 100 μm apart, where spatially barcoded reverse transcription primers are arranged (Fig. 1A). These primers contain positional information, allowing the entire transcriptome to be mapped to the tissue [33]. Thin tissue sections are mounted onto glass slides printed with an array of primers. Thereafter, permeabilization is performed, causing the mRNA molecules within the tissue to migrate vertically and locally hybridize with the primers. After tissue removal, cDNA-mRNA complexes are isolated for library preparation and next-generation sequencing (NGS) analysis. The resulting coding transcriptome data with tagged location information are generated using short-read sequencing (Illumina). Each individual read in these data points can be aligned onto a tissue image based on the spatial information.
This technology, as demonstrated by the experimental methodology, offers comprehensive and unbiased profiling of the entire transcriptome, enabling analyses of spatially resolved gene expression. In addition, it provides a relatively large field of view, covering an area of up to 11×11 mm, and does not require specialized proprietary equipment. Recent studies have shown that this method is compatible with formalin-fixed paraffin-embedded (FFPE) tissue [34]. However, this array-based technology has limitations such as the inability to sequence non-arrayed regions in the matrix. Furthermore, the resolution is limited by the 55-μm-diameter spots because of the matrix design, failing single-cell resolution. To address this limitation, 10× Genomics plans to release an improved product, called Visium HD in 2024, offering a resolution up to 4 μm (The average size of normal human cells typically fall within the range of 5-10 μm, whereas tumor cells range from 15-25 μm [35]).
At the forefront of spatial technologies, Visium has driven the popularization of spatial transcriptomic profiling techniques [31]. It has been extensively employed to identify prognostic biomarkers, evaluate treatment responses, and unravel the intricate architecture of the TME [31]. Using bulk RNA sequencing (bulk RNA-seq), Nagasawa et al. [36] found that GATA3-mutated tumors exhibited a higher risk of relapse in breast ductal carcinoma in situ, characterized by enhanced epithelial-to-mesenchymal transition and angiogenesis. They further investigated the heterogeneity of GATA3-mutated tumor cells using Visium technology [36]. By leveraging the multimodal integration of various high-resolution single-cell profiles with scRNA-seq, CosMx Spatial Molecular Imager (SMI), and Visium, Chu et al. [37] conducted an unprecedented pan-cancer study and provided a high-resolution T-cell reference map, which would serve as a valuable resource for biomarker discovery. With the incorporation of multimodal technologies and the availability of open-source tools for data analysis and visualization, Visium has found extensive applications in cancer research despite its inherent limitation of low resolution [31].
2) GeoMx Digital Spatial Profiling (DSP, NanoString)
The NanoString GeoMx DSP (Seattle, WA) was commercially introduced in 2019, offering multiplex profiling of RNAs, DNAs, and proteins using a preselected panel of oligonucleotide-conjugated antibodies [38]. Through probe hybridization, fluorescently tagged antibody-stained tissues provide morphological guidance for selecting user-defined regions of interest (ROI) within the tissue. UV light exposure was used to remove barcodes containing UV-cleavable linkers from the antibodies within the ROI of the tissue sections (Fig. 1B). The detached oligonucleotides are collected using microcapillaries and quantified using a NanoString nCounter or NGS. ROIs can be selected based on tissue morphology or arranged arbitrarily in a grid with a fine resolution up to 10 μm. They can also be tiled to cover an entire tissue specimen.
The DSP method offers significant advantages in cancer research by employing morphology-driven ROI selection under conventional histological guidance on parallel slides. This method is highly sensitive and requires only 60-100 cells to generate reliable data [39]. The use of NanoString’s curated panels of probes enables the detection of small RNA fragments and provides high-confidence analysis of tissue sections from FFPE specimens [40], facilitating the retrospective use of archived tissue. The technology does not require specialized slides or procedures, and it covers a large area of 14.6×36.2 mm.
However, the GeoMx DSP method has some limitations. Subjective user-guided ROI selection may result in missed opportunities to identify novel RNA species, although a targeted approach could enhance the detection sensitivity and quantification robustness. Additionally, gene expression was not precisely superimposed onto specific ROIs. Increasing the size of ROIs or utilizing complex ROI shapes can lead to reduced functional spatial resolution. To overcome these limitations and achieve greater resolution and precision, NanoString has developed a molecular imaging platform capable of spatially detecting up to 18,000 transcripts within individual cells.
GeoMx DSP has contributed to various clinical and translational studies, particularly in the field of immuno-oncology [41-46]. Vadakekolathu et al. [41] utilized this spatial profiling approach to characterize the TME of acute myeloid leukemia into immune subtypes and predict the response to immunotherapy. Another study used DSP to quantify the spatial expression of LAG3 in diffuse large B-cell lymphoma within a spatial immune context, revealing it as a potential predictive biomarker for immunotherapy [42]. Danaher et al. [45] used DSP-multiplexed proteomics for immune profiling and identified seven novel TME subtypes in non-small cell lung cancer. They further identified four categories of genes within spatial subtypes using scRNA-seq and spatial mapping technology [45]. In pancreatic cancer study with two cohorts of treated and untreated patients, Hwang et al. [44] identified three clusters with distinctive distributions of malignant, stromal, and immune features using snRNA-seq and DSP. Moreover, leveraging spatial mapping technology, they presented compelling evidence to support a sequential progression from normal cells to precursors and malignant cells within the pancreatic TME, which contributes to the understanding of the transformational processes of pancreatic carcinogenesis [44]. In basal cell carcinoma of skin, Pich-Bavastro et al. [46] used scRNA-seq and DSP to identify subsets of cancer-associated fibroblast and macrophage, and further demonstrated their actin A-mediated transcriptional reprogramming and involvement in the exclusion of CD8 T cells within peritumoral immunosuppresive niche. Using spatial mapping technology, they demonstrated the dynamic interplay between stromal components and immune cells, highlighting the potential mechanism of resistance to immune checkpoint inhibitors within the inflammatory TME [46]. These studies provide valuable insights that can be obtained through the spatial profiling capabilities of the GeoMx DSP technology.
2. Image-based approaches
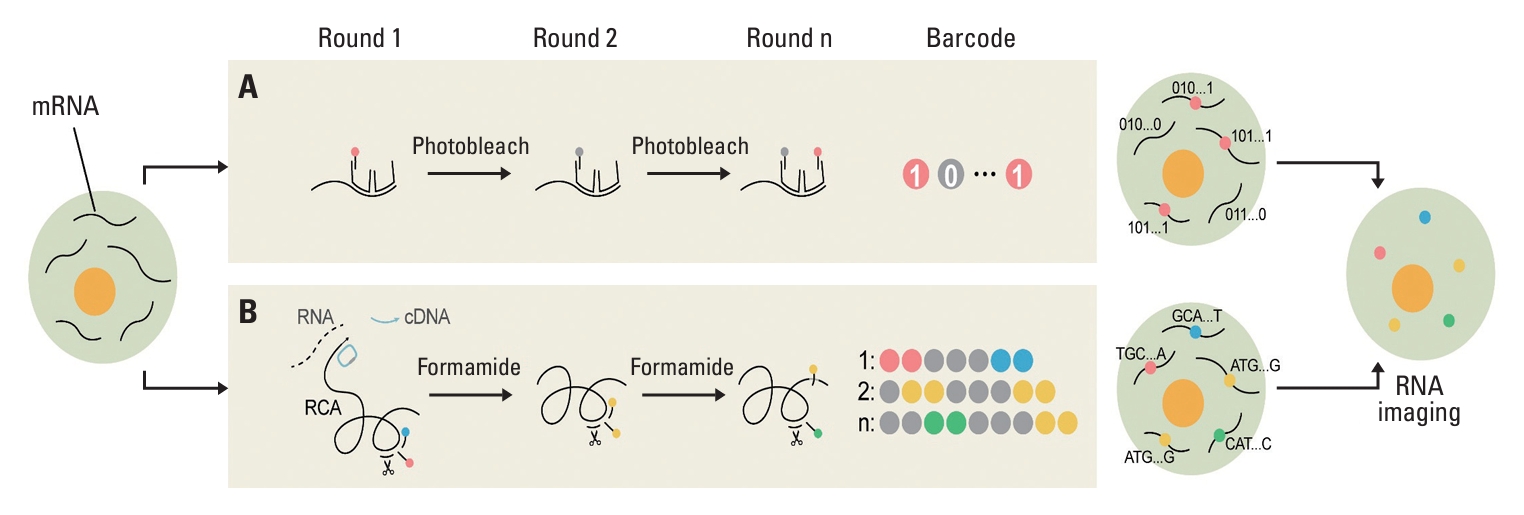
Image-based single-cell spatial transcriptomics can be categorized into two types. The first category is in situ hybridization (ISH)–based methods, which utilize signals obtained from multiple rounds of probe hybridization, imaging, and stripping to identify genes (Fig. 2A) [11]. Notable examples of ISH-based spatial techniques include seqFISH [47,48], multiplexed error-robust fluorescence in situ hybridization (MERFISH) [49], and CosMx SMI [50]. These methods employ a color barcoding scheme, derived from single-molecule flu-orescence in situ hybridization (smFISH), allowing for the visualization of individual transcripts. This enables quantitative measurements of RNA or protein expression as well as the spatial localization at subcellular resolution.
The second category includes in situ sequencing (ISS)– based methods in which spatial profiling is achieved through sequencing reactions performed in situ [11]. This approach, exemplified by techniques such as fluorescent in situ sequencing (FISSEQ), Cartana, and STARMAP, involves amplifying target sequences using a padlock probe—a nanoball of DNA molecules—resulting in an enhanced signal for reliable sequencing (Fig. 2B) [51-53]. One notable example of commercialized ISS-based technology, Xenium, was recently launched by 10× Genomics.
1) Multiplexed error-robust FISH (MERFISH, Vizgen)
MERFISH, commercialized by Vizgen (Cambridge, MA), enables imaging of hundreds to thousands of individual RNA species through iterative rounds of probe hybridization [49]. This fluorescence-based method employs a predefined barcode scheme, where each gene is encoded by a binary code and identified using a combination of signals from repetitive hybridization rounds, referred to as “on-off imaging signals.” Each gene is assigned a “1” or “0” value for each bit corresponding to its detection in a specific hybridization round (Fig. 2A). Theoretically, this approach can discriminate between 2N genes in N rounds of hybridization (or CN genes if C colors are employed for imaging). By leveraging error-correction codes and expansion microscopy, MERFISH has achieved feasible sensitivity, facilitating high-throughput RNA spatial profiling at a subcellular resolution with improved detection efficiency and decreased misidentification rates [54,55].
Compared to contemporary ISH-based approaches, MERFISH offers a significantly reduced experimental time for mRNA molecule detection, with several rounds of hybridization taking only 15 minutes. However, a drawback of this method is its low multiplexing capability, which is currently limited to less than 1,000 RNA species despite proof-of-concept experiments demonstrating high-throughput profiling of up to 10,000 RNA [49]. Additionally, the detection efficiency of MERFISH decreases in FFPE samples because of the highly fragmented nature of RNA molecules, particularly small RNA molecules, which restricts the number of probe hybridizations and diminishes signal emissions [56].
Although MERFISH has not yet been demonstrated in intact tumor samples, it has been successfully used for immunolabeling of an endoplasmic reticulum receptor and nuclear staining to identify RNA species enriched in specific cellular compartments within a human osteosarcoma cell line (U2OS) [55].
2) CosMx SMI (NanoString)
CosMx SMI is a recently launched ISH-based method for single-cell spatial profiling, which was commercialized by NanoString in 2022 [50]. This technology provides spatial high-plex profiling of RNA and protein expression at subcellular resolution through iterative hybridization and a unique encoding scheme [50]. Unlike the MERFISH, the SMI method utilizes four-color reporters over 16 readout rounds while employing the “on-off imaging signals” barcoding scheme.
One notable advantage of the CosMx SMI method is its high detection sensitivity, particularly for FFPE samples, because of its unique sequence in the target-binding domain. The SMI reporter chemistry enables the detection of background noise signals and facilitates rapid signal quenching, leading to more accurate calling. However, this method requires a specialized proprietary instrument, which may restrict accessibility for researchers despite its high level of automation.
As the CosMX SMI technology has only recently been launched, there are currently limited publications that utilize it. He et al. [50] employed the SMI method to reveal the multiplex multiomic profiles of 980 RNAs and 108 proteins in FFPE lung cancer samples.
3) Xenium (10× Genomics)
Released in 2022, Xenium is an ISS-based method powered by padlock probes and rolling circle amplification (RCA) to generate cDNA libraries (Fig. 2B) [57]. Target genes were amplified via RCA using padlock probes specific to the target sequence, resulting in reliable sequencing. Within the tissue fragment where this DNA probe binds, cDNA libraries are generated and later sequenced using NGS techniques.
Similar to other image-based methods, this recently introduced ISS-based technique enables the quantification of medium gene plexes (up to 313 and theoretically 5,000) at subcellular resolution and covers a large imageable area (12×24 mm) that is compatible with FFPE tissue sections [57]. With an error-correction scheme and no gap-filling technology, this technology achieves high sensitivity and accuracy. Despite the convenience of a relatively automated process and a 10× complementary platform, it requires specialized and expensive instruments. As a relatively new technology, there is a scarcity of peer-reviewed articles that use this ISS-based technique.
3. Antibody-based approaches
Antibody labeling approaches have a long history of application, leveraging the inherent affinity of antibodies towards targeted proteins to gain insights into the proteomic landscape. These approaches can be categorized based on the antibody tagging method, including enzyme-tagged cyclic multiplexing, heavy metal-tagged MS–based multiplexing, and DNA oligonucleotide-conjugated barcoding-based method.
1) Enzyme-tagged cyclic multiplexing
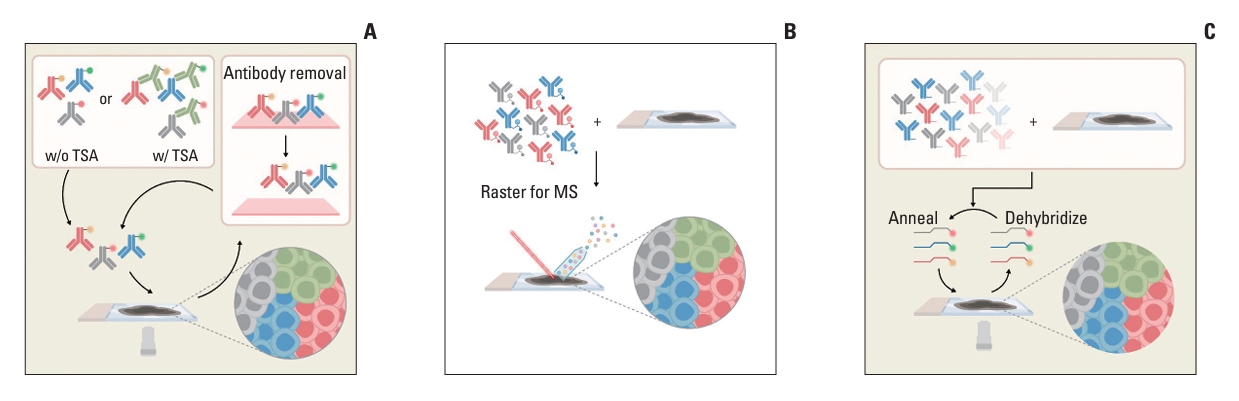
Cyclic multiplexing is a sequential multistep approach involving iterative cycles of primary antibody labeling, imaging, and antibody stripping on a single slide using immunoperoxidase [58,59] or immunofluorescence [60] (Fig. 3A). This technique can be implemented in clinicopathological laboratories using available instruments, such as multiplexed immunohistochemistry consecutive training on a single slide (MICSS) [58,59] and tissue-based Cyclic Immunofluorescence (t-CyCIF) [60], although these are noncommercial approaches. The commercially available MultiOmyx (GE Healthcare, Niskayuna, NY) employs cyclic fluorophore-labeled staining and imaging, allowing for the examination of more than 50 targets.
The major advantages of iterative immunolabeling are its simplicity and cost-effectiveness, especially in noncommercial approaches. Moreover, the whole slide can be inspected for each marker, distinguishing it from ROI-based multiplex approaches such as MS-based [61,62] and DNA barcoding-based methods [63-65]. However, these advantages should be weighed against potential drawbacks, including extended experimental time due to lengthy antibody incubation, possibility of epitope loss, tissue deformation from repeated exposure to antibody stripping, inconsistent destaining across repetitive cycles, and complexities of antibody panel validation. Additionally, determining the optimal staining order to prioritize sensitive antigens remains challenging. Imaging processing steps such as merging each image and analyzing multiplexed images present additional challenges for this approach.
Cyclic multiplexing methods have been employed in various studies focusing on immune profiling in various solid tumors such as gastric cancer [66,67], pancreatic cancer [68], breast cancer [69], and head and neck cancer [70]. These studies provide valuable insights into the immune landscape of these tumor types. Furthermore, cyclic multiplexing has contributed to our understanding of cancer biology. Gerdes et al. revealed the mutual exclusivity of 4E-BP1 and RP6 phosphorylation, implicating mTORC1 signaling in colorectal cancer [71]. Li et al. [72] identified the coexpression of CK, CDH3, VIM, and Cyt-PLAC8 at the edges of colon tumors, suggesting a potential role for PLAC8 in tumor invasion. MultiOmyx has been used to demonstrate inter- and intratumoral heterogeneity in ductal carcinoma in situ in the breast [73].
2) Enzyme-tagged cyclic multiplexing with tyramide signal amplification
The tyramide signal amplification (TSA)–based method employs a signal amplification technique that is beneficial for detecting low-abundance epitopes [74]. This technology, which utilizes opal dyes, enhances protein signals by conjugating multiple dye molecules to the tyrosine residues of the target protein (Fig. 3A). Commercialized by Roche Tissue Diagnostics (Discovery Ultra) and Akoya Biosciences (OPAL), these TSA-based cyclic multiplexing technologies allow a fully automated process that enables medium-throughput protein detection (6-8) on the same whole-slide image.
However, it is important to note that these approaches have limitations inherent to cyclic multiplexing methods, such as the potential risk of “umbrella effect” or “fluorophore bleedthrough” due to excessive deposition of tyramide. Before routine implementation, thorough validation of the antibody panel is crucial. These include considerations such as staining order, marker co-localization, antibody elution, spectral overlap, antibody cross-reactivity, and potential signal reduction due to steric hindrance [12,24,26]. These measures ensure the reliability and accuracy of these technologies in identifying cellular phenotypes within specific tissue compartments such as the TME [75-77].
3) MS-based multiplexing
MS-based multiplexing offers a unique approach for visualizing spatial proteomics using elemental mass tags attached to antibodies in ROI tissue. This method enables the simultaneous detection of multiple target proteins using a cocktail of metal isotope-tagged antibodies, eliminating the need for iterative staining and stripping processes (Fig. 3B) [78,79]. Two commercially available products that have popularized MS-based spatial proteomics are multiplex ion beam imaging (MIBI) [61] with MIBIScope (IonPath, Inc, Menlo Park, CA) and imaging mass cytometry (IMC) [62] with Hyperion (Fluidigm, Inc., South San Francisco, CA), which utilize an ion beam and laser ionization for tag detection, respectively.
One of the main advantages of MS-based platform is its ability to perform detection and imaging simultaneously, often referred as “one-shot technology,” unlike immunolabeling multiplexing. This approach offers flexibility in antibody selection and allows for relatively high levels of multiplexing (> 40 protein detections) within an ROI. The high instrumental mass-resolving power of MS enables the detection of low background signals without target molecule amplification. However, this approach also faces challenges, including high instrument costs, maintenance difficulties, limitations in expanding antibody panels due to a lack of available mass tags [80], and difficulties in detecting low-abundance epitopes (such as programmed death-ligand 1 [PD-L1]) that typically require amplification [81].
Studies using MS-based spatial proteomics have provided valuable insights into cellular interactions and their contributions to disease progression. For instance, by employing a 35-marker panel, IMC has linked the spatial arrangement of cytotoxic and helper T cells to distinct clinical stages of disease severity [82,83]. Similarly, MIBI has shed light on the coordinated antitumor immune response in triple-negative breast cancer (TNBC), indicating the early infiltration of natural killer (NK) cells, followed by B cells and CD4+ and CD8+ T cells [84,85]. Furthermore, a correlation has been demonstrated between the presence of IDO1+ PD-L1+ monocytes, augmented expression of HLA-DR and H3K9ac in peripheral tumor cells, and specific immune infiltration patterns associated with improved clinical outcomes in TNBC [84,85].
4) DNA barcoding–based multiplexing: Co-Dection by indEXing (CODEX, Akoya Biosciences)
DNA barcoding–based approach is a spatial proteomics technology that utilizes a cocktail of primary antibodies, each tagged with a unique DNA oligonucleotide. A representative commercialized platform, CODEX (Akoya Biosciences, Menlo Park, CA) is available for this purpose [63,64]. CODEX employs a cyclic fluorescence staining method in which oligo-tagged primary antibodies are used to visualize the targets of interest (Fig. 3C). A combination of primary antibody reporter probes specific to a subset (two or three) of barcodes are introduced using a microfluidic system. This cycle is repeated for the remaining barcodes until all antibody targets are visualized. The CODEX method enables the visualization of > 40 markers with single-cell resolution and is compatible with standard three-color fluorescence microscopes, making it suitable for high-level multiplexing in most clinical and research laboratories.
Despite the clear utility of this technology for addressing fundamental and translational research inquiries, its implementation has been constrained, potentially because of the requirement of specialized slides for tissue mounting and a limited imaging area. However, compared to other spatial proteomics techniques that offer multiplexing capabilities similar to those of MS-based approaches, CODEX has distinct advantages, particularly in terms of compatibility with conventional microscopy and laboratory equipment.
Currently, few peer-reviewed publications are available on this relatively new platform. A recent study demonstrated its feasibility by investigating the dynamic interplay among immune cell subsets in the spleen of a mouse lupus model [63]. Furthermore, the application of CODEX has been extended to FFPE samples, enabling the identification of specific cellular distributions within the TME of colorectal cancer, that have been associated with clinical outcomes [64].
Experimental Considerations for Cancer Research
Thus far, various spatial technologies have been reviewed, each using a distinct strategy for obtaining multi-omics and spatial information. Different technological features across each method should be assessed, including the area of spatial profiling, number of plexes, spatial resolution, and tissue modality (Table 1). With these characteristics in mind, the principal goals of the study should be included as initial experimental considerations, such as discovery- and target-based approaches, which are referred to as hypothesis generation and testing [86]. With different technological features across each method and the aims of the study, spatial technologies are determined using these tradeoffs. Additional considerations for their spatial experiments include available budget, and analytical support.
Furthermore, it is beneficial to acknowledge their limitations compared to conventional technologies, such as scRNA-seq or bulk RNA-seq. When compared to scRNA-seq, the capture-based approaches such as 10× Visium and Nanostring GeoMX, fail to achieve single-cell resolution. Until now, integrating scRNA-seq emerges as a viable option to address the resolution issue [36]. In addition, in contrast to bulk RNA-seq which has the relatively well-established analysis pipelines, the analysis processing of spatial mapping technologies is still in its early stages with the extensive and large datasets, making its analysis more challenging. Its analysis technical immaturity poses difficulties that researchers must address in their study.
The capability of high-throughput profiling in capture-based approaches is advantageous for discovery-based approaches. However, the present constraints of these technologies, which frequently involve an inability to attain single-cell resolution, impose significant limitations on the applicability of hypothesis-generating methodologies. Based on the author’s experience and a review of previously published studies, Visium has notable efficacy in spatially verifying specific gene expression through the integration of multi-omics findings [36]. Nevertheless, interpreting results becomes challenging within the 55-μm range, where various cells coexist, yielding mixed outcomes from both malignant and non-malignant cells. GeoMx has a minor resolution advantage over Visium, providing a comprehensive overview of the whole transcriptome, particularly in situations where tissue examination is constrained by the availability of minute biopsy samples [87]. This is because of the high sensitivity of the technology, which permits the generation of robust data from 60 to 100 cells [39]. Through this technical ability, this spatial technology demonstrates an advantage in extracting the transcriptome information, especially in diminutive specimens, such as biopsy. Consequently, GeoMx can be effectively utilized in scenarios involving small biopsies, a utility that may not have been initially designed.
Antibody-based approaches offer the advantage of analyzing specific markers of interest despite their limited number, with a notable benefit in research scenarios characterized by well-defined objectives, such as hypothesis testing. These approaches are particularly advantageous in situations where a multifaceted understanding of cellular phenotypes is essential, such as subtypes of inflammatory and cancer cells requiring the application of multiple markers (e.g., NK, myeloid-derived suppressor, exhausted T, and epithelial-mesenchymal cancer cells [84,85]).
Image-based technologies display a technical profile with intermediate features between image-based approach and antibody-based technology, in terms of number of plexes and their resolution [50,57]. The recent commercialization of these technologies has lowered barriers to their application by clinicians, as well as by oncology researchers. Notably, due to its convenience and availability with customized panels in several cancer types [50,57], these technologies hold increased potentials as future biomarkers for diagnosis and prognostic prediction in clinical practice. Thus, vigorous studies employing this image-based approaches are anticipated to make substantial contribution to translational research.
Capture-based spatial techniques provide high-throughput profiling capabilities, but fail to achieve single-cell resolution. In contrast, image-based methods permit spatial imaging profiling at the subcellular level but have limitations in terms of throughput. Owing to each distinctive attribute, the capture-based approach appears suitable for hypothesis generation, whereas image-based or antibody-based approaches are more appropriate for hypothesis testing. However, given the peculiarities and constraints inherent in individual experiments, alternative approaches may yield valuable biological insights.
Future Perspective
Potential advancements in our understanding of cancer biology, both fundamental and translational, are abundant within the future trajectory of omics technology in the field of spatial profiling. This concept has the potential to facilitate integration of research findings into clinical practice in the field of precision oncology. Nevertheless, to effectively capitalize on these advantages, many challenges must be considered.
First, the integration of spatial transcriptomic data with proteomics or other types of data using multi-omics methodologies is a viable avenue for gaining valuable insights. Integrating diverse data, such as spatial genomic profiling and mRNA transcriptome analysis, has the potential to enhance our understanding of the intricate relationships between genetics and phenotypes. Moreover, this approach can help elucidate the distinct contributions of genetic determinants and TME in cancer research [88]. This poses a challenge owing to the variations in tissue processing conditions among different modalities. Nonetheless, there have been published protocols for multi-omics approaches in multiplexed imaging [89-91], and we anticipate further advancements in integrative protocols in the future.
Second, computer vision and artificial intelligence are rapidly evolving fields with immense potential to revolutionize the biomedical field through convergent research. Notably, recent years have witnessed significant advancements in the analysis of biological and medical images using deep learning algorithms [92-94], highlighting their potential to improve the analysis of complex spatial data. By employing these algorithms for spatial profiling, opportunities rise to address the limitations inherent in these technologies and automatically extract spatial and morphological features that are relevant to treatment response and prognosis [95-97]. As spatial profiling datasets continue to accumulate, deep learning is expected to help decode complex spatial information [98].
Finally, spatial profiling with temporal resolution is another exciting avenue, pseudotime analysis, which has been extensively utilized with scRNA-seq data to understand cell differentiation and cancer progression [10]. However, traditional approaches to scRNA-seq that build cell-state trajectories ignore the spatial structure of tissues. Recently, a novel approach to spatiotemporal profiling was proposed to capture both gene expression-based progression and spatial relationships within tissues [99]. This opens up a promising area for future research, offering opportunities to construct more advanced combined spatial pseudotime models and explore the potential implications for tissue and biological structure development.
Conclusion
Spatial mapping technologies have not yet undergone extensive development in terms of analytical approaches; therefore, their application in a variety of fields appears prospective, predicated on researchers’ understanding of the characteristics of these methods. Future applications will likely depend on the objectives of researchers and how they choose to employ these methods after gaining a solid comprehension.