Introduction
Extranodal natural killer (NK)/T-cell lymphoma (ENKTL) is a subtype of Epstein-Barr virus (EBV)-positive NK/T-cell lymphoma. This disease entity was previously referred to as ENKTL, nasal-type. However, the most recent World Health Organization classification removed the qualifier “nasal-type,” recognizing that this disease can manifest in extranodal sites beyond the nasal area [1]. Approximately 80% of ENKTL cases manifest in the upper aerodigestive tract, including the nasal cavity, nasopharynx, oropharynx, and Waldeyer’s ring. Additional primary sites comprise the skin, testis, gastrointestinal tracts, muscle, and salivary glands [2]. Geographic disparities exist in the prevalence of ENKTL. The International Non-Hodgkin Lymphoma Classification Project reports that ENKTL accounts for 3.0% and 5.2% of diagnosed non-Hodgkin lymphoma cases in Central/South America and East Asia, respectively, but only 0.3% in North America and Western Europe [3].
The treatment strategy for ENKTL varies between the early stage (stage I-II) and advanced stage (stage III-IV) of the disease [4]. The treatment of early-stage ENKTL involves a combination of radiation therapy and chemotherapy. The inclusion of radiation therapy is crucial for early-stage ENKTL as it has been associated with improved locoregional control and survival [5,6]. In contrast, advanced-stage disease is primarily managed with chemotherapy. Consequently, an accurate evaluation of the disease extent for staging holds paramount importance in treatment decisions. As bone marrow (BM) is often involved by lymphoma, evaluating BM involvement plays a pivotal role in lymphoma staging. Additionally, positron emission tomography/computed tomography (PET/CT) stands out as an effective method to assess the extent of the disease for ENKTL [7,8]. Currently, routine PET/CT scans are recommended for newly diagnosed ENKTL patients [9,10]. While BM biopsy remains the standard method for diagnosing BM involvement, its clinical significance is challenged by PET/CT in other types of lymphomas, such as diffuse large B-cell lymphoma and Hodgkin lymphoma [11,12]. However, in the context of ENKTL, the diagnostic efficacy of PET/CT for BM involvement hasn’t been definitively established. Multiple retrospective series have evaluated the accuracy of PET/CT in detecting BM involvement when compared to BM biopsy. The results in these studies have exhibited certain discrepancies [13-17]. This study aims to investigate the diagnostic significance of PET/CT in assessing BM involvement through a comparison of PET/CT findings with BM biopsy results in ENKTL. This research is undertaken through multi-institutional collaboration, initiated by the Korean Radiation Oncology Group (KROG).
Materials and Methods
1. Patient population and diagnostic procedures
The medical records of patients diagnosed with ENKTL in five institutions from 2008 to 2017 were retrospectively reviewed. All enrolled patients underwent staging using PET/CT and BM biopsy. Patients with relapsed disease or other types of EBV+ NK/T-cell lymphoma, such as nodal NK/T-cell lymphoma or NK-cell leukemia, were excluded from the study. Diagnosis was based on the World Health Organization classification of hematolymphoid tumors [1]. The diagnostic procedure involved a comprehensive assessment, including medical history, endoscopic examination of the upper aerodigestive tract, CT and/or magnetic resonance imaging scans of involved sites, PET/CT scans, and BM biopsy. Treatment plans were determined at the discretion of the treating clinicians at each institution. Generally, patients with early-stage disease received treatment regimens incorporating radiation therapy or concurrent chemoradiation therapy, with or without induction/adjuvant chemotherapy. However, some patients who were deemed unsuitable for high-dose radiation therapy underwent chemotherapy alone. Patients with advanced-stage disease were primarily treated with chemotherapy, and radiation therapy was selectively administered to certain patients. There was no consensus for a limited number of EBV+ cells in BM to consider as BM involvement or not, but in most cases, patients classified as early stage by PET/CT with a limited number of EBV+ cells in BM received definitive radiation or concurrent chemoradiation.
BM biopsy was conducted on the unilateral or bilateral iliac crest, involving both marrow aspirate and trephine biopsy. During the time of diagnosis, hematopathologists at each institution identified BM involvement of the lymphoma based on morphology and immunohistochemistry. The BM biopsy reports were meticulously reviewed for the purpose of this analysis. Gross BM involvement was defined as morphologically evident lymphoma involvement in the BM, or the presence of EBV+ cells in the BM that were also verified to be of NK cell origin (for instance, CD56+). Minimal BM involvement was defined as the presence of a limited number of EBV+ cells within the BM, as detected by Epstein-Barr encoding region in situ hybridization (EBER-ISH). In these cases, the cell count was insufficient for carrying out additional immunohistochemistry to confirm the disease, and there was no distinct morphological evidence of BM involvement. As not all included patients underwent EBER-ISH, the actual BM involvement status of the patients was categorized into four groups: gross BM involvement, minimal BM involvement, grossly negative without available EBER-ISH, and no involvement.
18F-fluorodeoxyglucose (FDG) PET/CT was performed for all patients included in the study. The PET/CT scans, along with their corresponding reports drafted by nuclear radiologists at each institution during the time of diagnosis, were subject to review for the purpose of this investigation. Any focal and/or diffuse FDG uptake surpassing the normal liver uptake in the bone or BM, without any other suspected source of such uptake, was categorized as a positive finding.
2. Endpoints and statistical analysis
Initially, patients were staged according to the PET/CT results, utilizing the Lugano classification [18], with no consideration of the BM biopsy. Patients in stages I-II were categorized as having early-stage disease (PET-ES group), while those in stages III-IV were considered to have advanced-stage disease (PET-AS group). The characteristics of the patients and their BM involvement status were then compared between the PET-ES and PET-AS groups. For all patients, the sensitivity and specificity of PET/CT in detecting cases with gross BM involvement were calculated. Additionally, sensitivity and specificity for identifying any form of BM involvement (including both gross and minimal involvement) were calculated, with the exclusion of patients exhibiting grossly negative BM status without available EBER-ISH.
To assess the clinical implications of minimal BM involvement, patients were once again classified into three distinct groups: PET-AS group, PET-ES group with no BM involvement, and PET-ES group with minimal BM involvement. Patients in the PET-ES group with no available EBER-ISH results for BM biopsy or with gross BM involvement detected by BM biopsy were not included in this categorization. The comparison of progression-free survival (PFS) and overall survival (OS) was carried out among the three groups. The events for PFS were defined as any occurrence of disease progression or patient mortality. The events for OS were defined the death of a patient due to any cause. The calculation of PFS and OS was executed using the Kaplan-Meier method. The survival data of patients were retrieved from the resident registration system maintained by the Korean government whenever available. Statistical analysis was performed by testing the differences in PFS and OS among the three groups using the log-rank test. Subsequently, a post-hoc analysis was conducted, adjusting the p-values using the Benjamini-Hochberg procedure [19].
Categorical variables were compared using chi-square test, and continuous variables were compared using the Student’s t test. A p-value less than 0.05 was defined as statistically significant. All statistical analyses were conducted using the R software ver. 4.2.1 (The R Foundation for Statistical Computing, Vienna, Austria).
Results
1. BM biopsy status and accuracy of PET/CT
A total of 193 patients were eligible. Based on PET/CT scans, 135 patients (69.9%) were classified as having an early stage (PET-ES group), and 58 patients (30.1%) were classified as having an advanced stage (PET-AS group). Patient characteristics have been summarized in Table 1. In the PET-ES group, gross BM involvement was infrequent, with only one patient (0.7%) displaying involvement. In the BM biopsy specimen of this patient, 3.3% of cells in the specimen were confirmed to be both EBV+ and CD56+, leading to the categorization of this case as gross BM involvement. Among the remaining 134 patients, 97 (72.4%) had EBER-ISH performed on their BM biopsy specimens, and within this subset, 18 patients (18.6%) were found to have minimal BM involvement. No statistically significant differences in characteristics were observed between patients with minimal BM involvement and those with no evidence of BM involvement, except for the BM biopsy method (Table 2). More patients with no BM involvement had BM biopsy performed on the bilateral iliac crest compared to those with minimal BM involvement (87.3% vs. 50.0%). Among 58 patients in the PET-AS group, 16 patients (27.6%) exhibited gross BM involvement. Among the remaining 42 patients, EBER-ISH was performed on BM biopsy specimens for 30 patients (71.4%). Among these, 11 patients (36.7%) were identified to have minimal BM involvement.
The BM biopsy status per BM involvement detected by PET/CT has been summarized in Table 3. Regarding the detection of gross BM involvement, PET/CT exhibited a sensitivity of 64.7% (11 out of 17) and a specificity of 96.0% (169 out of 176). In terms of detecting any form of BM involvement (including both gross and minimal, while excluding those grossly negative without available EBER-ISH), the sensitivity was 30.4% (14 out of 46), and the specificity was 99.0% (97 out of 98). In the PET-AS group, the sensitivity and specificity for detecting gross BM involvement were 68.8% (11 out of 16) and 83.3% (35 out of 42), respectively, and for any BM involvement, the sensitivity and specificity were 51.9% (14 out of 27) and 94.7% (18 out of 19), respectively.
Four patients in the PET-AS group with suspected bone/BM involvement in the PET/CT had either no available EBER-ISH results for BM specimen (n=3) or a negative BM biopsy result (n=1). Among these patients, two exhibited extranodal organ involvement both above and below the diaphragm, and the bone/BM involvement detected in the PET/CT did not affect the allocation to advanced-stage disease. The other two had involvement of the upper aerodigestive tract, neck node, and focal bone involvement other than the hip bone.
2. Comparison of clinical outcomes according to BM biopsy status
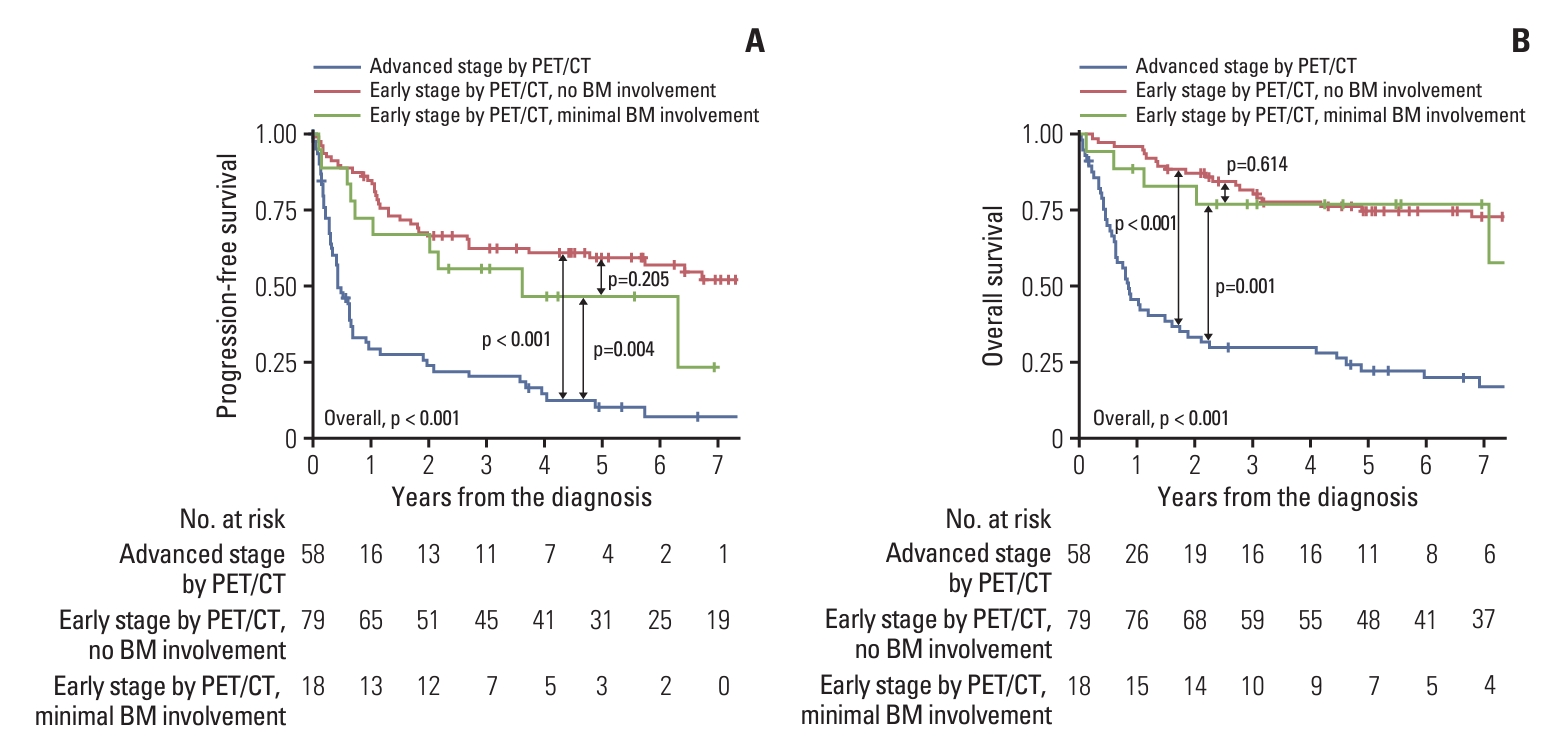
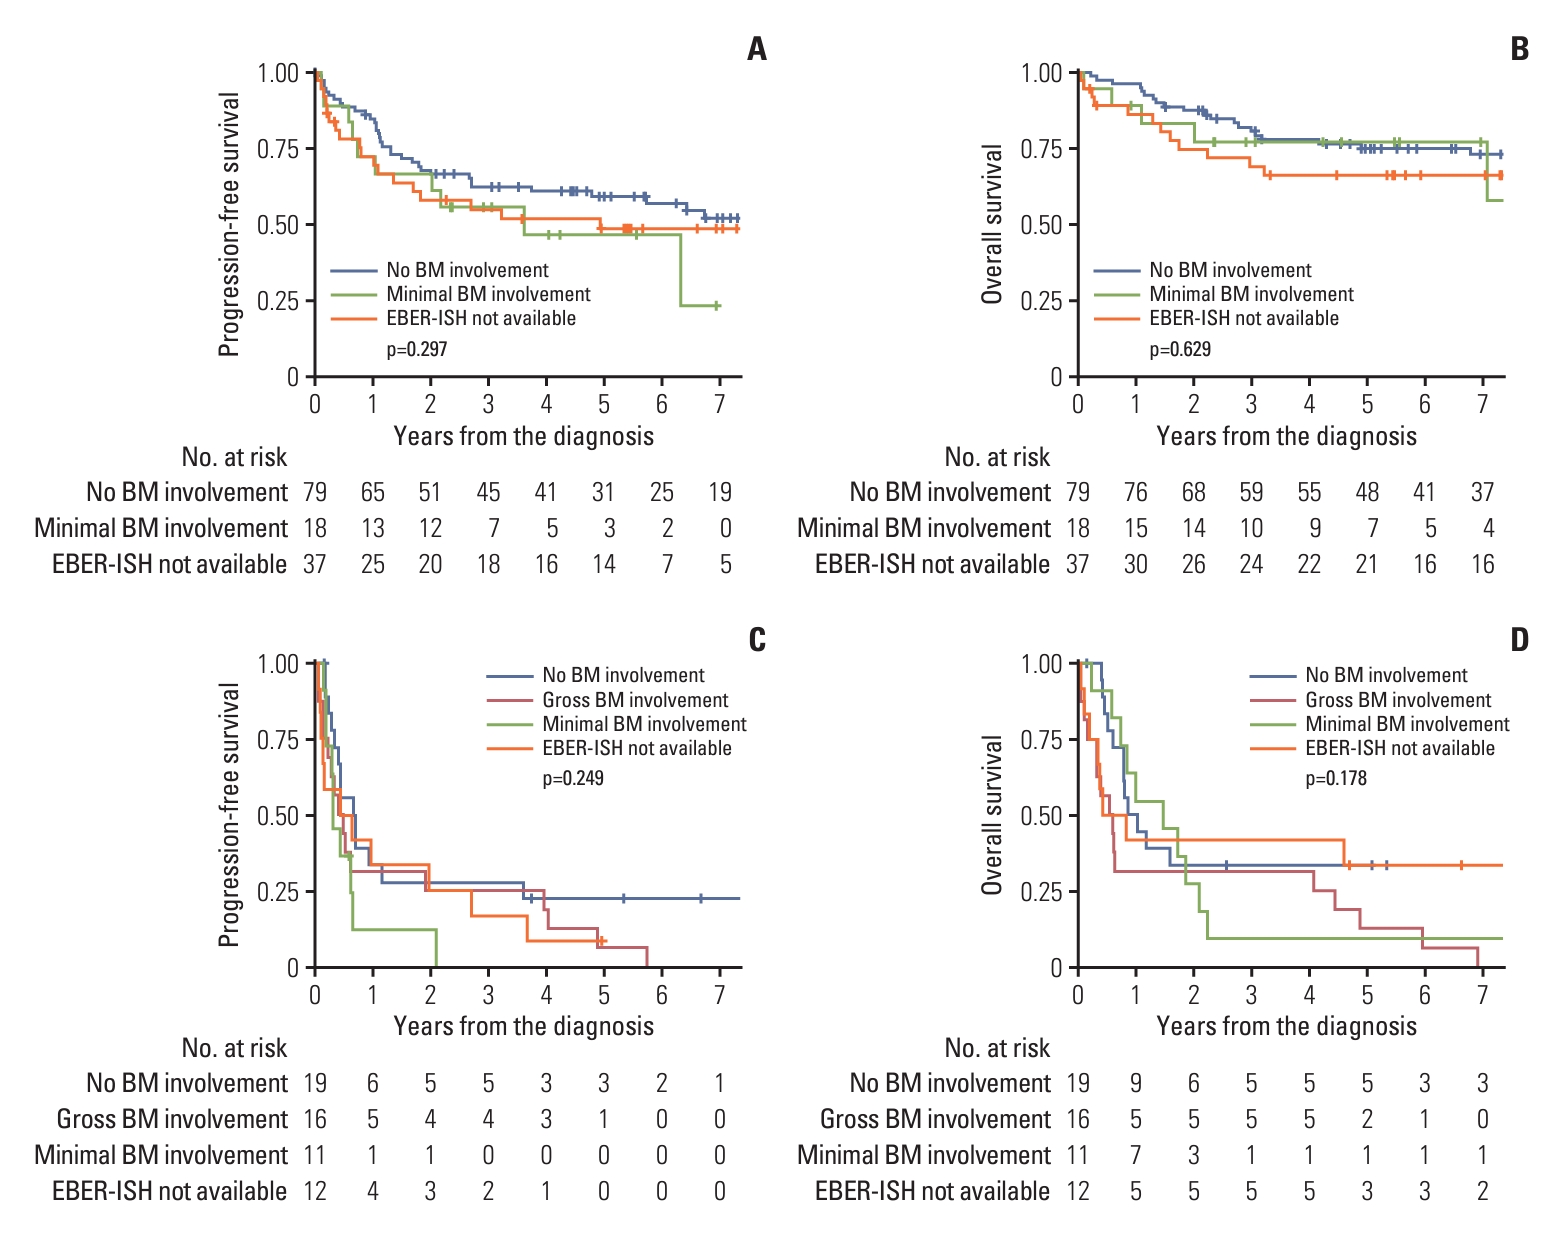
PFS and OS were analyzed in a cohort of 155 (80.3%) patients, excluding one patient (0.5%) with gross BM involvement and 37 patients (19.2%) without available EBER-ISH results among the PET-ES group. The median follow-up duration for these patients was 3.2 years (range, 0.0 to 13.6 years). The actuarial rates of PFS and OS for the three patient groups have been depicted in Fig. 1. A significant intergroup difference was observed for both PFS and OS among the three groups (both p < 0.001). Post-hoc analyses for PFS and OS revealed that the clinical outcomes of the PET-ES group with minimal BM involvement were closer to those of the PET-ES group with no BM involvement than to those of the PET-AS group. When clinical outcomes were compared according to BM biopsy status within each of the PET-ES and PET-AS groups, excluding one patient in the PET-ES group with gross BM involvement, no differences were observed in PFS and OS (Fig. 2).
Discussion
This study aimed to compare the assessment of BM involvement in ENKTL using PET/CT and BM biopsy. PET/CT demonstrated a moderate sensitivity (64.7%) and high specificity (96.0%) in detecting gross BM involvement, as well as a low sensitivity (30.4%) and high specificity (99.0%) in detecting any (gross and minimal) BM involvement. Gross BM involvement was rare (0.7%) among patients in the PET-ES group with minimal BM involvement was observed in 13.3% of the PET-ES group. Patients in the PET-ES group with minimal BM involvement did not exhibit significant differences in clinical outcomes compared to those with no BM involvement.
A unique aspect of this study, distinguishing it from previous literature utilizing PET/CT, was the categorization of BM involvement into two distinct categories: gross BM involvement and minimal BM involvement. This classification was designed to address the clinical challenge associated with suspicious BM involvement by a small number of EBV+ cells. Earlier retrospective studies on ENKTL have demonstrated that the presence of EBV+ cells in BM biopsy, detected through EBER-ISH, is linked with worse survival [20,21]. Building on these findings, the current National Comprehensive Cancer Network guideline for ENKTL advocates performing EBER-ISH for BM biopsies that are morphologically negative. In these cases, BM involvement is considered present if EBV+ cells are detected [10]. In practice, however, the execution of EBER-ISH in morphologically negative BM biopsies is often overlooked, as evidenced by the fact that EBER-ISH was not carried out in approximately 30% of grossly negative BM biopsy cases in this study. Furthermore, hematopathologists frequently grapple with uncertainty when a limited number of EBV+ cells are detected by EBER-ISH, as the exact origin of these cells often remains unknown. This ambiguity stems from the fact that EBV+ cells can be identified in patients without EBV-related malignancy [22,23]. In this study, patients classified as early stage by PET/CT with minimal BM involvement mainly received definitive radiation or concurrent chemoradiation. This was often due to treating clinicians in participating institutions of this study deeming it as early stage. Interestingly, in contrast to prior studies [20,21], these patients did not exhibit a statistically significant difference in clinical outcomes when compared to patients whose BM biopsy specimens were confirmed as negative through EBER-ISH. It is important to note that previous studies highlighting the clinical significance of EBV+ cells in BM biopsy did not specifically mention PET/CT as a diagnostic tool [20,21]. In this study, however, all patients underwent PET/CT as part of the staging work-up. This divergence in outcomes could be speculated to result from patients with minimal BM involvement potentially comprising a mixed group—encompassing those with true positive BM involvement by lymphoma, as well as those with EBV+ reactive cells in the BM. Following the integration of PET/CT as a standard diagnostic tool, it is possible that the proportion of the latter group might have increased, leading to these contrasting results.
However, there could be other explanations for the lack of clinical significance of minimal BM involvement in early-stage disease. In this study, patients in the PET-ES group with minimal BM involvement had a lower overall disease burden when compared to those in the PET-AS group. While systemic treatment for these patients may be insufficient for eradicating typical BM involvement of lymphoma, early disease detection, and appropriate follow-up can significantly influence treatment outcomes. Further exploration is needed to understand the association between the absence of differences in treatment outcomes due to minimal BM involvement and the diagnostic procedures.
Several previous studies have evaluated the accuracy of PET/CT for assessing BM involvement in ENKTL in comparison with BM biopsy. Some of these studies reported both high sensitivity (100%) and specificity (86%-93%) [13,14], while recent large retrospective Chinese studies, involving several hundred patients, demonstrated high (93%-97%) specificity, but only moderate (46%-67%) sensitivity [16,17]. These Chinese studies also concluded that PET/CT holds potential for the assessment of BM involvement in early-stage disease. Another study reported a mediocre level of both sensitivity (62%-64%) and specificity (73%-76%) [15]. The precise methodology for diagnosing BM involvement from BM biopsy specimens was not extensively detailed in these prior studies, but recent Chinese studies did mention the performance of EBER-ISH when indicated [16,17]. In this study, the reported accuracy of PET/CT for detecting gross BM involvement aligned with the results of recent large Chinese studies. However, when it came to detecting any form of BM involvement (both gross and minimal), PET/CT exhibited low sensitivity while maintaining high specificity. If minimal BM involvement were to be considered as a true positive, substituting BM biopsy with PET/CT for BM assessment might not be feasible due to this low sensitivity, even for early-stage disease. Conversely, if minimal BM involvement did not have clinical significance, the significance of PET/CT for assessing BM involvement would be noteworthy for early-stage disease. Therefore, the clinical significance of minimal BM involvement within modern diagnostic and treatment approaches needs to be confirmed to determine the practical utilization of PET/CT for BM assessment in ENKTL. Nevertheless, given that PET/CT exhibits only moderate sensitivity even for detecting gross BM involvement, relying solely on PET/CT for BM assessment may pose a risk of understaging.
Caution is necessary when attempting to apply the results of this study to clinical practice, as several significant limitations are present. First, a clear definition of minimal BM involvement was lacking since the precise extent of EBV+ cells in the BM was available only for a few specimens. Clinical outcomes could potentially be distinguished based on the precise burden of EBV+ cells in the BM. However, conducting such an analysis was not feasible within the scope of this study. Second, no central review of PET/CT scans and BM biopsies was conducted. Furthermore, only the reports from BM biopsies were reviewed, without examining the actual biopsy specimens. Third, the number of patients in the PET-ES group with minimal BM involvement was relatively small, potentially leading to a lack of representativeness. Despite these limitations, the insights from this study could guide future research directions to explore the clinical significance of PET/CT and BM biopsy for ENKTL. These observations might also contribute to the establishment of accurate treatment strategies for patients with minimal BM involvement.
In conclusion, PET/CT exhibits high specificity for ruling out BM involvement, yet demonstrates only mediocre and low sensitivity in detecting gross and minimal BM involvement, respectively, in comparison with BM biopsy. Given that patients with minimal BM involvement, as identified through BM biopsy, did not exhibit a significant difference in clinical outcomes when compared to those with no BM involvement within the PET-ES group, the assessment of BM involvement using PET/CT may have some clinical significance, as only a very small number of patients demonstrated gross BM involvement when classified as early stage by PET/CT. However, these findings necessitate further clarification before their direct application to clinical practice.