Introduction
Gastric cancer (GC), with 1,000,000 new cases worldwide in 2018, is the fifth most frequently diagnosed cancer and the third most common cancer-related cause of death [1]. In 2018, nearly 27,500 new cases are expected to be diagnosed in Western Europe [1]. The prognosis for affected patients is poor.
Surgical resection is the only potentially curative treatment. If early GCs without positive lymph nodes could require surgical resection exclusively, locally advanced and nodal-positive disease should be treated in a multi-disciplinary approach [2].
Based on the results of the MAGIC trial published in 2006, perioperative treatment became the recommended treatment for advanced stages of gastric cancer before tumor resection in many European guidelines. MAGIC study showed that perioperative combination chemotherapy (CT) with ECF (epirubicin, cisplatin, and 5-fluorouracil [5FU]) was associated with tumor downsizing and downstaging, and a significant overall survival (OS) benefit compared with surgery alone [3]. The smaller French trial ACCORD has confirmed these results in 2011 [4]. However, both studies revealed a completion rate of CT or surgery of about 50%, highlighting the interests of preoperative CT over postoperative CT.
The high rates of locoregional recurrence have been attributed to the abundant lymphatic channels within the gastric wall, providing channels for mucosal skip lesions and numerous potential pathways of lymphatic drainage away from the stomach. Considering that the curative resection rate can be improved by preoperative CT, the neoadjuvant chemoradiotherapy (CRT) approach advantages include the potential for tumor downstaging with an increase in the complete R0 resection rate, the treatment of potential micrometastases and, a better patient tolerability [5]. Indeed, patients with less than R0 resection have a worse survival time than those with R0 resection [6] and tumor regression on final surgical pathology has been reported to be an independent factor associated with improved survival in patients receiving neoadjuvant treatment in GC [7-9]. Based on these considerations, two trials have emerged (TOPGEAR and CRITICS-II) and are still in progress [10,11].
Several smaller studies on preoperative CRT have already been published, with encouraging results in terms of R0-resection rates, pathological responses, survival, and tolerance [7,9,10,12-14].
This phase II trial was designed to assess neoadjuvant CRT benefits in patients with locally advanced resectable gastric adenocarcinoma. The DCF (docetaxel, cisplatin, and 5FU) regimen, was chosen for induction CT, based on the superior efficacy of DCF compared to standard ECF in palliative setting [15,16]. Recently perioperative treatments have significantly improved survival in patients with resectable GC, increasing 5-year OS from 23% with surgery alone to 45% with FLOT (fluorouracil, oxaliplatin, docetaxel) [17,18]. Regarding CRT, the radiotherapy (RT) was associated with oxaliplatin and 5FU, according to the promising results obtained in the oesophageal cancer and avoiding the cumulative renal toxicities with RT [19].
Materials and Methods
1. Study design and objectives
The NESC study is a multicenter, non-randomized, with one treatment arm, phase II trial. The study recruited in several French centres from March 2009 to May 2014. The protocol was approved by the Committee for the Protection of the People of Southern Mediterranean II (NCT01565109).
The objectives were to assess neoadjuvant CRT outcomes in patients with locally advanced resectable gastric adenocarcinoma. The primary endpoint was pathologic complete response (pathCR) rate with an expected result of 25%. Assuming an accrual period of 48 months and a follow-up period of 5 years, testing with a powder of 90% at a level α=0.05, a study sample size of 34 patients was needed. Unfortunately, one patient withdrew his consent during CRT, so data from 33 patients were investigated. Secondary endpoints were R0-resection rate, progression-free survival (PFS), and OS.
2. Study population
Eligible patients had a histologically proven adenocarcinoma of the stomach or gastroesophageal junction (Siewert types II and III), stage Ib to IIIc, and have resectable disease according to initial staging (UICC, Union for International Cancer Control 7th edition). Preoperative staging was performed using computed tomography scan and endoscopic ultrasound. Additional substantial eligibility criteria included Eastern Cooperative Oncology Group (ECOG) performance status < 2, an adequate bone marrow, liver, and renal function, a food intake greater than 1,000 kcal/day (assessed by nutrition physician and based on an exhaustive description of ingested food the day before inclusion) and life expectancy greater than 3 months. All patients were provided written informed consent prior to participating in the trial. Data were collected from March 2009 to February 2015 and the study was conducted until December 2018.
3. Treatment
(1) Preoperative study treatment: CT
Treatment consists of two cycles of DCF+lenograstim: docetaxel 75 mg/m2 on day 1, followed by cisplatin 75 mg/m2 on day 1, followed by 5FU 750 mg/m2/day administered as a continuous infusion on days 1-5 and lenograstim 150 µg/m2/day on days 6-12. All drugs are administered in a cycle of 21 days. Dose could be discontinued/reduced in case of severe toxicities on physician appreciation (grade 3 or 4 according to National Cancer Institute Common Terminology Criteria for Adverse Events [NCI-CTCAE] v4.0). All drug discontinuation or reduction were listed (Table 1).
(2) Preoperative study treatment: CRT
CRT was to begin 4-6 weeks after the completion of cycle 2 of induction DCF+lenograstim. RT consists of 45 Gy in 25 fractions of 1.8 Gy, 5 fractions per week for 5 weeks using image-guided intensity modulated radiotherapy technique, or volumetric-modulated arc radiotherapy.
The clinical target volume (CTV) has to be delineated on CT images based on all available diagnostic information and should include the tumor, stomach, and first draining lymph node station.
Concurrent with RT, OF (oxaliplatin and 5FU) CT is administered. Oxaliplatin at a dose of 85 mg/m2 fortnightly on days 1, 15, and 30 and 5FU 250 mg/m2 5 days a week as a continuous infusion are given to the patient on days 1-35. RT starts at the first day of the first cycle of CT, 4-6 weeks after the end of CT. RT and/or CT dose could be discontinued/reduced in case of severe toxicities (grade 3 or 4 according to NCI-CTCAE ver. 4.0). All discontinuation or reduction in drug or radiation dose, at physician’s convenience, were listed (Table 1).
Quality assurance RT treatment plans will be reviewed by the radiation coordinator of the study for the first inclusion of each investigational center and before RT begins to allow any adjustments to be made. Approval of the treatment plan must be obtained prior to the patient starting RT. The main parameters to be evaluated will be CTV contouring and dosimetry.
4. Assessments
The assessment of response to neoadjuvant treatment was defined by pathological response according to Mandard’s classification and survival rate (OS and PFS). A pathCR was defined as an absence of carcinoma cells in the primary site (tumor grade regression [TRG] 1 according to Mandard’s classification) and a pathological major response (pathMR) was defined as fibrosis with scattered tumor cells (TRG 2 according to Mandard’s classification). All other stages of Mandard’s classification were considered as non-responders. For each resected patient, two anatomopathological readings were performed.
5. Endpoint
The primary endpoint was the pathologic response rate (pathRR; pathCR and pathMR). Secondary endpoints were R0-resection rate, histologic regression grade, and survival (PFS and OS). The intention-to-treat (ITT) population included all registered patients being treated with at least one cycle of induction CT. The per-protocol (PP) population was defined as completing preoperative treatment and undergoing surgical resection.
The R0-resection, the pathRR and the histologic regression grade were assessed in the PP-population. Survival (PFS and OS) was assessed in both populations.
6. Statistical analysis
This study was carried out according to a phase II design (Fleming plan). Considering 63% of expected response in surgical patients and 50% of patients operated (non-surgery being considered as failures), there will be 32% overall objective response (pathCR and pathMR) in the group. If we use Fleming’s method with alpha=5% in unilateral test and beta=10% with a lower limit of the response rate (RR) of 25% and an upper limit of 45%, the number of subjects to be included is 34 and if the number of responders is greater than or equal to 14, then we will accept the hypothesis p=0.45.
Descriptive statistics are presented as median and range for quantitative variables. Discrete variables are reported as count and percentage.
PFS was defined as the time from the date of inclusion to the date of disease progression or death (due to any cause or date of last follow-up). OS was defined as the time from the date of inclusion to the date of death (due to any cause) or last follow-up. PFS and OS were obtained by the Kaplan-Meier method, and the log-rank test was used to compare differences between survival curves. The median follow-up time was computed using the inverse Kaplan-Meier method.
All statistical tests were two-sided and values of p < 0.05 were considered statistically significant. SAS software ver. 9.4 (SAS Institute Inc., Cary, NC) was used for all statistical analyses.
Results
1. Patients and tumors characteristics
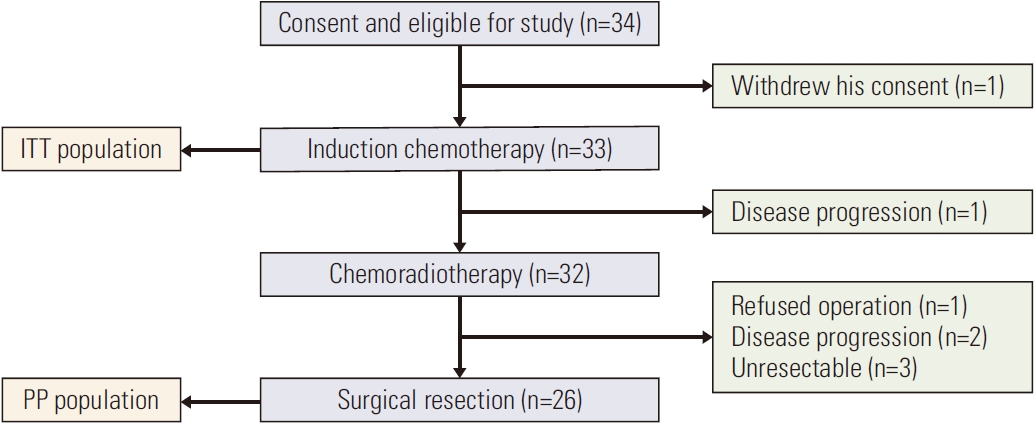
Between March 2009 and March 2018, 34 patients with GC were enrolled in the trial from eight centers in France. Among these 34 patients, one withdrew his consent, so his data could not be used. Thirty-three patients received induction CT. Among these 33 patients, one progressed after CT. The study population is summarized in Fig. 1.
2. Pathological evaluation and treatment efficacy
R0-resection rate was 100% in PP-population and 78.8% in ITT-population. Comparing to the initial clinical tumor classification with the post-therapeutic pathological assessment, downstaging within the PP-population was observed with regard to T-category in 50% and N-category in 53.8% of the patients.
In PP-population, six patients (23.1%) achieved pathCR (Mandard’s classification TRG 1) and seven patients (26.9%) achieved a pathMR (Mandard’s classification TRG 2).
None of the clinical factors (sex, ECOG performance status, tumor location, baseline T and N category) was significantly associated with the achievement of either pathCR or pathMR (S1 Table).
3. Survival
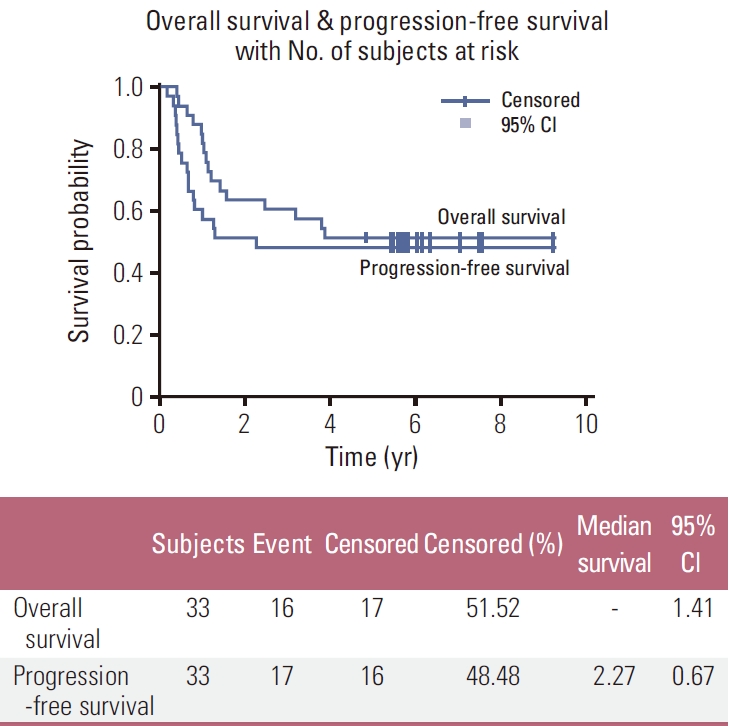
In the ITT-population, median PFS was 27.2 months and median OS was not reached because more than half of them were still living (event rate 16/33 patients). The 1-, 3-, and 5-year OS rates were 85%, 61%, and 52% respectively, and the 1- and 3-year PFS rates were 58% and 48% respectively (Fig. 2).
In the PP-population, with an event rate of 38.5% (10/26), median PFS and median OS were not reached. The 1-year OS rate was 88%, and the 1-year PFS rate was 69% (S2 Fig.).
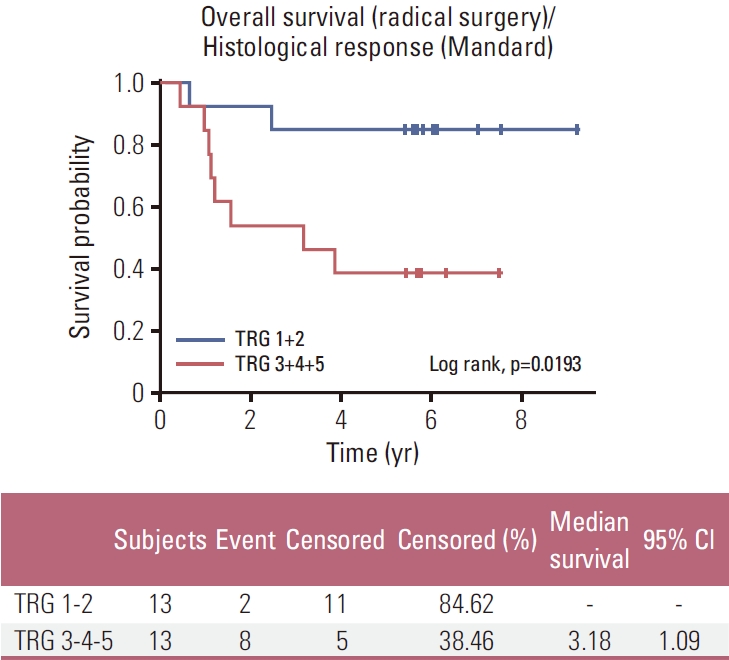
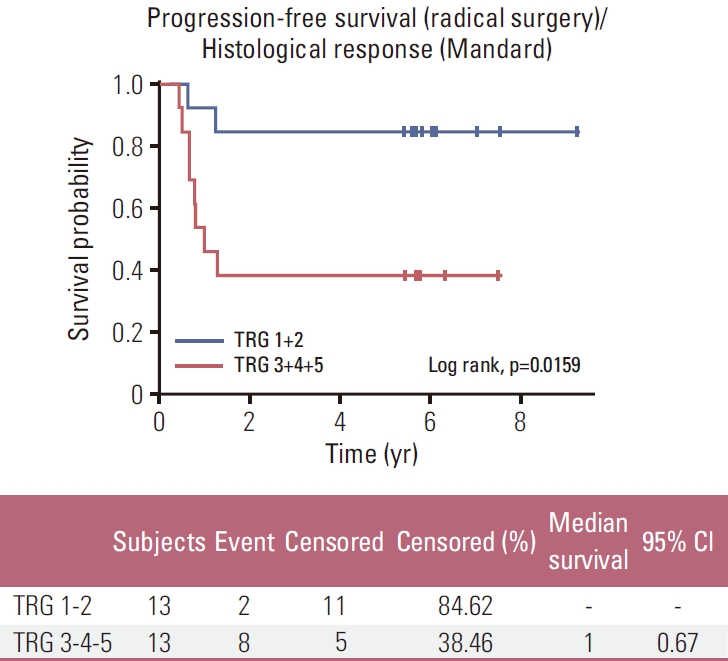
A subgroup analysis of all patients undergoing surgery revealed a significantly longer OS and PFS for patients with Mandard TRG 1-2 compared to Mandard TRG 3-4-5 (Figs. 3 and 4, respectively).
Among the 26 patients treated with preoperative induction CT followed by preoperative CRT and resected, 13 patients (50%) were pathological major responders (TRG 1-2) and 13 patients (50%) were non-responders (TRG 3-4-5). Therefore, obtaining pathMR according to Mandard’s classification (TRG 1-2) compared to the absence of response or minor pathological changes, is associated with longer OS and PFS in our population (p=0.019 and p=0.016, respectively).
4. Treatment and toxicity
The most common hematological toxicity NCI-CTCAE grade 3-4 included neutropenia (5 patients, 15.2%). Febrile aplasia occurred in five patients (15.2%). The most common gastrointestinal toxicities Radiation Therapy Oncology Group (RTOG) grade 3-4 were vomiting (4 patients, 12.5%), mucositis (4 patients, 12.5%), and anorexia (4 patients, 12.5%). Grade 3 neurosensory toxicity was diagnosed in one patient (3.5%). Treatment-induced mortality was observed in one patient due to stroke from chemo-induced thrombocytopenia (3.0%). Another two patients (7.7%) died due to postoperative complications (aortic rupture and arterial thrombosis).
Discussion
The NESC trial was designed to investigate a CRT-based neoadjuvant treatment regimen in patients with locally advanced resectable gastric adenocarcinoma. In the present study population, most frequent tumor locations were stomach (39.4%) and gastroesophageal junction (60.6%) which is in accordance with previous publications [4,17,20-22] but contrasts with the MAGIC study [3] and CRT study [7,23], in which most patients had tumors of the stomach.
R0-resection rate correlation with long-term survival after neoadjuvant therapy has previously been demonstrated for GC [24,25]. The R0-resection rate of 100% in our study relates to other trials investigating the addition of docetaxel to neoadjuvant CT [18,20,21].
Several trials in patients with oesophageal cancer and tumors of the gastroesophageal junction indicate that a survival benefit of perioperative CT can only be expected in metabolic and histopathologic responders [26-28]. PathCR in our trial was 23.1% (6/26 patients) which are consistent with preoperative CRT studies, reporting pathCR rate from 14% to 36% (Table 4) [7,14,29].
The OS in our population is better or similar to those reported in preoperative treatment studies ranging from 35 months to 65 months [3,4,8,17,18,20,22,29-31] and is also better to that from postoperative CRT, ranging from 24 months to 36 months [32-34]. The combination of CT and CRT increase the complete RR by 10% when compared with the most effective CT regimen [17].
Furthermore, we enrolled patients with advanced stage of cancer: 88% of T3-4 patients and 82% of N+ patients. Although its superiority was not compared directly, our data provided evidence that sequential treatment with CT and CRT may improve survival and warrant further investigation.
For resected patients, OS and PFS are significantly better in TRG 1-2 patients (p=0.016 and p=0.019, respectively). These results are better than those reported by Derieux et al. [23] in operated patients who received any preoperative CT.
In addition to survival benefits, preoperative CRT generally requires lower dose to achieve the same local control effect because of the increase in hypoxic tissues in the postoperative state. Consequently, preoperative CRT benefits are also important for long-term adverse effects [35].
Some authors have already reported an association between TRG and OS after neoadjuvant CT in GC [23,36,37]. To our knowledge, our study is the first to demonstrate that pathological response evaluated by Mandard’s TRG is a predictive factor of OS and PFS after CRT in locally advanced resectable gastric adenocarcinoma.
The present study has several limitations, attached to any phase 2 study, mainly associated with a small study population and the lack of randomization. Statistical power could be significantly increased with a larger sample size and a comparative population. Indeed, the balance with literature data is less reliable.
Moreover, using Mandard’s TRG to assess pathological response in GC remains controversial. First, there is an overevaluation risk of tumor response in poorly cohesive carcinoma and, in responders, foamy histiocytes could be mistaken for signet-ring cells, which might lead to underestimate pathological response [38]. These limitations have been particularly highlighted by Smyth et al. [39], reporting an 18% rate of TRG 2-3 in patients who did not receive any preoperative treatment, stressing the over-evaluation risk of tumor response. Unfortunately, at present, there are no standardized tools for measuring response.
Despite an improvement in the pathological response with preoperative CRT, the pathCR rate remains low. Otherwise, our results are slightly below our target of 25%. Therefore, for these pathologies, it is important to measure the benefits and risks of neoadjuvant approach that delays surgical resection. Identification of predictive factors of pathological response is a major issue to guide the physician’s therapeutic choice.
This phase 2 trial is part of the current trend to assess the neoadjuvant CRT benefits in locally advanced resectable gastric adenocarcinoma. Our results suggest that this treatment strategy has good pathologic responses which leads to improve survival time. Further studies are needed to confirm these results. Otherwise, large-scale randomized clinical trials are in progress (TOP GEAR, CRITICS-II). The results are very expected.