Introduction
Cancer is one of the leading causes of death worldwide, with an estimated 19.3 million new cancer cases and 10 million deaths worldwide in 2020 [1]. In Korea, cancer has been the leading cause of death since 1983 [2]. In response to this public health threat, the National Plan for Cancer Control was implemented in 1996, and the 4th stage is in effect from 2021. As a fundamental part of the Plan, the Korea Central Cancer Registry (KCCR) publishes cancer registration statistics every year. In 2020, there was a negative impact on cancer diagnosis and treatment as medical use declined due to the coronavirus disease 2019 (COVID-19) pandemic. Reduced and delayed access to health care, including dec-reased cancer screening rates, was a phenomenon that has appeared not only in Korea but globally [3–5]. While short-term decreases in cancer incidence statistics are expected, it will take years to quantify the associations and consequences of these phenomenon, which is beyond the scope of this article [3]. In this study, we report the most recent nationwide statistics on cancer incidence, survival, prevalence, and mortality, and their temporal trends.
Materials and Methods
1. Data sources
Annual cancer statistics in Korea are calculated using a national and population-based database of cancer occurrence, the Korea National Cancer Incidence Database (KNCI DB). Every year, the KCCR collects information on patients diagnosed with cancer at hospitals across the country during the past year. The data from previous year is backed up with information compiled by central and 11 regional cancer registries, including information on cancer patients missed in hospital-based registrations. Hence, it takes two years to complete and calculate the year’s KNCI DB and cancer statistics. The KCCR has reported nationwide statistics since 1999; other detailed information on the KCCR and KNCI DB is provided in our previous report [6]. Completeness is an important indicator of data quality, and the 2020 KNCI DB was estimated to be 98.3% complete using the method proposed by Ajiki et al. [7].
Annual mid-year population data and recently updated mortality data including causes of death from 1983 were obtained from Statistics Korea [2]. To confirm the validity of individual vital statuses used in survival and prevalence calculation, the KNCI DB was linked to both mortality and population resident registration data, which were obtained from the Ministry of the Interior and Safety.
2. Cancer classification
All cancer cases had been registered in accordance with the International Classification of Diseases for Oncology, 3rd edition (ICD-O-3) [8]. The range of cancers to be registered and used for the national statistics calculation was limited to records with a behavior code of “/2 (carcinoma in situ)” or “/3 (malignant),” from the morphology (i.e., histology) codes of ICD-O-3, by which a patient was initially enrolled in the KNCI DB. Similar to previous reports, malignant cancer cases and their statistics were mainly assessed in this article. In addition, the supplementary incidence statistics for carcinoma in situ cases were also calculated separately, using 2020 KNCI DB.
For the convenience of classification and reporting, the ICD-O-3 codes were converted to the classification of the International Classification of Diseases, 10th edition (ICD-10) [9]. Exceptionally, some hematopoietic diseases (myeloproliferative disorders/myelodysplastic syndromes) are not classified as malignant cancer in ICD-10 classification, therefore their ICD-O-3 codes were used without any conversion. For mortality data, causes of death were coded according to the ICD-10.
We adopted cancer classifications with 24 and 61 types; the former was a modified classification based on the GLOBOCAN cancer dictionary [10], and the latter was the taxonomy used in “Cancer Incidence in Five Continents” [11], and both of them were provided by the International Association of Cancer Registries. In this article, cancer classification with 24 types of cancer was used for description. The summary staging system developed under the Surveillance, Epidemiology, and End Results (SEER) program (i.e., SEER summary staging) [12] was used to categorize the extent of tumor invasion or metastasis.
3. Statistical analyses
Incidence, mortality, and prevalence rates were expressed as crude rates (CRs) or age-standardized rates (ASRs) per 100,000 people. The CR was defined as the total number of newly diagnosed (for incidence) or deceased (for mortality) cases in a year divided by the mid-year population. The ASR was defined as the weighted average of the age-specific rates in which the weights represent the proportions of people in the corresponding age groups in a standard population [13]. ASRs were standardized using Segi’s world standard population [14]. The cumulative risk of developing cancer from birth to life expectancy during 2020 in Korea were also assessed, assuming no other cause of death (i.e., by simply calculating the sum of the age-specific cancer rates from birth to life expectancy), as follows [13]:
Trends in ASRs were estimated using Joinpoint regression, with a maximum number of two joinpoints. The results were summarized as annual percentage changes with the best model fit, based on a linear model for the natural log-transformed ASRs.
The survival rate of cancer patients, diagnosed between 1993 and 2020, was calculated based on the results of follow-up until December 31, 2021. The 5-year relative survival rate was defined as the ratio of observed survival of cancer patients to expected survival in the general population, adjusting the effects of other causes of death using the standard population life table provided by Statistics Korea [2]. Relative survival rates were estimated using the Ederer II method [15] with some minor corrections, based on an algorithm devised by Paul Dickman [16]. Trends in 5-year relative survival rates were evaluated as percent differences in survival rates between 1993–1995 and 2016–2020.
Prevalent cases were defined as the number of cancer patients alive on January 1, 2021 among all the patients diagnosed with cancer between 1999 and 2020. p < 0.05 was considered statistically significant. SEER*Stat, Joinpoint 4.7.0.0 (National Cancer Institute, Bethesda, MD), and SAS ver. 9.4 (SAS Institute Inc., Cary, NC) were used for statistical analyses.
Results
1. Incidence
The number of new cancer diagnoses in 2020 decreased by 9,218 cases (3.6%) compared to 2019. In 2020, a total of 247,952 people were newly diagnosed with cancer in Korea, of which 52.7% (130,618 cases) were men and 47.3% (117,334 cases) were women (Table 1). The five most diagnosed cancers in Korea were thyroid, lung, colorectal, stomach, and breast cancers; in men, lung and stomach cancers were followed by prostate, colorectal, and liver cancers, whereas breast and thyroid cancers were followed by colorectal, lung, and stomach cancers in women. These top five cancers in each sex accounted for 62.8% and 64.8% of all cancer cases in men and women, respectively. Among the five most diagnosed cancers, the decrease in new cancer diagnosis in 2020 compared to 2019 was the largest for stomach cancer (3,058 cases, −10.3%), followed by thyroid cancer (1,827 cases, −5.9%), and colorectal cancer (1,549 cases, −5.3%). Thyroid cancer was the most frequent cancer from 2010 to 2014: its ranking fell after the debate on overdiagnosis in 2014, but recently rose again and regained the first rank since 2019. Table 2 provides the CRs and ASRs of cancer incidence in 2020. The CR and ASR of all cancer incidence were 482.9 per 100,000 (510.1 for men and 455.8 for women) and 262.2 per 100,000 (279.1 for men and 257.3 for women), respectively. The difference bet-ween CR and ASR implies that majority of cancer patients in Korea belong to the elderly, as opposed to the world’s standard population, which has a higher proportion of young people. The overall lifetime probability of being diagnosed with any cancer was 36.9%, under the condition that one survives to the age that matches the life expectancy of the Korean population. That probability was higher in men (39.0%) than in women (33.9%) (data not shown).
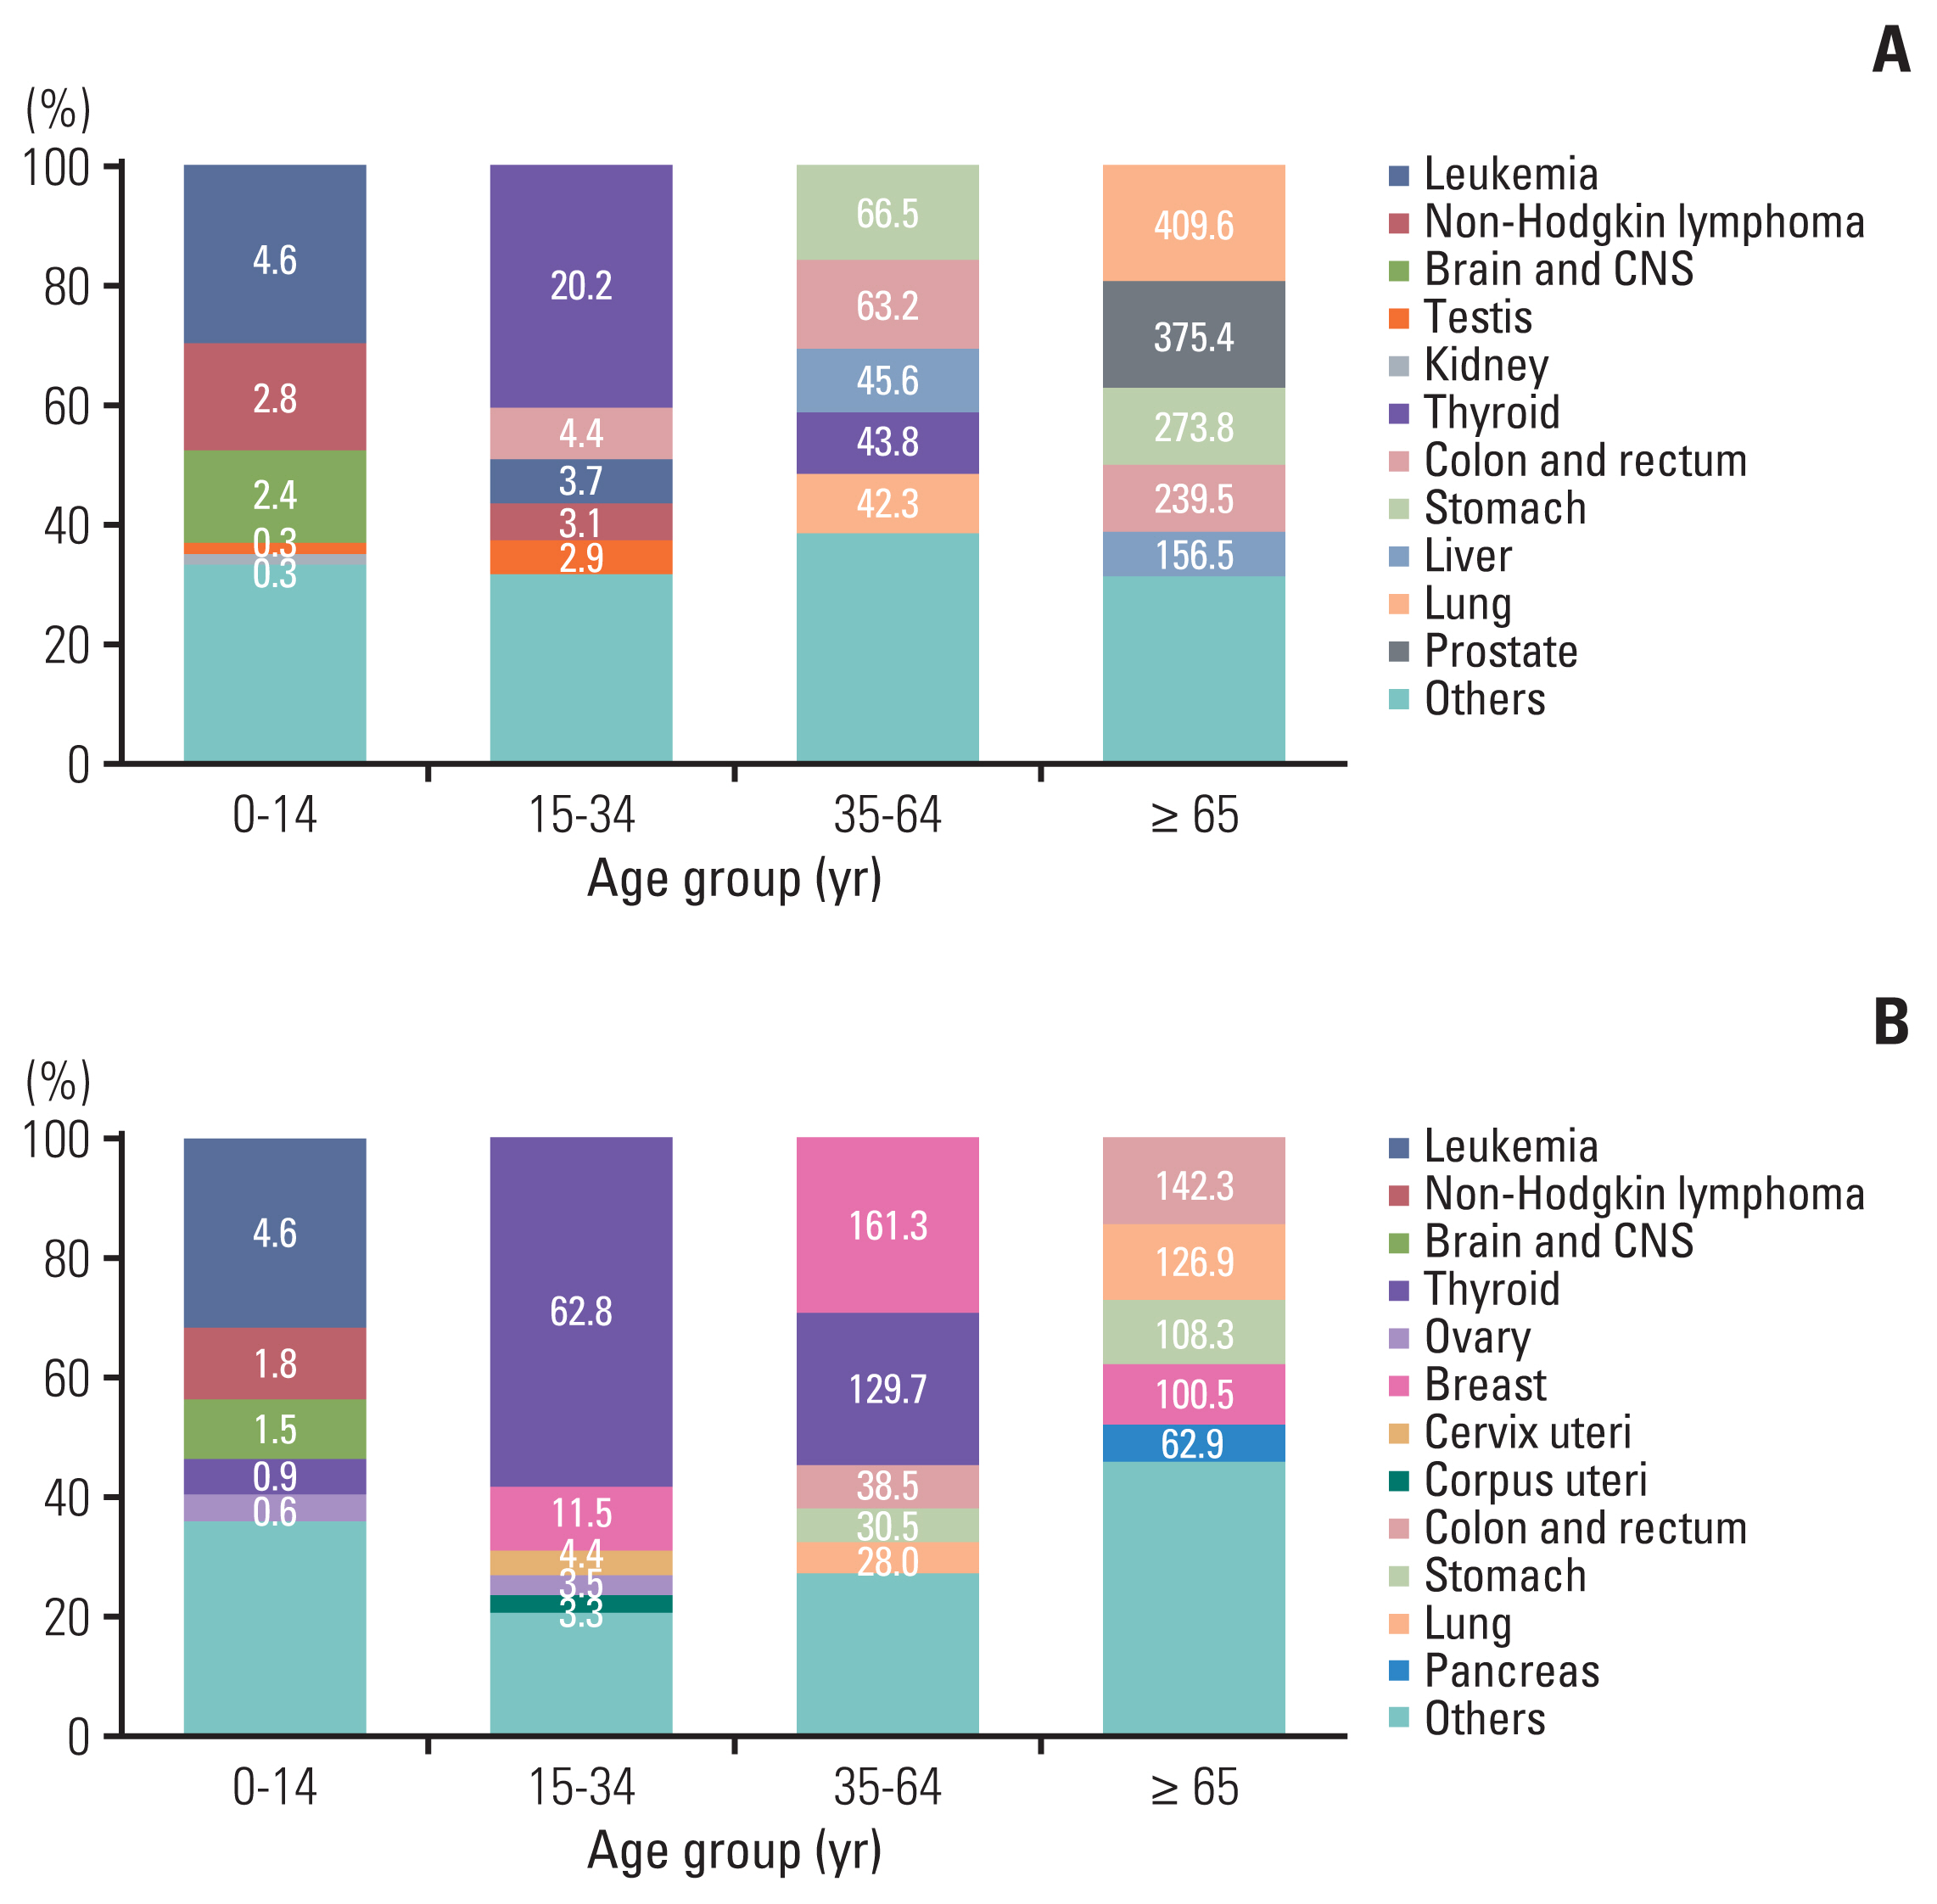
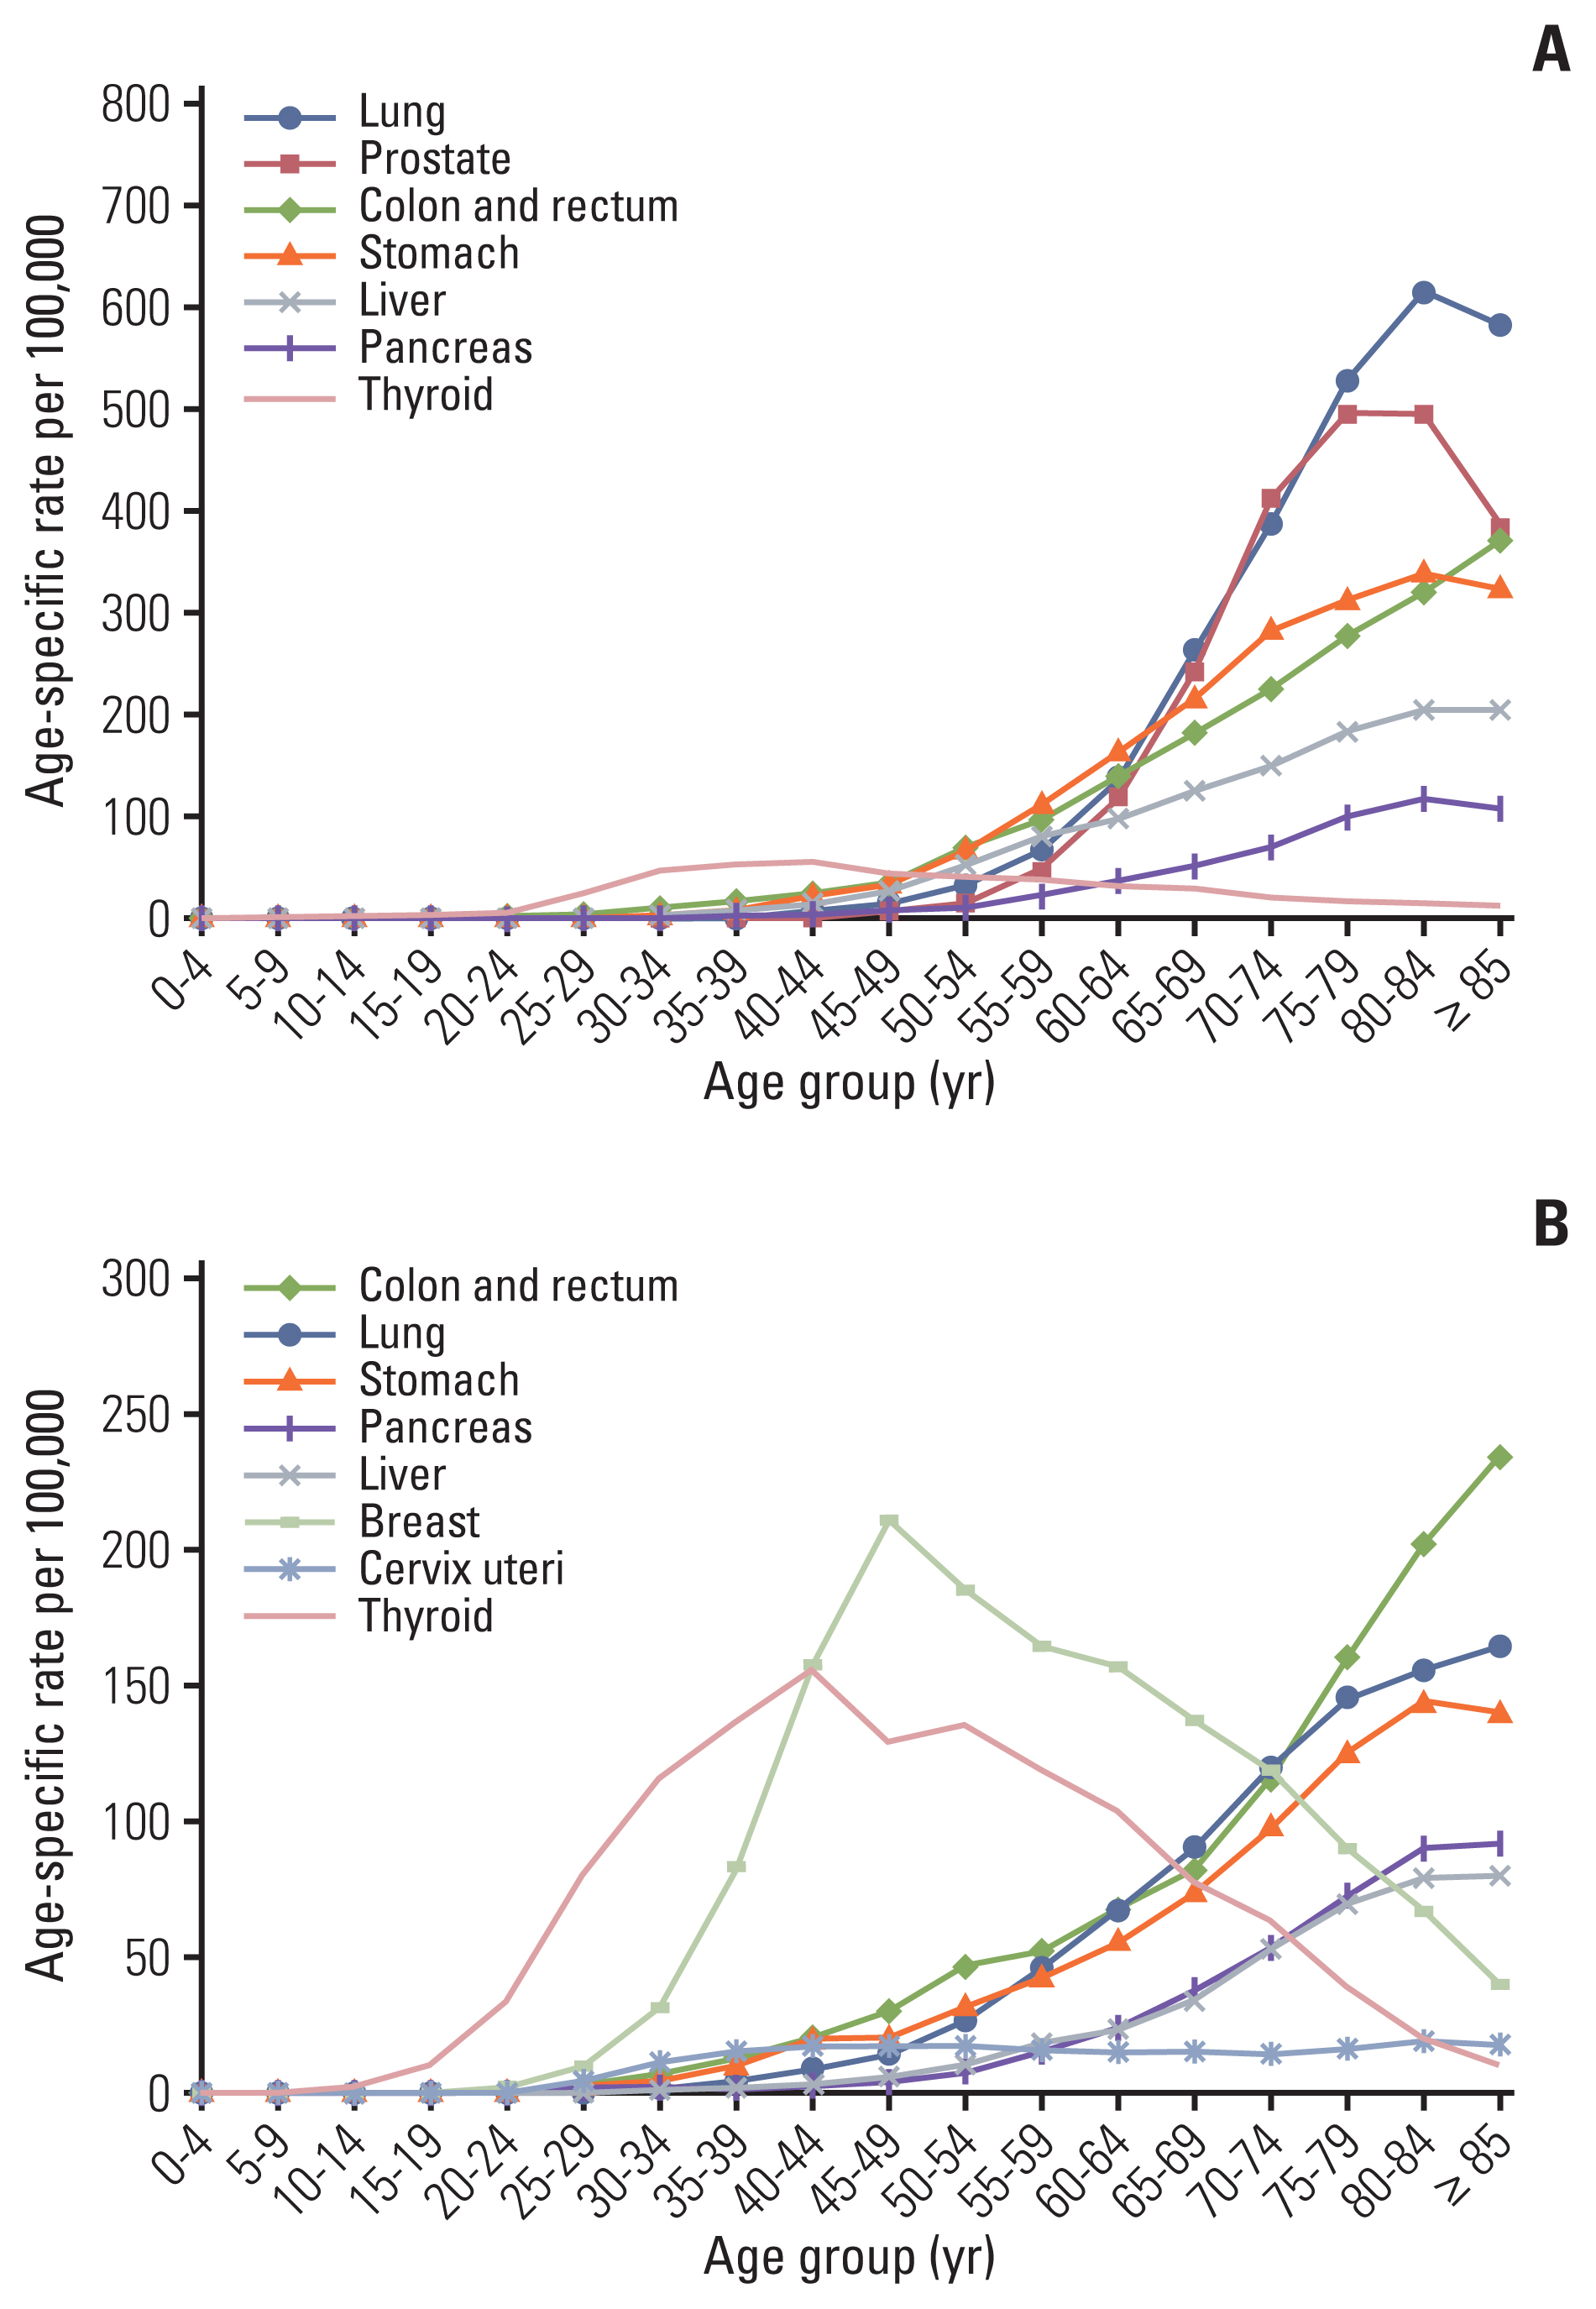
There were marked differences in age-specific incidence rates (Fig. 1). In the childhood population (0–14 years), leukemia, non-Hodgkin lymphoma, and brain and central nervous system (CNS) cancer were the top three cancers in both sexes, accounting for 30.5%, 15.2%, and 12.9% of all cancer cases diagnosed in this age group, respectively. Thyroid cancer was the most common cancer in both sexes among the adolescent and young adult populations (15–34 years), accounting for 52.3% of all cancers diagnosed. The most common cancers in that age group, excluding thyroid cancer, were colorectal cancer and leukemia in men, and breast and cervical cancer in women. In the 35–64-year age group, men were most commonly diagnosed with stomach, colorectal, liver, and thyroid cancers (collectively accounting for 51.5%), while breast and thyroid cancers were the most common in women (collectively accounting for 54.6%). For those aged 65 years and above, lung and prostate cancers were the most common in men, while colorectal and lung cancers were the most common in women. Most cancers have shown to increase in incidence with age; the exceptions were thyroid cancer in both sexes and breast cancer in women, which showed the highest incidence in those in their 30–40s and 40–50s age groups, respectively (Fig. 2).
2. Mortality
Since the causes-of-death statistics were published in 1983, cancer has been the number one cause of death in Korea. As of 2020, a total of 82,204 people (61.8% men and 38.2% women) died of cancer, accounting for 27.0% of all deaths in Korea (Tables 1 and 3). The overall CR for cancer deaths was 160.1 per 100,000, and the rate was approximately 1.6 times higher for men than for women (Table 4). Lung cancer was the leading cause of cancer death in both sexes (CR, 54.0 per 100,000 in men and 18.8 per 100,000 in women), followed by liver and colorectal cancers in men, and colorectal and pancreatic cancers in women. When stratified according to the age at the time of death, the most common causes of cancer mortality in both sexes were as follows: leukemia in their 10s and 20s, breast cancer in their 30s, liver cancer in their 40s and 50s, and lung cancer among those 60 years old or older (data not shown).
3. Trends in cancer incidence and mortality
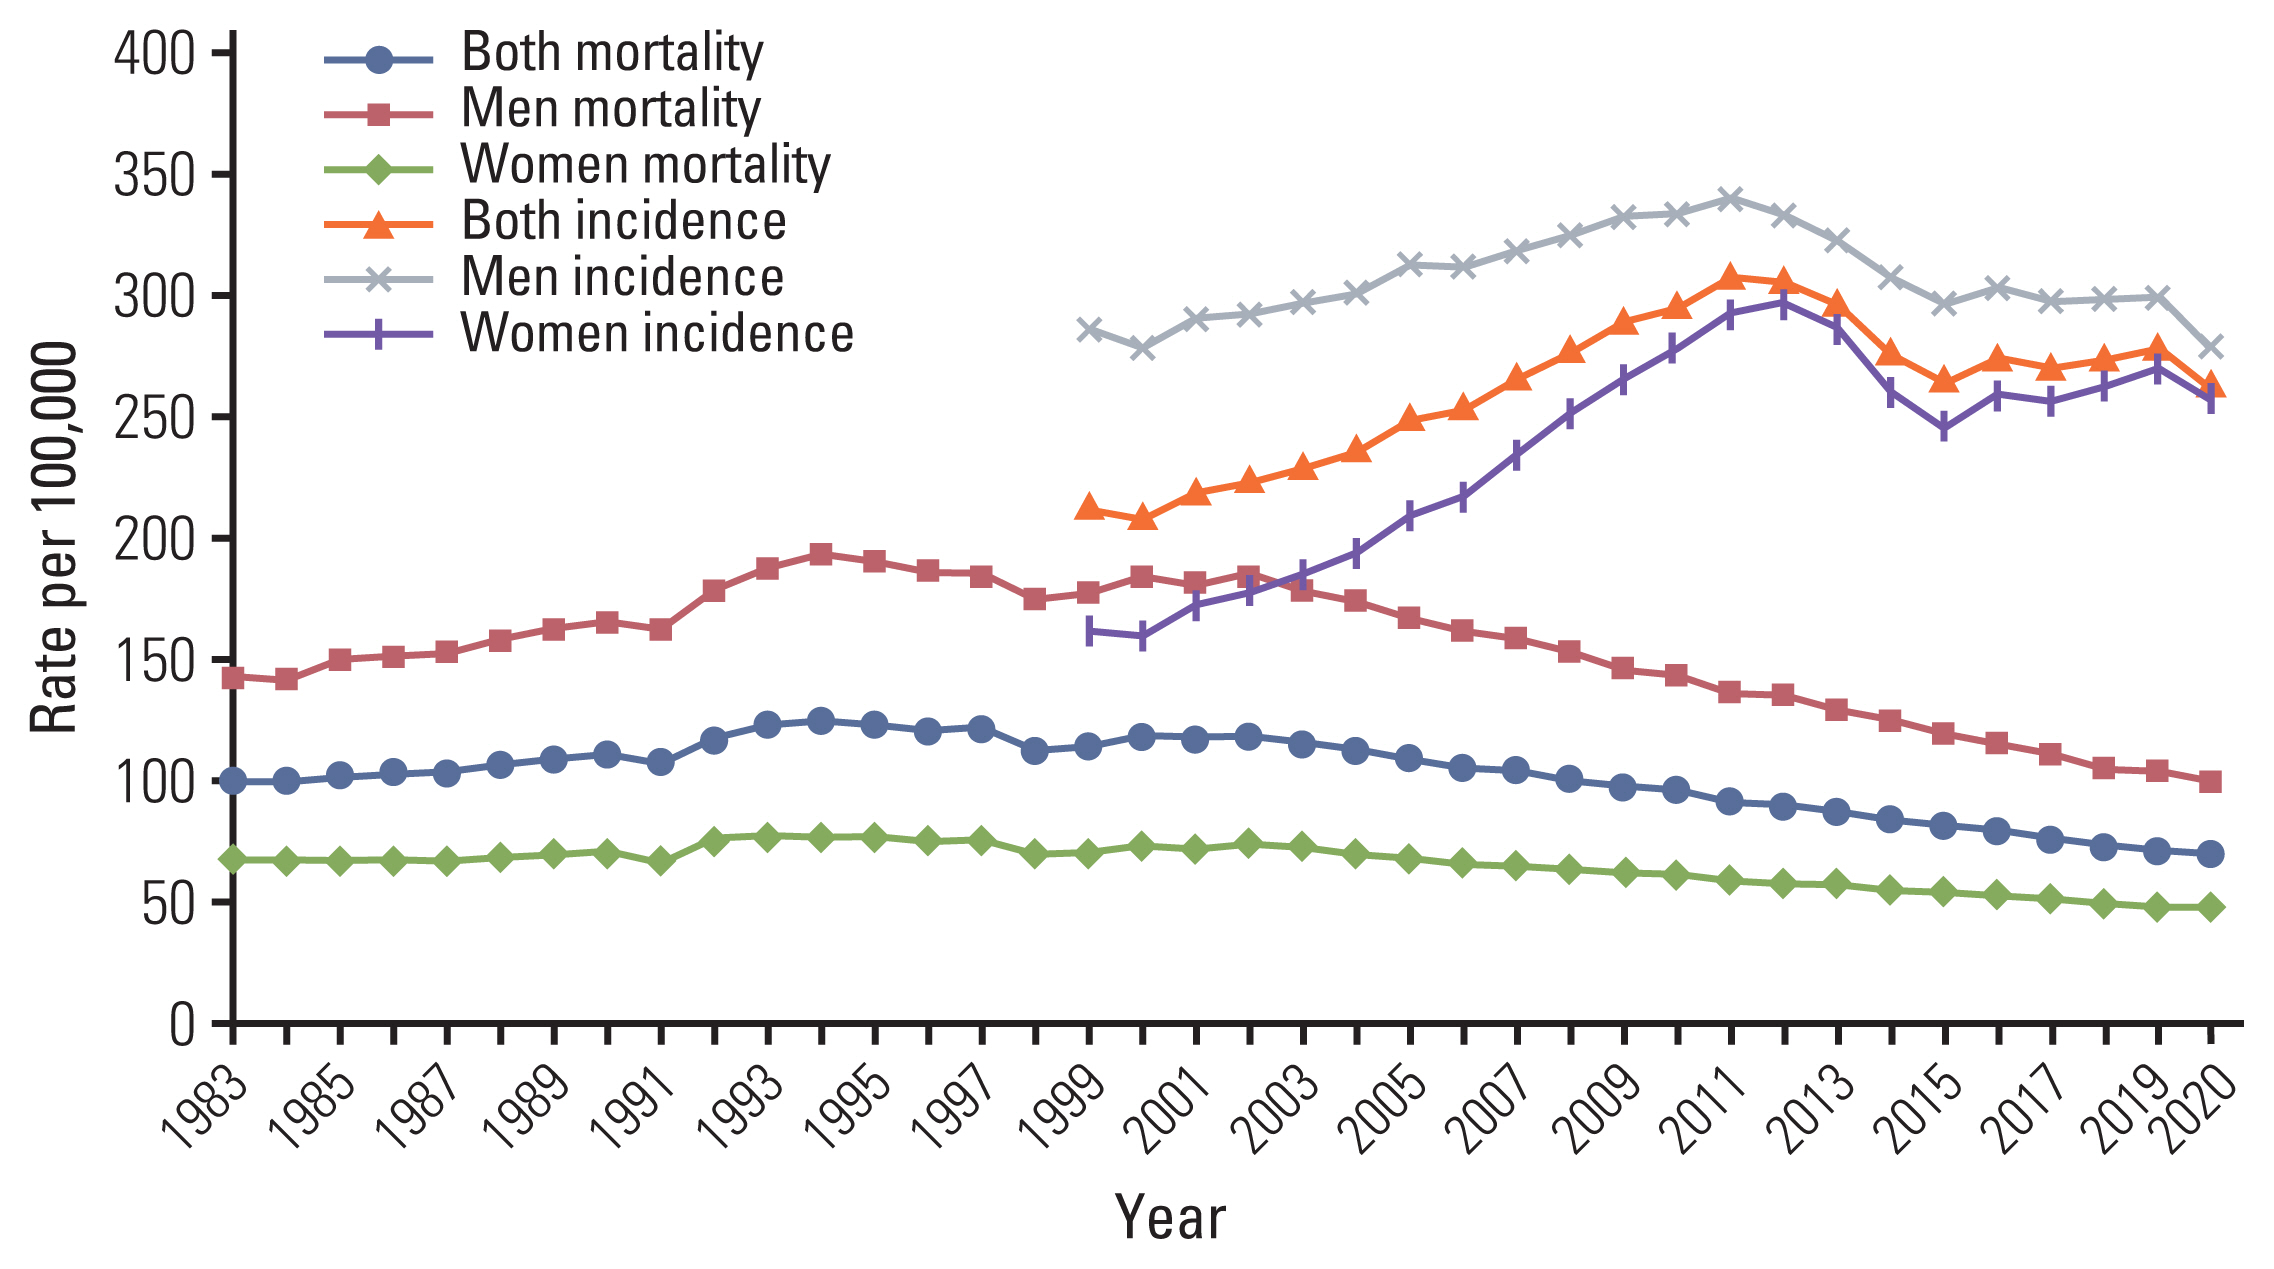
Changes in cancer incidence rates from 1999 to 2020 and mortality rates from 1983 to 2020 are depicted in Fig. 3. Compared to 1999, cancer incidence rates increased about 23.6% and mortality rates decreased about 39.3%, in 2020 (Table 5). The overall cancer incidence rates increased by approximately 3.3% per year until 2012, followed by a decline until 2015 with an annual decrease of 5.0%, and thereafter showed nonsignificant changes. In contrast, cancer mortality rates demonstrated nonsignificant changes until 2002, and decreased thereafter with an annual decrease of 2.7% until 2013, and a further decrease of 3.3% per year until 2020. These trends were observed similarly in both men and women, although the slopes of change were much more pronounced in women for incidence, and in men for mortality rates (S1 and S2 Tables).
Since 1999, breast, pancreas, kidney, and hematologic (leukemia and lymphoma) cancers, and that of some male or female reproductive organs (ovary, corpus uteri, prostate, and testis) have been continuously increasing. In both sexes combined, breast (especially for women) and kidney cancers displayed initial rapid increases and then lessened increases after 2008 and 2009, respectively. Prostate cancer demonstrated distinguished increase until 2009, followed by nonsignificant trend until 2015, and regained increasing trend thereafter. The remaining cancers with increasing trend revealed steady increases throughout the entire period. On the other hand, the incidences of colorectal and bladder cancers demonstrated increasing trends that have recently reversed significantly, with decreases starting in 2011 and 2004, respectively. In contrast, stomach and liver cancers demonstrated initial moderate decreasing trends until 2011 and 2010, respectively, followed by more rapid decreases thereafter; and cervical cancer showed marked decrease until 2007, however it showed lessened decrease thereafter until now. Lastly, the incidence of thyroid cancer increased significantly between 1999 and 2011, decreased significantly between 2011 and 2016, and increased again from 2016 without statistical significance (Table 5). These trends were observed similarly in both men and women, except for breast cancer in men and bladder cancer in women that revealed partially different results of trends from those described above. In men, decreasing trend of stomach, lung, and liver cancer throughout the period and colorectal cancer since 2011 were significant while prostate and kidney cancer had an increasing trend. In women, stomach, colorectal, liver, and cervix cancer had decreasing trend while breast and lung cancer revealed an increasing trend. The characteristic trend of thyroid cancer which changed rapidly in a short period of time, was more pronounced in women than in men (Fig. 4, S1 and S2 Tables).
The ASRs for mortality in most cancers have shown decreasing trends in Korea. Stomach cancer revealed continuous decreasing trends throughout the entire observed period for mortality, with more pronounced decreasing slopes in more recent periods. Liver and lung cancer mortality rates began to decrease in 2002 and 2001, respectively, followed by further rapid decreases starting in 2014 and 2013, respectively. On the other hand, the mortality rates of colorectal, cervical, and thyroid cancers initially increased significantly until 2003; since then, the mortality rate from these cancers significantly decreased (Table 5). These trends were observed similarly in both sexes. However, breast cancer in women displayed significantly increasing mortality trends throughout the entire observed period, with less increasing trend after 2005 (Fig. 5, S1 and S2 Tables).
4. Survival rates
Over the past two decades, when cancer survival statistics have been compiled, the relative survival rates of cancer patients have increased significantly and steadily. The 5-year relative survival rates for all patients diagnosed with cancer in the recent 5 years, from 2016 to 2020 were 71.5% in both sexes; 65.5% in men and 77.8% in women (Table 6). The temporal increasing trends in survival rates, from 42.9% in 1993–1995 to 71.5% in 2016–2020, were maintained even after excluding thyroid cancer (from 41.2% in 1993–1995 to 67.3% in 2016–2020), which has an excellent prognosis with a 5-year relative survival rate of 100%.
After thyroid cancer, survival rates were the highest for testis and prostate cancers in men (96.5% and 95.2%, respectively) and breast cancer in women (93.8%). On the contrary, the survival rates were the lowest for cancers of the pancreas (15.2%), and gallbladder plus other and unspecified parts of the biliary tract (29.0%) in both sexes. Stomach cancer (both sexes), prostate cancer (men), lung cancer, and leukemia (women) were associated with outstanding improvements in survival rates over the observed period. In contrast, advances have been slow for cancers of the brain and CNS, pancreas in both sexes.
In terms of stage distribution at diagnosis and recent survival rates according to the SEER summary stage in each cancer, Fig. 6 shows the top 10 most common cancers for each sex in 2020. In men, kidney, stomach, and bladder cancers revealed the highest proportions of patients who were diagnosed at the localized stage (72.9%, 64.7%, and 71.9%, respectively), accompanied by the 5-year survival rates of 98.4%, 98.2%, and 86.2%, respectively. In contrast, lung and pancreatic cancers demonstrated the highest proportions of patients diagnosed at the distant metastatic stage, which approximated to 50%, with corresponding 5-year survival rates of 8.8% and 2.5%, respectively. In women, 59.1%, 72.1%, and 63.5% of breast, uterine corpus, and stomach cancers, respectively, were diagnosed at the localized stage, with 5-year survival rates of 99.0%, 96.8%, and 96.0%, respectively. However, more than 40% of lung and pancreatic cancers were diagnosed at the distant metastatic stage, with 5-year survival rates of 17.8% and 2.4%, respectively.
5. Prevalence rates
The total prevalent cancer cases in 2020 (identified as survivor at the time of January 1, 2021) were 2,276,792, surpassing 2 million since 2018 (Table 1). It suggested that one in 23 people (4.4% of the entire Korean population; 3.9% of men and 5.0% of women) has a history of being diagnosed with cancer. Of these, 1,090,322 (47.9% of all prevalent cases) were aged ≥ 65 years, indicating that one in seven people in that age group (16.8% of, or one in six, men and 10.8% of, or one in nine, women) would have experienced cancer (data not shown).
Table 7 provides the CRs and ASRs of prevalence for all cancers combined and for specific cancers. In total, the cancer prevalence rate for 2020 in Korea was 4,433.9 per 100,000 people. Thyroid cancer had the highest prevalence (CR, 953.6 per 100,000; 357.5 per 100,000 for men and 1,546.6 per 100,000 for women), followed by stomach cancer (CR, 643.1 per 100,000) and colorectal cancer (CR, 569.8 per 100,000). Prostate cancer in men and breast cancer in women revealed the highest prevalence rates (CR, 470.3 and 1,083.6 per 100,000, respectively).
The number of prevalent cases for common cancers, according to the time since cancer diagnosis, are described in Fig. 7. In total, 1,368,140 (60.1% of all prevalent cases) had survived > 5 years after cancer diagnosis, majority of them being survivors of thyroid, stomach, colorectal, and breast cancers. Another 487,192 (21.4% of all prevalent cases) have been alive 2–5 years after their cancer diagnosis, in which period they need regular follow-up; and the rest were 421,460 (18.5% of all prevalent cases) for whom it had been < 2 years since their cancer diagnosis, in which period they still need active cancer treatment.
Conclusion
Compared to 2019, the number of new cancer diagnoses in 2020 decreased due to the impact of the COVID-19 pandemic. Except for 2020, the number of new cancer patients in Korea has been increasing since 2015, but the ASRs of incidence did not reveal a significant change. During the past decade, the incidence of stomach, colorectal, liver, and cervical cancer has been declining while that of prostate and breast cancer have been on the rise since 1999. Thyroid cancer, which has decreased since 2012, has shown an increasing trend since 2015. The 5-year relative survival rate of cancer patients diagnosed in the past 5 years was 71.5%, which is steadily improving. Since 2018, the number of cancer survivors has exceeded 2 million, of which 60.1% are those who survived over 5 years. As the number of newly diagnosed cancer patients, cancer survival rates and cancer prevalence continue to increase, national cancer control strategies must be planned and implemented to keep pace with these changing cancer statistics. In addition, the impact of the COVID-19 pandemic on cancer diagnosis and treatment should be evaluated in further studies.