| Home | E-Submission | Sitemap | Contact Us |  
top_img
Cancer Research and Treatment > Volume 51(4); 2019 > Article
Sun, Liu, Liu, Chen, Guo, Wen, Liu, Xie, Tang, Liang, Li, Yan, Hong, Ma, Tang, and Mai: Patterns of Failure and Survival Trends in 3,808 Patients with Stage II Nasopharyngeal Carcinoma Diagnosed from 1990 to 2012: A Large-Scale Retrospective Cohort Study

Abstract

Purpose

The purpose of this study was to investigate the survival trends and patterns of failure in patients with stage II nasopharyngeal carcinoma (NPC) treated with radiotherapy (RT) and chemotherapy over the last 20 years.

Materials and Methods

Thirty-eight hundred and eight patients diagnosed with stage II NPC between January 1990 and December 2012 were involved in this retrospective cohort study. All patients were treated with RT. According to the main imaging techniques and RT technology, we categorized these patients into four calendar periods: 1990-1996, 1997-2002, 2003-2007, and 2008-2012. Overall survival (OS), progression-free survival (PFS), locoregional relapse-free survival (LRFS), and distant metastasis–free survival (DMFS) were served as the clinical outcome.

Results

After a median follow-up period of 84.7 months, we observed increasing trends in survival and disease control. The 3- and 5-year OS rates increased from 87.1% and 78.7% in the first calendar period to 97.4% and 94.5% in the last calendar period, respectively (p<0.001). Additionally, significant increasing trends could be seen in the PFS and LRFS during the four calendar periods. In the subgroup analysis, the LRFS in patients older than 50 years at diagnosis showed greater improvement than younger patients. However, the rate of distant metastasis was stable and relatively low, as the 5-year DMFS ranged from 90.5% to 94.7% among the four calendar periods.

Conclusion

The survival rates in patients with stage II NPC showed increasing trends from 1990 to 2012. The advance of RT provided excellent locoregional control and enhanced OS.

Introduction

Nasopharyngeal carcinoma (NPC) is a malignant head and neck cancer with an unbalanced global distribution [1]. The highest incidences are observed in Southern China and Southeast Asia with a peak incidence of 50 cases per 100,000 [2]. Early lymphatic spread and high preference of distant metastasis is the natural behavior of an NPC [3]. In the early stage, the treatment of NPC mostly relies on radiotherapy (RT).
RT has been established as the primary treatment for NPC since 1965. Ever since, with the improvement of RT techniques and target volume delineation, the main RT method evolved from 2-dimensional conventional radiotherapy (2DCRT) to 3-dimensional conformal technique (3DRT), and now to intensity-modulated radiotherapy (IMRT) has made it possible to tailor the dose distribution to tumor volume. Meanwhile, owing to the low dose distribution to normal tissues, organs at risk such as brainstem, spinal cord, and optic chiasma can be better protected. It has been previously reported that overall survival (OS) has been improved in patients with NPC in the last two decades [4-8]. The 5-year OS rate was increased from 50% (1954-1992) to 77% (1990-1999) and then to 85% (2000-2010). Several factors contributed to the increase of survival outcome such as the use of IMRT, development of imaging technology and RT planning [9-12], use of more effective chemotherapy [13], progress in the management of NPC and better supportive care of patients.
As the RT technique has improved in the last 20 years, we investigated the failure pattern and trend of survival and disease control in patients with stage II NPC in this period of time. Several studies have explored the change of prognosis of NPC patients with the development of the RT method. However, it was difficult to identify the significant difference in survival trends because of the small sample or short-term follow-up [14-17]. Thus, in order to identify the failure patterns and trends of survival in patients diagnosed with stage II NPC, we conducted a large-scale retrospective analysis, which covered 3,808 patients with stage II NPC, diagnosed in 1990-2012.

Materials and Methods

1. Patient population

From 1990 to 2012, all the patients were restaged according to the seventh American Joint Committee on Cancer TNM staging manual [18]. Finally, 3,808 patients diagnosed with stage II NPC in our institute were included in this study. The eligibility criteria were as follows: (1) histopathologically confirmed NPC; (2) age ≥ 18 years; (3) received RT treatment; (4) radiologically measurable disease; (5) Karnofsky performance score > 60; (6) absence of pregnancy, lactation, and other malignant disease; and (7) normal renal and liver function. All patients were evaluated by a complete physical examination, head and neck computed tomography (CT)/magnetic resonance imaging (MRI), chest radiograph, abdominal sonography, electrocardiography, nasopharyngoscopy, bone scan, or positron emission tomography computed tomography (PET-CT), and complete blood test including differential cell counts and biochemical profile. Other patient information such as sex, age, hereditary NPC, smoking status, and information on concurrent disease (e.g., diabetes mellitus [DM]) was also collected after the pretreatment evaluations.

2. Treatment

All eligible patients were treated with RT based on the treatment principle for NPC patients at Sun Yat-sen University Cancer Center. In 2002 or earlier, the main RT method was 2DCRT; 3DRT/2-dimensional conformal technique with computed tomography simulator (CT-SIM)/IMRT was increasingly used since 2003. A total dose of 66-72 Gy at about 2 Gy per fraction was prescribed to planning target volume 5 daily fractions per week. These types of RT techniques and the design of the IMRT plan were reported in previous studies [19,20]. In all, 820 patients underwent at least one cycle of cisplatin-based chemotherapy; of these, 490 patients received concurrent chemoradiotherapy (CCRT), 260 patients received induction chemotherapy (IC)+RT, and 70 patients received IC+CCRT.

3. Follow-up and outcomes

After the completion of treatment, patients were evaluated at least once every 3 months during the first 3 years and every 6 months thereafter until death. We conducted a complete physical examination of the patient at each follow-up visit. Nasopharyngoscopy, CT, MRI of the head and neck, chest radiography, abdominal sonography, bone scan or PET-CT were performed when tumor relapse occurred. Biopsy was used to confirm malignancy for patients with recurrent local or suspected residual disease.

4. Statistics

The primary study endpoint was OS, defined as the period from the date of treatment to the date of death from any cause. Then, we calculated the following parameters: progression-free survival (PFS), defined as the time from the date of treatment to the date of relapse at any site or death from any cause; locoregional relapse–free survival (LRFS), defined as the time from date of treatment to the date of local/regional relapse; and distant metastasis–free survival (DMFS), defined as the time from date of treatment to the date of distant metastasis. Statistical analysis was performed using SPSS package for Mac ver. 21.0 (IBM Corp., Armonk, NY). Relationship between the calendar periods and clinical characteristics of NPC was evaluated by the chi-square test. Kaplan-Meier survival curves were used to estimate patient survival, and survival rates were compared using the log-rank test. A Cox proportional hazard model was used to perform multivariate analyses involving the following variables: age, sex, T category, N category, smoking status, DM, family history of NPC, type of treatment, and RT technique. All analyses were two-sided. The level of significance was set at p < 0.05.

5. Ethical statement

This study was approved by the Research Ethics Committee of the Sun Yat-sen University Cancer Center, China and performed in accordance with the principles of the Declaration of Helsinki. Written informed consents were obtained.

Results

1. Patient characteristics

A total of 3,808 consecutive patients (2,730 male and 1,078 female) with stage II NPC who received treatment between January 1990 and December 2012 at Sun Yat-sen University Cancer Center (median age, 46 years; range, 18 to 93 years) were enrolled. No significant differences were observed with respect to age and sex among patients in the four calendar periods (Table 1). However, there were significant differences for the clinical stage, RT technique, image technique, type of treatment, viral capsid antigen IgA, early antigen IgA, smoking, DM, and family history of NPC (p < 0.05). As shown in Table 1, the incidence of NPC patients with diabetes showed an increasing trend, while the incidence of NPC patients with smoking showed a decreased trend during the four calendar periods. In addition, an increasing number of patients underwent cisplatin-based chemotherapy after 2003.

2. Survival

The median follow-up period for the entire patient cohort was 84.7 months (range, 1 to 290 months). The details of the 3-, 5-, 7-, 10-, 15-, and 20-year OS, PFS, LRFS, and DMFS rates in the four calendar periods are illustrated in Table 2. With regard to OS, the 3-year and 5-year OS rate increased from 87.1% and 78.7% in the first period to 97.4% and 94.5%, respectively, in the last calendar period. The 7- and 10-year OS rates also showed an increasing trend (except that there was no data on the 7- and 10-year OS rate for the period from 2008 to 2012). By 2007, the 7- and 10-year OS rate was up to 88.4% and 83.0%, respectively. The increasing trends of the 3-, 5-, 7-, and 10-year OS rates were statistically significant in patients diagnosed before and after 2003. Similar results were found in the 3-, 5-, 7-, and 10-year PFS rates and LRFS rates. However, regarding the DMFS rate, the 3-, 5-, 7-, and 10-year DMFS rates remained high (ranging from 87.6% to 96%) during the four calendar periods, which indicated a low distant metastasis rate for stage II NPC patients. We also found that the lowest DMFS rate was in the period 1997-2002, and a small percentage of patients were treated with chemotherapy during this calendar period.
As shown in Table 3, the distant relapse rate decreased from 6.8% in the first period to 3.4% in the last calendar period, while the local relapse and regional relapse rates decreased from 19.6% and 12.2% in the first period to 1.7% and 1.2% in the last calendar period. From the statistics above, we found that the main pattern of treatment failure of NPC is the change from recurrence to distant metastasis.
The OS, PFS, LRFS, and DMFS curves of patients with stage II NPC diagnosed in the four calendar periods are shown in Fig. 1A-D. We found that there was a remarkable improvement in OS, PFS, and LRFS of the patients diagnosed in 2003-2007 and 2008-2012, compared with those diagnosed in 1990-1996 and 1997-2002, which showed that the differences of OS, PFS, and LRFS in patients among the four calendar periods were statistically significant (p < 0.001). Even though the difference of DMFS in patients among the four calendar periods was statistically significant (p=0.001), the DMFS curves of the patients diagnosed in 1990-1996, 2003-2007, and 2008-2012 were superimposable. In addition, we found that there was a remarkable improvement in DMFS of those patients diagnosed in 1990-1996, 2003-2007, and 2008-2012, compared with those diagnosed in 1997-2002.
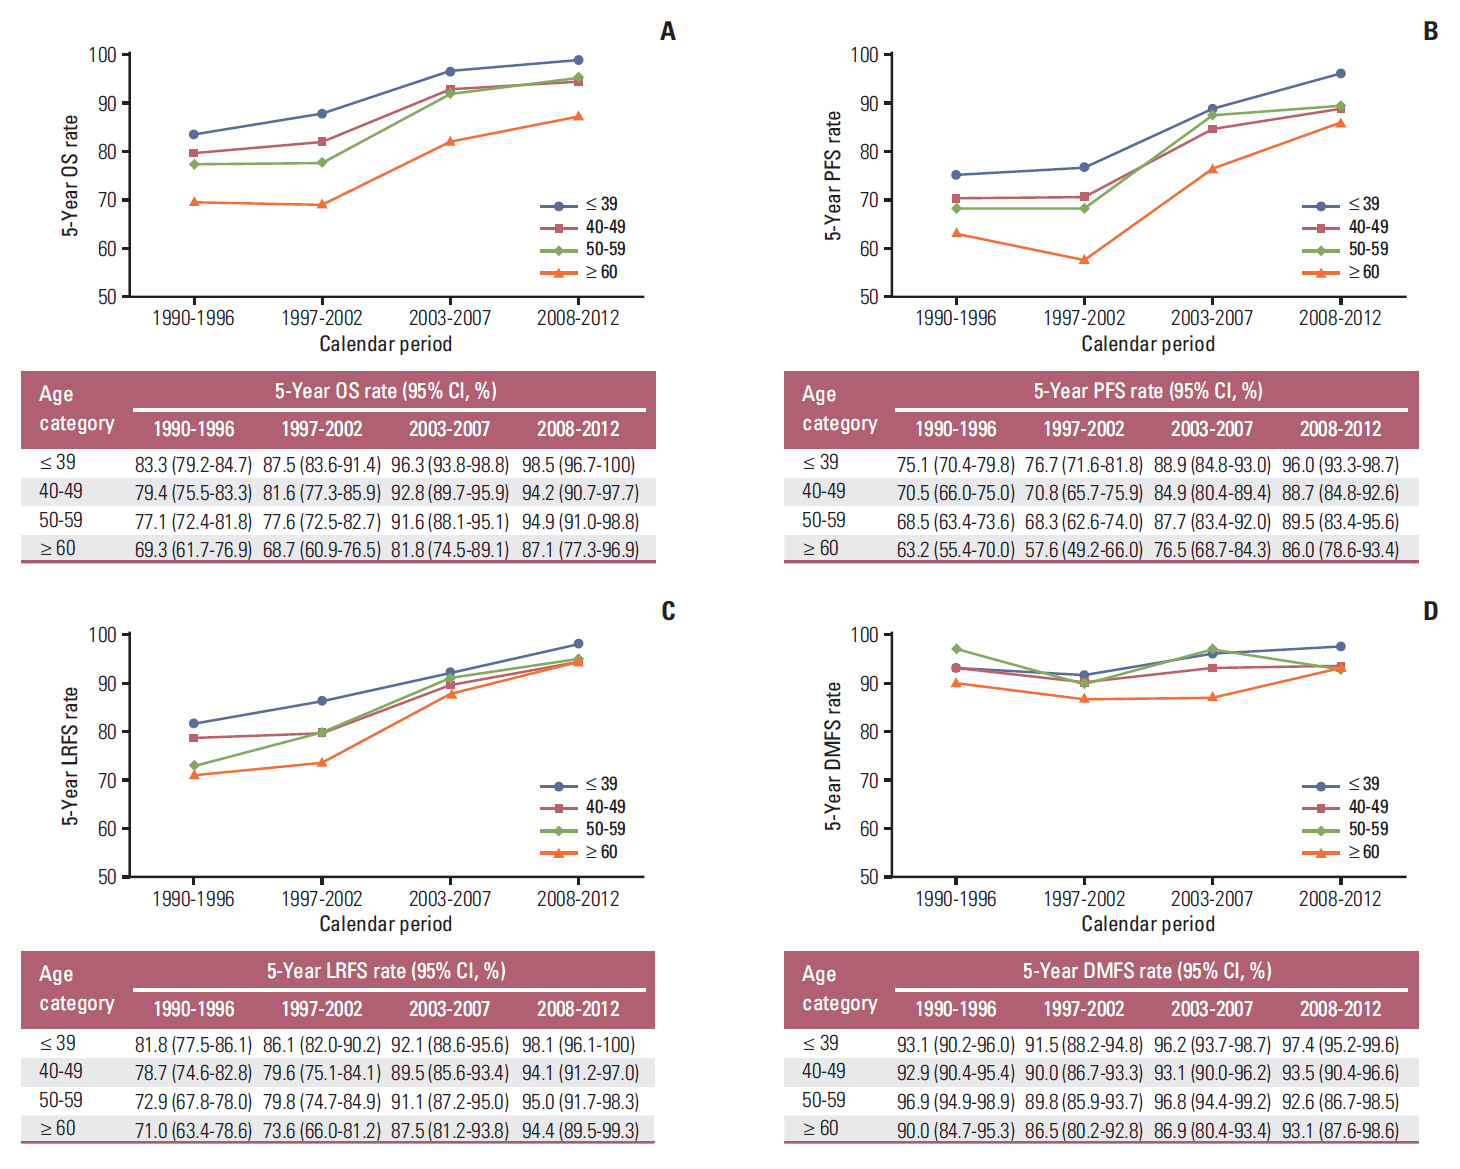
The 5-year OS, PFS, LRFS, and DMFS rates of the four calendar periods subdivided by age-layers are shown in Fig. 2A-D. The 5-year OS, LRFS, and PFS rate of patients in all four age categories showed a rising trend (Fig. 2A-C). Interestingly, this increasing trend of LRFS rate was, in particular, most obvious in patients in the age categories of 50-59 and ≥ 60 years (Fig. 2C). Fig. 2D shows that the 5-year DMFS rate, regardless of age categories and calendar periods, remained stable and relatively high.
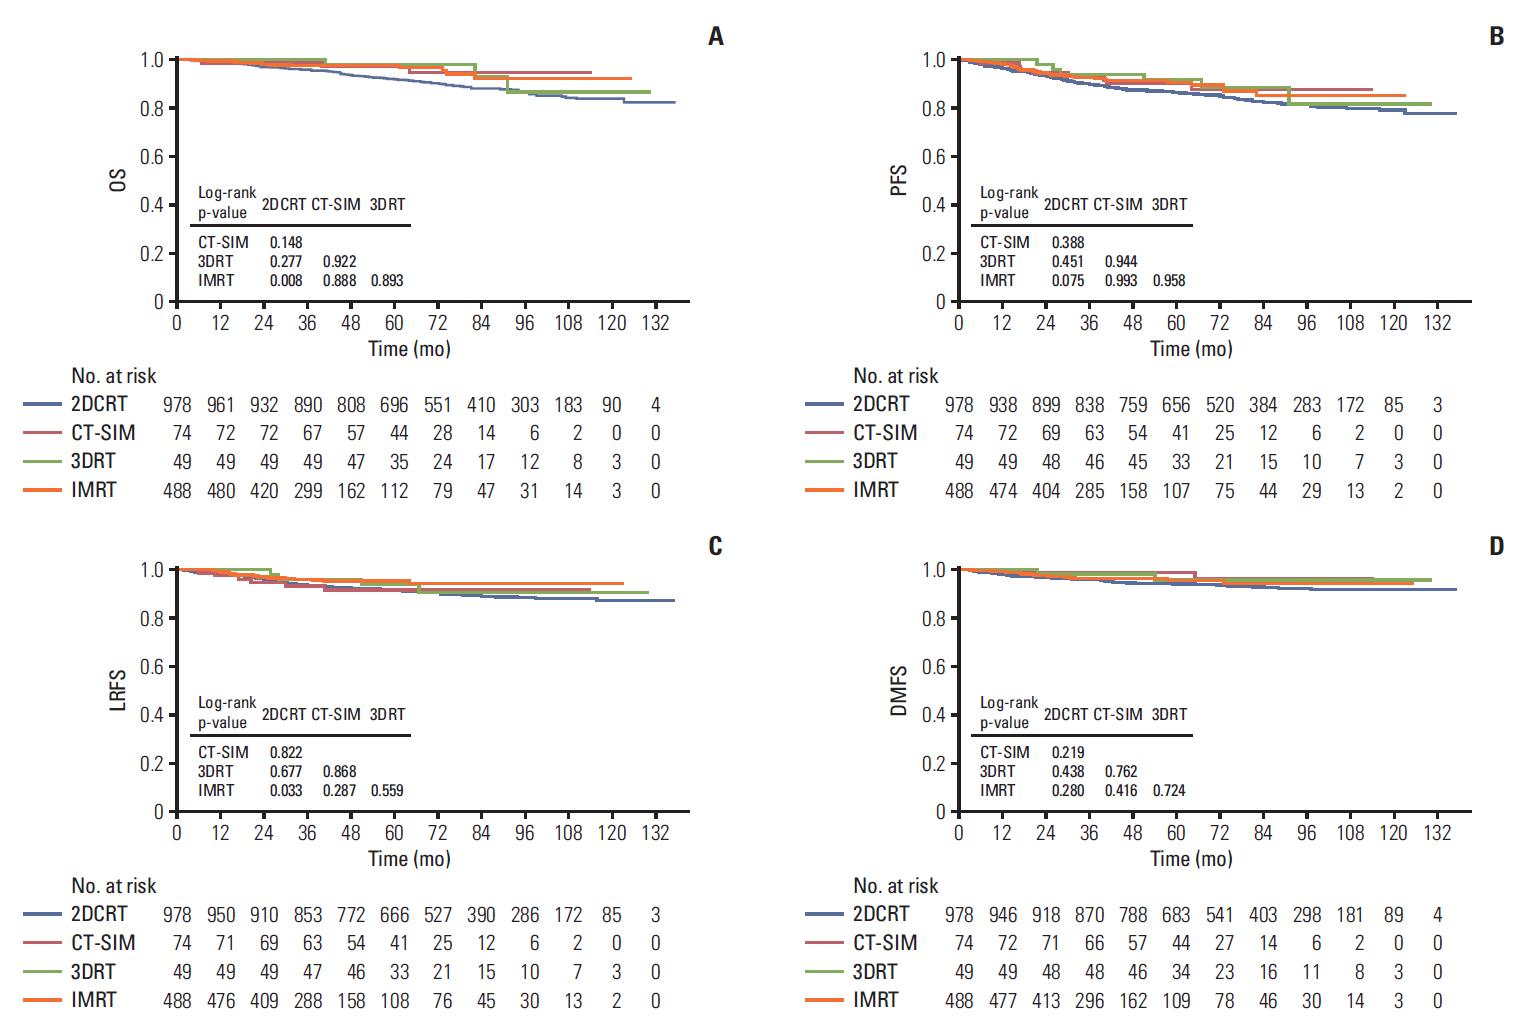
Recent studies have shown that the evolution of RT provided excellent locoregional control and enhanced OS in patients with NPC. To further assess the prognostic value of the RT technique in stage II NPC patients, 3,808 patients were divided into four groups, based on RT techniques. As shown in Fig. 3A-D, a remarkable improvement was seen in OS, PFS, and LRFS of patients treated with CT-SIM/3DRT/IMRT, compared with those treated with 2DCRT, suggesting that the differences were statistically significant (p < 0.001), except for the DMFS (p=0.227). From the survival curves, we also found that the highest LRFS rate was in the cohort of the IMRT arms. This result indicated that IMRT improved locoregional control thanks to the evolution of RT technique. As almost all patients received 2DCRT before 2003, we further analyzed the patients’ survival in the different RT method arms during 2003-2012 to avoid the potential bias, in which we found OS and LRFS were still higher in IMRT arm than 2DCRT. However, no significant difference was found in PFS and DMFS (Fig. 4A-D).
Grouped by the treatment method, the differences in OS, PFS, and LRFS between the RT-alone and RT+chemotherapy group were significant except for DMFS (p < 0.001, p < 0.001, p < 0.001, and p=0.850, respectively) (Fig. 5A-D). Table 4 shows OS, PFS, LRFS, and DMFS at 3, 5, 7, 10, 15, and 20 years in the two groups. OS was higher for patients in the RT+ chemotherapy group than for patients in the RT-alone group at each time point. Similar results were found for PFS and LRFS, but there was no significant difference for DMFS.
A multivariate Cox proportional hazards model was generated that incorporated the following variables: age, sex, T category, N category, smoking, DM, family history of NPC, type of treatment, and RT technique. After adjusting for a variety of risk factors, age, sex, T category, N category, smoking, family history of NPC, type of treatment and RT technique remained independent prognostic factors for OS. Multivariate analysis also showed that age, sex, T category, N category, family history of NPC, type of treatment, and RT technique were significantly associated with PFS; while, age, T category, N category, type of treatment, and RT technique remained independent prognostic factors for LRFS. As for DMFS, only age, sex, and N category remained independent prognostic factors (Table 5).

Discussion

The treatment of stage II NPC has mostly relied on RT. With the development of RT technique and target volume delineation, the RT method evolved from 2DCRT to IMRT and the CT-SIM and 3DRT belong to the intergradation. In this study, we aimed to assess the change of clinical outcome in patients diagnosed with stage II NPC in light of the evolution in RT methods. According to the development of image techniques and RT technology, patients were categorized into four calendar periods. To our best knowledge, this is the first large-scale cohort study with 3,808 patients and a relatively long-term follow-up of > 20 years. It was encouraging to see that the prognosis of patients with stage II NPC showed significant improvements in the last two decades in terms of OS, PFS, and LRFS, but not so with respect to DMFS.
The OS rate of patients was much higher since 2003 than before. The 5-year OS rate was 78.7%, 80.2%, 92%, and 94.5%, respectively, in the four calendar periods. This change is in accordance with the evolution of the RT method. As seen in Fig. 3, patients in the CT-SIM/3DRT/IMRT arm showed more satisfactory clinical outcome than those in the 2DCRT arm. Previous reports also suggested that patients benefited from the evolution of RT technique [5,8,10,14-17]. Other factors may contribute to the result, such as the application of more effective chemotherapy [3,21]; salvage treatments including reirradiation [22] and surgery after relapse; advances in imaging technology; and supportive care improvement.
In terms of LRFS, the survival trends were obviously different in the last 20 years. The 5-year LRFS rate was 77.3%, 80.8%, 90.4%, and 95.4%, respectively, in the four calendar periods. We considered that the gradual performance of IMRT contributes to the improvement of locoregional control. As shown in Fig. 3, a remarkable improvement in patients’ LRFS was shown in the analysis on survival comparison between the 2DCRT arm and the IMRT arm during the entire study period from 1990 to 2012, which was likely because of the more satisfactory dose distribution covering the tumor target area and the higher radiation dose administered in IMRT than 2DCRT methods. Other studies also reported similar results that the IMRT changed the locoregional failure of the early-stage NPC [8,23-25].
Although the locoregional failure rate was controlled through the evolution of the RT method, we did not achieve the same improvement trend for survival according to DMFS. As shown in Table 2, the 5-year DMFS rate was lowest in the period 1997-2002 (90.5%) and was similar in the other three calendar periods (93.8%, 94.7%, and 94.3% in 1990-1996, 2003-2007, and 2008-2012, respectively). The 5-year DMFS rate was higher in the first period than the second period, which is different from other survival indicators. The possible attributing factors include (1) more accurate imaging techniques such as with the advent of MRI, bone scan, and PET-CT that definitely allow more accurate detection of metastatic lesions, which may have been neglected in the period from 1990 to 1996; (2) the high recurrence rate and unsatisfactory salvage treatment partly contributed to patient mortality prior to the occurrence of distant metastasis; and (3) the application of chemotherapy was considered as the protective factor for distant metastasis among II stage NPC [26]. Meanwhile, a smaller percentage of patients treated with chemotherapy during this calendar period, which may be another reason for the higher metastatic rate. Furthermore, we found that distant relapse decreased from 6.8% in the first period to 3.4% in the last calendar period, while the local relapse and regional relapse decreased from 19.6% and 12.2% in the first period to 1.7% and 1.2% in the last calendar period, respectively. That is to say, in the early (1990-2002) era, local and regional recurrence was the main pattern of treatment failure, which was changed in the later period, in that distant metastasis became the most important factor leading to treatment failure.
According to previous studies, the application of chemotherapy was a protective factor for II stage NPC patients. Kang et al. [27] observed that concurrent treatment with 5-fluorouracil and cisplatin improved PFS and LRFS at 5 years significantly in patients with stage II NPC. Here, we evaluated the role of chemotherapy in 3,808 patients with stage II NPC treated with a longer median follow-up (84.7 months). All the potential prognostic factors were considered in multivariate analysis. Similarly, we found that application of chemotherapy benefited patients significantly in terms of OS, LRFS, and PFS, whereas DMFS was comparable between the two arms. These data supported the view that chemotherapy helps to control local disease and achieve long-term survival in stage II NPC.
Age is another important prognostic factor in NPC patients [28,29]. To explore the survival change of patients in different age groups, we divided our patients into four subgroups (≤ 39, 40-40, 50-59, and ≥ 60 years). In patients diagnosed with stage II NPC, the OS, PFS, and LRFS rates showed increasing trends in all age groups. In terms of OS, we could see that the 5-year OS rate was increased by 15%-18% in all of the age groups. In the same calendar period, patients in the younger age group revealed higher survival rate. Similarly, the 5-year LRFS rate of patients with NPC stage II in all age groups increased over time owing to advanced techniques and better treatment, in particular among patients aged > 50 years, which achieved about 23% increase in the 5-year LRFS rates. The 5-year DMFS rates of patients in all the age groups remained stable and high among the four calendar periods, ranging from 87% to 97%.
We acknowledge that our study has some limitations. First, the data were collected from a single institution, and the results should therefore be validated by multi-centric clinical study. Second, it was challenging to update accurate data about the late RT-toxicities as time passed by, so we were unable to compare the rates of the side effects of RT in the different calendar periods. Third, only patients with stage II NPC were included in the discussion, so this study cannot fully reflect the prognostic tendencies and failure patterns of other stages of NPC. Nevertheless, we believe our results are promising from the treatment progress of stage II NPC in the last 20 years. This has encouraged us to conduct further studies on patients with local-advanced NPC, which are presently ongoing with interesting and encouraging results.

Conflicts of Interest

Conflict of interest relevant to this article was not reported.

Acknowledgments

This work was supported by grants from the National Key R&D Program of China (2016YFC0902003, 2017YFC1309003, 2017YFC09-08500), the National Natural Science Foundation of China (No. 8142-5018, No. 81672868, No. 81602371), the Sun Yat-Sen University Clinical Research 5010 Program (201707020039, 2014A020212103, 16zxyc02), the Sci-Tech Project Foundation of Guangzhou City (201-707020039), the National Key Basic Research Program of China (No. 2013CB910304), the Special Support Plan of Guangdong Province (No. 2014TX01R145), the Sci-Tech Project Foundation of Guangdong Province (No. 2014A020212103), the Health & Medical Collaborative Innovation Project of Guangzhou City (No. 201400000001), the National Science & Technology Pillar Program during the Twelfth Five-year Plan Period (No. 2014BAI09B10), the PhD Start-up Fund of Natural Science Foundation of Guangdong Province, China (201-6A030310221), the cultivation foundation for the junior teachers in Sun Yat Sen University (16ykpy28), the foundation for major project and new cross subject in Sun Yat Sen University (16ykjc38) and the Fundamental Research Funds for the Central Universities Fundamental Research Funds for the Central Universities.

Fig. 1.
Kaplan-Meier survival curves for the four calendar periods in the study population. Overall survival (OS) (A), progression-free survival (PFS) (B), locoregional relapse-free survival (LRFS) (C), and distant metastasis-free survival (DMFS) (D) compared across the entire cohort of stage II nasopharyngeal carcinoma patients. p-values were calculated using the unadjusted log-rank test.
crt-2018-688f1.jpg
Fig. 2.
The 5-year survival rates for the four age subgroups in the four calendar periods. The 5-year overall survival (OS) rate (A), progression-free survival (PFS) rate (B), locoregional relapse-free survival (LRFS) rate (C), and distant metastasis-free survival (DMFS) rate (D) are shown in different age subgroups in the 1990-1996, 1997-2002, 2003-2007, and 2008-2012 periods.
crt-2018-688f2.jpg
Fig. 3.
Kaplan-Meier survival curves for the four radiotherapy techniques in the study population. Overall survival (OS) (A), progression-free survival (PFS) (B), locoregional relapse-free survival (LRFS) (C), and distant metastasis-free survival (DMFS) (D) compared across the entire cohort of stage II nasopharyngeal carcinoma patients. p-values were calculated using the unadjusted log-rank test. 2DCRT, two-dimensional conventional radiotherapy; CT-SIM, computed tomography simulator; 3DRT, three-dimensional conformal radiotherapy; IMRT, intensity-modulated radiotherapy.
crt-2018-688f3.jpg
Fig. 4.
Kaplan-Meier survival curves for the four radiotherapy techniques in our study. Overall survival (OS) (A), progression-free survival (PFS) (B), locoregional relapse-free survival (LRFS) (C), and distant metastasis-free survival (DMFS) (D) compared across the stage II nasopharyngeal carcinoma patients from 2003-2012. p-values were calculated using the unadjusted log-rank test. 2DCRT, two-dimensional conventional radiotherapy; CT-SIM, computed tomography simulator; 3DRT, three-dimensional conformal radiotherapy; IMRT, intensity-modulated radiotherapy.
crt-2018-688f4.jpg
Fig. 5.
Kaplan-Meier survival curves for the different treatment methods in our study. Overall survival (OS) (A), progression-free survival (PFS) (B), locoregional relapse-free survival (LRFS) (C), and distant metastasis-free survival (DMFS) (D) compared across the entire cohort of stage II nasopharyngeal carcinoma patients. p-values were calculated using the unadjusted log-rank test. RT, radiotherapy; CT, computed tomography.
crt-2018-688f5.jpg
Table 1.
Patient demographics and clinical characteristics
Characteristic Total 1990-1996 1997-2002 2003-2007 2008-2012 p-value
Age (yr)
 ≤ 39 1,038 (27.3) 327 (28.2) 281 (28.2) 221 (27.0) 209 (27.2) 0.325
 40-49 1,278 (33.6) 423 (34.6) 321 (32.2) 255 (31.1) 279 (36.3)
 50-59 990 (26.0) 323 (26.4) 258 (25.9) 232 (28.3) 177 (23.0)
 ≥ 60 502 (13.2) 149 (12.2) 137 (13.7) 1,112 (13.7) 104 (13.5)
Sex
 Female 1,078 (28.3) 348 (28.5) 292 (29.3) 211 (25.7) 227 (29.5) 0.293
 Male 2,730 (71.7) 874 (71.5) 705 (70.7) 609 (74.3) 542 (70.5)
T category
 T1 659 (17.3) 220 (18.0) 139 (13.9) 138 (16.8) 162 (21.1) 0.001
 T2 3,149 (82.7) 1,002 (82.0) 858 (86.1) 682 (83.2) 607 (78.9)
N category
 N0 1,364 (35.8) 453 (37.1) 400 (40.1) 280 (34.1) 231 (30.0) < 0.001
 N1 2,444 (64.2) 796 (62.9) 597 (59.9) 540 (65.9) 538 (70.0)
Radiotherapy technique
 2DCRT 3,181 (83.5) 1,222 (100) 981 (98.4) 680 (82.9) 298 (38.8) < 0.001
 CT-SIMa) 74 (1.9) 0 0 33 (4.0) 41 (5.3)
 3DRT 57 (1.5) 0 8 (0.8) 22 (2.7) 27 (3.5)
 IMRT 496 (13) 0 8 (0.8) 85 (10.4) 403 (52.4)
Image technique
 CT 2,319 (60.9) 1,222 (100) 939 (94.2) 151 (18.4) 7 (0.9) < 0.001
 MRI 1,356 (35.6) 0 58 (5.8) 638 (77.8) 660 (85.8)
 PET-CT+MRI 133 (3.5) 0 0 31 (3.8) 102 (13.3)
Type of treatment
 RT 2,988 (78.5) 1,084 (88.7) 925 (92.8) 587 (71.6) 392 (51.0) < 0.001
 CRT 820 (21.5) 138 (11.3) 72 (7.2) 233 (28.4) 377 (49.0)
VCA-IgAb)
 ≥ 1:160 1,776 (50.3) 606 (57.5) 554 (60.5) 333 (42.0) 283 (36.8) < 0.001
 < 1:160 1,754 (49.7) 447 (42.5) 362 (39.5) 460 (58.0) 485 (63.2)
EA-IgAb)
 ≥ 1:10 2,299 (65.1) 586 (55.7) 678 (74.0) 565 (71.2) 470 (61.2) < 0.001
 < 1:10 1,231 (34.9) 467 (44.3) 238 (26.0) 228 (28.8) 298 (38.8)
Smoking
 No 2,211 (58.1) 648 (53.0) 588 (59.0) 468 (57.1) 507 (65.9) < 0.001
 Yes 1,597 (41.9) 574 (47.0) 409 (41.0) 352 (42.9) 262 (34.1)
Diabetes mellitus
 No 3,722 (97.7) 1,217 (99.6) 990 (99.3) 797 (97.2) 718 (93.4) < 0.001
 Yes 86 (2.3) 5 (0.4) 7 (0.7) 23 (2.8) 51 (6.6)
Family history of NPC
 No 3,385 (88.9) 1,138 (93.1) 875 (87.8) 706 (86.1) 666 (86.6) < 0.001
 Yes 423 (11.1) 84 (6.9) 122 (12.2) 114 (13.9) 103 (13.4)
 Total 3,808 (100) 1,222 (32.1) 997 (26.2) 820 (21.5) 769 (20.2)

Values are presented as number (%). p-value was calculated with the Pearson chi-square test. 2DCRT, two-dimensional conventional radiotherapy; CT-SIM, computed tomography simulator; 3DRT, three-dimensional conformal radiotherapy; IMRT, intensity-modulated radiotherapy; CT, computed tomography; MRI, magnetic resonance imaging; PET, positron emission computer tomography; RT, radiotherapy; CRT, chemoradiotherapy; VCA, viral capsid antigen; EA, early antigen; NPC, nasopharyngeal carcinoma.

a) 2DRT planed with CT-SIM,

b) The VCA-IgA and EA-IgA detection were not carried out for all patients.

Table 2.
Survival outcomes for the patients with stage II NPC in the four calendar periods
Survival rate (95% CI, %)
1990-1996 1997-2002 2003-2007 2008-2012
OS (yr)
 3 87.1 (85.1-89.1) 90.8 (89.0-92.6) 95.7 (94.3-97.1) 97.4 (96.2-98.6)
 5 78.7 (76.3-81.1) 80.2 (77.7-82.7) 92.0 (90.0-94.0) 94.5 (92.1-96.9)
 7 70.2 (67.7-72.7) 72.5 (69.6-75.4) 88.4 (86.0-90.8)
 10 60.5 (57.6-63.4) 63.2 (60.1-66.3) 83.0 (79.1-87.0)
 15 48.1 (45.2-51.0) 50.9 (47.0-54.8)
 20 38.4 (35.1-41.7)
PFS (yr)
 3 78.9 (76.5-81.3) 80.6 (78.1-83.1) 89.3 (87.1-91.5) 92.5 (90.5-94.5)
 5 70.3 (67.8-72.8) 70.1 (67.2-73.0) 85.8 (94.5-99.5) 90.6 (88.2-93.0)
 7 63.1 (60.4-65.8) 63.1 (60.0-66.2) 81.4 (78.7-84.1)
 10 54.3 (51.4-57.2) 56.7 (53.6-59.8) 77.2 (73.1-81.3)
 15 45.2 (42.3-48.1) 47.2 (43.5-50.9)
 20 35.8 (32.5-39.1)
LRFS (yr)
 3 84.3 (82.1-86.5) 88.3 (86.3-90.3) 92.9 (91.1-94.7) 95.6 (94.0-97.2)
 5 77.3 (75.0-79.7) 80.8 (78.3-83.3) 90.4 (88.4-92.4) 95.4 (93.8-97.0)
 7 71.9 (69.2-74.6) 76.1 (73.4-78.8) 88.0 (85.6-90.4)
 10 66.1 (63.2-69.0) 73.0 (70.1-75.9) 86.5 (83.8-89.2)
 15 61.2 (58.3-64.1) 70.8 (67.5-74.1)
 20 59.8 (56.7-62.9)
DMFS (yr)
 3 95.6 (94.4-96.8) 93.0 (91.4-94.6) 96.0 (94.6-97.4) 95.8 (94.2-97.4)
 5 93.8 (92.4-95.1) 90.5 (88.5-92.5) 94.7 (93.1-96.3) 94.3 (92.3-96.3)
 7 92.3 (90.7-93.9) 88.6 (86.4-90.8) 93.0 (91.2-94.8)
 10 91.4 (89.6-93.2) 87.6 (85.4-89.8) 92.2 (90.2-94.2)
 15 90.6 (88.6-92.6) 86.3 (83.8-88.8)
 20 89.4 (87.0-91.8)

NPC, nasopharyngeal carcinoma; CI, confidence interval; OS, overall survival; PFS, progression-free survival; LRFS, locoregional relapse-free survival; DMFS, distant metastasis-free survival.

Table 3.
Pattern of failure: the whole series and different groups
1990-1996 (n=1,222) 1997-2002 (n=997) 2003-2007 (n=820) 2008-2012 (n=769)
Local 239 (19.6) 147 (14.7) 60 (7.3) 13 (1.7)
Regional 149 (12.2) 79 (7.9) 17 (2.1) 9 (1.2)
Distant 83 (6.8) 102 (10.2) 43 (4.2) 26 (3.4)
Local+regional 12 (1.0) 10 (1.0) 5 (0.6) 1 (0.1)
Distant+local 10 (0.8) 11 (1.1) 7 (0.9) 3 (0.4)
Distant+regional 2 (0.2) 1 (0.1) 3 (0.4) 5 (0.7)
Distant+local+regional 1 (0.1) 1 (0.1) 3 (0.4) 1 (0.1)
Overall 496 (40.6) 351 (35.2) 138 (16.8) 58 (7.5)

Values are presented as number (%).

Table 4.
Survival outcomes for the patients with stage II NPC in different treatment methods
Survival rate (95% CI, %)
RT alone RT+chemotherapy
OS (yr)
 3 91.3 (90.3-92.3) 94.5 (92.9-96.1)
 5 83.6 (82.2-85.0) 88.9 (86.5-91.3)
 7 76.6 (75.0-78.2) 82.3 (79.0-85.6)
 10 67.3 (65.3-69.3) 73.0 (68.1-77.9)
 15 53.3 (50.8-55.8) 63.4 (56.9-69.9)
 20 42.4 (39.1-45.7) 55.3 (47.3-63.3)
PFS (yr)
 3 83.5 (82.1-84.9) 87.2 (84.8-89.6)
 5 75.7 (74.1-77.3) 82.0 (79.1-84.9)
 7 69.2 (67.4-71.0) 76.0 (72.5-79.5)
 10 61.6 (59.6-63.6) 68.7 (64.0-73.4)
 15 50.5 (48.1-52.9) 58.7 (52.0-65.4)
 20 40.0 (36.7-43.3) 51.9 (44-1-59.7)
LRFS (yr)
 3 88.7 (87.5-89.9) 92.2 (90.2-94.2)
 5 82.9 (81.5-84.3) 89.4 (87.0-91.8)
 7 78.4 (76.8-80.0) 85.6 (82.7-88.5)
 10 74.0 (72.2-75.8) 82.1 (78.2-86.0)
 15 69.9 (67.7-72.1) 77.0 (71.3-82.7)
 20 67.7 (65.0-70.4) 77.0 (71.3-82.7)
DMFS (yr)
 3 95.3 (94.5-96.1) 94.7 (93.1-96.3)
 5 93.4 (92.4-94.4) 92.7 (90.7-94.7)
 7 91.7 (90.5-92.9) 91.5 (89.3-93.7)
 10 90.7 (89.5-91.9) 91.0 (88.6-93.4)
 15 89.7 (88.3-91.1) 88.9 (84.2-93.6)
 20 88.1 (85.9-90.3) 88.9 (84.2-93.6)

NPC, nasopharyngeal carcinoma; CI, confidence interval; RT, radiotherapy; OS, overall survival; PFS, progression-free survival; LRFS, locoregional relapse–free survival; DMFS, distant metastasis–free survival.

Table 5.
Multivariable analysis of prognostic factors of the 3,808 patients with stage II NPC
HR (95% CI) p-value
Overall survival
 Age (yr) 1.344 (1.287-1.403) < 0.001
 Sex 1.209 (1.032-1.417) 0.019
 T category 1.237 (1.054-1.453) 0.009
 N category 1.723 (1.511-1.964) < 0.001
 Smoking 1.189 (1.039-1.360) 0.012
 Diabetes mellitus 0.922 (0.561-1.514) 0.748
 Family history of NPC 0.793 (0.646-0.974) 0.027
 Type of treatment 0.762 (0.637-0.911) 0.003
 Radiotherapy technique 0.634 (0.542-0.742) < 0.001
Progression-free survival
 Age (yr) 1.262 (1.212-1.315) < 0.001
 Sex 1.214 (1.051-1.403) 0.009
 T category 1.235 (1.063-1.434) 0.006
 N category 1.599 (1.417-1.805) < 0.001
 Smoking 1.108 (0.979-1.255) 0.104
 Diabetes mellitus 0.929 (0.602-1.435) 0.741
 Family history of NPC 0.821 (0.681-0.990) 0.039
 Type of treatment 0.800 (0.683-0.937) 0.006
 Radiotherapy technique 0.758 (0.688-0.837) < 0.001
Locoregional relapse-free survival
 Age (yr) 1.154 (1.093-1.218) < 0.001
 Sex 1.150 (0.956-1.384) 0.138
 T category 1.482 (1.202-1.828) < 0.001
 N category 1.514 (1.294-1.770) < 0.001
 Smoking 1.043 (0.886-1.227) 0.616
 Diabetes mellitus 0.605 (0.300-1.218) 0.159
 Family history of NPC 0.837 (0.657-1.067) 0.152
 Type of treatment 0.699 (0.565-0.865) 0.001
 Radiotherapy technique 0.696 (0.607-0.799) < 0.001
Distant metastasis-free survival
 Age (yr) 1.119 (1.023-1.224) 0.014
 Sex 1.495 (1.095-2.041) 0.011
 T category 1.230 (0.900-1.681) 0.194
 N category 1.732 (1.327-2.261) < 0.001
 Smoking 1.000 (0.773-1.294) 0.998
 Diabetes mellitus 1.448 (0.710-2.953) 0.308
 Family history of NPC 0.949 (0.654-1.377) 0.783
 Type of treatment 0.994 (0.739-1.337) 0.969
 Radiotherapy technique 0.891 (0.768-1.034) 0.130

A Cox proportional hazards regression model was used to detect variables. All variables were transformed into categorical variables. HRs were calculated for age (yr) (≥ 60 vs. 50-59 vs. 40-49 vs. ≤ 39); sex (male vs. female); T category (II vs. I); N category (I vs. 0); smoking (yes vs. no); diabetes mellitus (yes vs. no); family history of NPC (yes vs. no); type of treatment (CRT vs. RT); and radiotherapy technique (IMRT vs. 3DRT vs. CT-SIM vs. 2DCRT). NPC, nasopharyngeal carcinoma; HR, hazard ratio; CI, confidence interval; CRT, chemoradiotherapy; RT, radiotherapy; IMRT, intensity-modulated radiotherapy; 3DRT, three-dimensional conformal radiotherapy; CT-SIM, computed tomography simulator; 2DCRT, two-dimensional conventional radiotherapy.

References

1. Yu MC, Yuan JM. Epidemiology of nasopharyngeal carcinoma. Semin Cancer Biol. 2002;12:421–9.
crossref pmid
2. Wee JT, Ha TC, Loong SL, Qian CN. Is nasopharyngeal cancer really a "Cantonese cancer"? Chin J Cancer. 2010;29:517–26.
crossref pmid
3. Foo KF, Tan EH, Leong SS, Wee JT, Tan T, Fong KW, et al. Gemcitabine in metastatic nasopharyngeal carcinoma of the undifferentiated type. Ann Oncol. 2002;13:150–6.
crossref pmid pdf
4. Lee AW, Ng WT, Chan LL, Hung WM, Chan CC, Sze HC, et al. Evolution of treatment for nasopharyngeal cancer: success and setback in the intensity-modulated radiotherapy era. Radiother Oncol. 2014;110:377–84.
crossref pmid
5. Yi JL, Gao L, Huang XD, Li SY, Luo JW, Cai WM, et al. Nasopharyngeal carcinoma treated by radical radiotherapy alone: ten-year experience of a single institution. Int J Radiat Oncol Biol Phys. 2006;65:161–8.
crossref pmid
6. Geara FB, Sanguineti G, Tucker SL, Garden AS, Ang KK, Morrison WH, et al. Carcinoma of the nasopharynx treated by radiotherapy alone: determinants of distant metastasis and survival. Radiother Oncol. 1997;43:53–61.
crossref pmid
7. Lee AW, Poon YF, Foo W, Law SC, Cheung FK, Chan DK, et al. Retrospective analysis of 5037 patients with nasopharyngeal carcinoma treated during 1976-1985: overall survival and patterns of failure. Int J Radiat Oncol Biol Phys. 1992;23:261–70.
crossref pmid
8. Sun X, Su S, Chen C, Han F, Zhao C, Xiao W, et al. Long-term outcomes of intensity-modulated radiotherapy for 868 patients with nasopharyngeal carcinoma: an analysis of survival and treatment toxicities. Radiother Oncol. 2014;110:398–403.
crossref pmid
9. Lai V, Li X, Lee VH, Lam KO, Fong DY, Huang B, et al. Nasopharyngeal carcinoma: comparison of diffusion and perfusion characteristics between different tumour stages using intravoxel incoherent motion MR imaging. Eur Radiol. 2014;24:176–83.
crossref pmid pdf
10. Lee AW, Sze WM, Au JS, Leung SF, Leung TW, Chua DT, et al. Treatment results for nasopharyngeal carcinoma in the modern era: the Hong Kong experience. Int J Radiat Oncol Biol Phys. 2005;61:1107–16.
crossref pmid
11. Yang Z, Shi Q, Zhang Y, Pan H, Yao Z, Hu S, et al. Pretreatment (18)F-FDG uptake heterogeneity can predict survival in patients with locally advanced nasopharyngeal carcinoma: a retrospective study. Radiat Oncol. 2015;10:4.
crossref pmid pmc pdf
12. Vellayappan BA, Soon YY, Earnest A, Zhang Q, Koh WY, Tham IW, et al. Accuracy of (18)F-flurodeoxyglucose-positron emission tomography/computed tomography in the staging of newly diagnosed nasopharyngeal carcinoma: a systematic review and meta-analysis. Radiol Oncol. 2014;48:331–8.
crossref pmid pmc pdf
13. Chen YP, Wang ZX, Chen L, Liu X, Tang LL, Mao YP, et al. A Bayesian network meta-analysis comparing concurrent chemoradiotherapy followed by adjuvant chemotherapy, concurrent chemoradiotherapy alone and radiotherapy alone in patients with locoregionally advanced nasopharyngeal carcinoma. Ann Oncol. 2015;26:205–11.
crossref pmid
14. Chua DT, Sham JS, Kwong DL, Au GK. Treatment outcome after radiotherapy alone for patients with stage I-II nasopharyngeal carcinoma. Cancer. 2003;98:74–80.
crossref pmid
15. Ma J, Mai HQ, Hong MH, Cui NJ, Lu TX, Lu LX, et al. Is the 1997 AJCC staging system for nasopharyngeal carcinoma prognostically useful for Chinese patient populations? Int J Radiat Oncol Biol Phys. 2001;50:1181–9.
crossref pmid
16. Xiao WW, Han F, Lu TX, Chen CY, Huang Y, Zhao C. Treatment outcomes after radiotherapy alone for patients with early-stage nasopharyngeal carcinoma. Int J Radiat Oncol Biol Phys. 2009;74:1070–6.
crossref pmid
17. Kwong DL, Pow EH, Sham JS, McMillan AS, Leung LH, Leung WK, et al. Intensity-modulated radiotherapy for early-stage nasopharyngeal carcinoma: a prospective study on disease control and preservation of salivary function. Cancer. 2004;101:1584–93.
crossref pmid
18. Edge SB, Compton CC. The American Joint Committee on Cancer: the 7th edition of the AJCC cancer staging manual and the future of TNM. Ann Surg Oncol. 2010;17:1471–4.
crossref pmid pdf
19. Sun Y, Yu XL, Luo W, Lee AW, Wee JT, Lee N, et al. Recommendation for a contouring method and atlas of organs at risk in nasopharyngeal carcinoma patients receiving intensity-modulated radiotherapy. Radiother Oncol. 2014;110:390–7.
crossref pmid
20. Zhao C, Han F, Lu LX, Huang SM, Lin CG, Deng XW, et al. Intensity modulated radiotherapy for local-regional advanced nasopharyngeal carcinoma. Ai Zheng. 2004;23(11 Suppl):1532–7.
pmid
21. Ngeow J, Lim WT, Leong SS, Ang MK, Toh CK, Gao F, et al. Docetaxel is effective in heavily pretreated patients with disseminated nasopharyngeal carcinoma. Ann Oncol. 2011;22:718–22.
crossref pmid pdf
22. Hua YJ, Han F, Lu LX, Mai HQ, Guo X, Hong MH, et al. Long-term treatment outcome of recurrent nasopharyngeal carcinoma treated with salvage intensity modulated radiotherapy. Eur J Cancer. 2012;48:3422–8.
crossref pmid
23. Peng G, Wang T, Yang KY, Zhang S, Zhang T, Li Q, et al. A prospective, randomized study comparing outcomes and toxicities of intensity-modulated radiotherapy vs. conventional two-dimensional radiotherapy for the treatment of nasopharyngeal carcinoma. Radiother Oncol. 2012;104:286–93.
crossref pmid
24. Zhang MX, Li J, Shen GP, Zou X, Xu JJ, Jiang R, et al. Intensity-modulated radiotherapy prolongs the survival of patients with nasopharyngeal carcinoma compared with conventional two-dimensional radiotherapy: a 10-year experience with a large cohort and long follow-up. Eur J Cancer. 2015;51:2587–95.
crossref pmid
25. Wu F, Wang R, Lu H, Wei B, Feng G, Li G, et al. Concurrent chemoradiotherapy in locoregionally advanced nasopharyngeal carcinoma: treatment outcomes of a prospective, multicentric clinical study. Radiother Oncol. 2014;112:106–11.
crossref pmid
26. Chen QY, Wen YF, Guo L, Liu H, Huang PY, Mo HY, et al. Concurrent chemoradiotherapy vs radiotherapy alone in stage II nasopharyngeal carcinoma: phase III randomized trial. J Natl Cancer Inst. 2011;103:1761–70.
crossref pmid pdf
27. Kang MK, Oh D, Cho KH, Moon SH, Wu HG, Heo DS, et al. Role of chemotherapy in stage II nasopharyngeal carcinoma treated with curative radiotherapy. Cancer Res Treat. 2015;47:871–8.
crossref pmid pmc pdf
28. Tang LQ, Li CF, Li J, Chen WH, Chen QY, Yuan LX, et al. Establishment and validation of prognostic nomograms for endemic nasopharyngeal carcinoma. J Natl Cancer Inst. 2016;108:djv291.
crossref pmid pdf
29. Chua ML, Wee JT, Hui EP, Chan AT. Nasopharyngeal carcinoma. Lancet. 2016;387:1012–24.
crossref pmid
Editorial Office
Korean Cancer Association
Room 1824, Gwanghwamun Officia
92 Saemunan-ro, Jongno-gu, Seoul 03186, Korea
TEL: +82-2-3276-2410   FAX: +82-2-792-1410   E-mail: journal@cancer.or.kr
About |  Browse Articles |  Current Issue |  For Authors and Reviewers
Copyright © Korean Cancer Association.                 Developed in M2PI