INTRODUCTION
Acute myeloid leukemia (AML) encompasses a biologically heterogeneous group of clonal disorders of myeloid precursors (1). Thus, it is no great surprise that the treatment response is highly variable among patients. Leukemic cells are able to evade host immune surveillance because they do not express co-stimulatory molecules or adhesion molecules (2,3). Furthermore, leukemic blasts express tumor antigens that can enable their recognition by T cells, with attendant immune-mediated modulation of tumor growth (4). Thus, it may be possible to treat AML patients by manipulating the immune system using antigen-presenting cells (APCs) with increased potency (5).
Dendritic cells (DCs) are potent APCs that play a key role in antitumor host responses due to their ability to stimulate naive T cells (6). The goal of immunotherapy is to induce or up-regulate T cell-mediated tumor-specific immune responses. Therefore, DCs play a central role in various immunotherapeutic protocols by generating cytotoxic T lymphocytes (CTLs) (5). AML blast cells represent malignant, myeloid lineage-committed hematopoietic precursor cells. AML cells, like normal hematopoietic precursor cells, can be induced to differentiate into DCs by culturing them with various combinations of cytokines, such as granulocyte-macrophage colonystimulating factor (GM-CSF), interleukin (IL)-4, tumor necrosis factor α (TNF-α), CD40L, or stem cell factor (SCF). The DCs can then induce anti-leukemic cytotoxic activity by the presentation of unknown leukemic antigens in vitro (7,8). However, leukemic DCs are associated with a number of disadvantages: they are difficult to generate in 30~40% of patients, and they express fewer molecules related to adhesion, MHC, and the co-stimulatory pathway than monocyte-derived DCs (7,8). To overcome the limitations associated with leukemic DCs, the cytokine combination used to generate potent leukemic DCs can be improved using several approaches, including culture with other agents, such as CI or interferon-α, the use of autologous or allogeneic monocytederived DCs pulsed with tumor antigens, such as tumor lysates, peptides, or apoptotic bodies, and the augmentation of leukemic DCs by co-culture with natural killer (NK) cells (8~12).
Recently, there have been increasing reports of the generation of leukemic DCs by culturing leukemic cells in the presence of CI (9,13~17). In comparison to several methods of leukemic DC generation by using conventional cytokine combinations, the use of CI has some advantages in terms of simplicity, reduced culture time, cost effectiveness, and higher induction rate. CI-treated myeloid leukemic cells acquired many DC characteristics independent of prior differentiation state, transformation status, or sensitivity to biologic agents (13~17). Furthermore, CI can also be used to induce activated DCs from CD34+ hematopoietic progenitors, monocytes, or immature DCs, and DCs provide large numbers of efficient, nontransformed autologous APC for T cell sensitization strategies (13,15).
In this study, we sought to determine the optimal dose of CI and the appropriate length of AML cell culture and to evaluate the limitations of CI.
MATERIALS AND METHODS
1) Patient sample characteristics
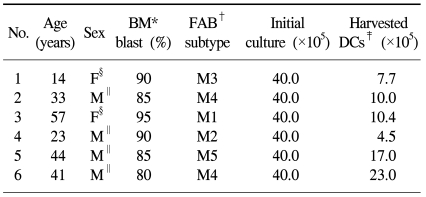
Bone marrow (BM) samples prior to induction chemotherapy were obtained after informed consent was obtained from six patients who were diagnosed with AML. The French-American-British (FAB) subtype of patients in this study included one patient with M1, one patient with M2, another patient with M3, two patients with M4 and a final patient with M5. Blast cell counts >60% were included in this study in order to enrich the purity of the leukemic cells. The clinical characteristics of the patients are shown in Table 1.
2) Generation of leukemic DCs from patients with AML
To generate leukemic DCs, BM mononuclear cells (MNCs) were isolated using density gradient centrifugation with Ficoll-Hypaque (Lymphoprep™, Nycomed, Norway) and were cultured at an initial density of 0.5~1×10⁶ cells/ml in RPMI 1,640 medium (Gibco-BRL, Grand Island, NY) supplemented with 10% FCS (Hyclone, Logan, UT) and 1% penicillin-streptomycin (GIBCO-BRL). To determine the optimal dose of CI and appropriate duration of culture, various concentrations of CI (90 ng/ml, 180 ng/ml, 270 ng/ml, or 360 ng/ml, sigma-Aldrich, St Louis, MO) were added to the cell culture medium, and the cells were cultured for 1, 2, or 3 days in the presence of CI.
After the optimal dose of CI and the appropriate duration of culture were determined by phenotypic analysis on leukemic DCs, the BM MNCs were cultured in the presence of 270 ng/mL of CI for 2 days, and IL 4 (50 ng/ml) (R&D Systems, Minneapolis, MN) was added at the beginning of the culture in some experiments in order to evaluate the further augmentation of leukemic DCs. After 2 days of culture, the cells were harvested and subsequently analyzed.
3) Phenotype analysis
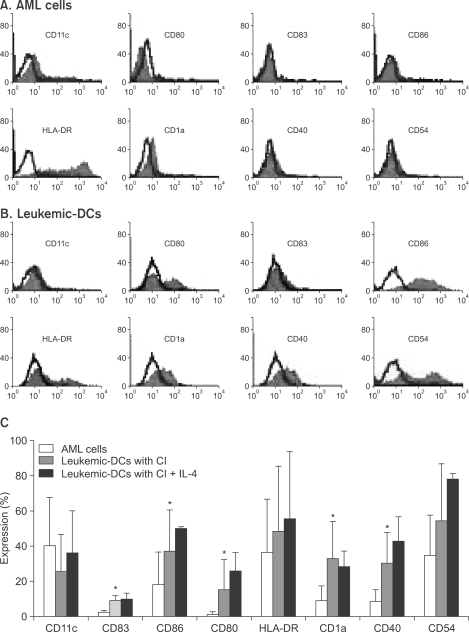
Fluorescence-activated cell sorting (FACS) analysis was performed using mouse monoclonal antibodies (mAb) against CD1a-fluorescein isothiocyanate (FITC), CD80-FITC, CD83-FITC, CD40-FITC, CD11c-phycoerythrin (PE), HLA-DR-PE, CD86-PE and CD54-PE (PharMingen, San Diego, CA). Isotype controls were run in parallel. Cell debris was eliminated from the analysis by forward and side scatter gating. The samples were acquired on a FACSCalibur cell sorter (Becton Dickinson, San Jose, CA), and the data were analyzed with CellQuest software (Becton Dickinson).
4) Allogeneic mixed lymphocyte reaction (MLR)
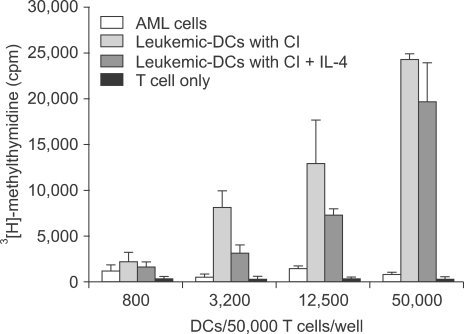
Allogeneic CD3+ T cells were isolated by positive selection using a magnetic activated cell sorter (MACS) (Miltenyi Biotec, Auburn, CA) from the PB of healthy volunteers. The CD3+ T cells (5×10⁴/well) were co-cultured with graded doses (8×10² to 5×10⁴) of irradiated (30 Gy) leukemic DCs that were harvested after 2 days of culture with CI in the presence or absence of IL-4. On day 5, the cultured cells were pulsed with 1 µCi of [3H]-methylthymidine per well during the last 16 to 18 h of culture and then analyzed in a liquid scintillation counter (Beckman, Fullerton, CA). The results were expressed as the mean cpm ± SD of triplicate samples. Unprimed CD3+ T cells were used as control for the MLR.
5) Apoptosis using FACScan for Annexin-V and Propidium Iodide
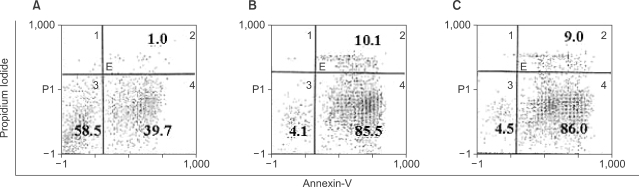
An Annexin V-FITC Apoptosis Detection kit (BD Pharmigen) was used for the apoptosis assay. The harvested leukemic DCs (2×10⁵) were washed 2 times with FACS buffer. The cell pellets were resuspended with Annexin V binding buffer and incubated with Annexin V-FITC and propidium iodide (PI) staining solution for 15 min at room temperature in the dark. The cells were acquired on a FACSCalibur cell sorter (Becton Dickinson) within 1 hour from staining and analyzed with CellQuest software (Becton Dickinson).
RESULTS
1) Generation of leukemic DCs from patients with AML
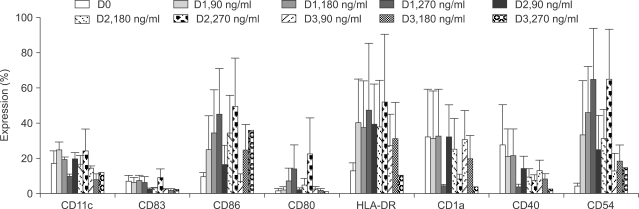
All six AML samples could be converted to leukemic DCs by culturing with CI (270 ng/ml) for 2 days. When 40×105 AML cells were cultured with 4 ml of the medium, the median number of leukemic DCs harvested was 10.2×10⁵ cells (range, 4.5~23.0×10⁵ cells). The results are shown in Table 1. May-Grunwald-Giemsa staining showed that the cells increased in size and in the development of cytoplasmic projections, indicating that untreated leukemic DCs and leukemic DCs treated with CI for 1, 2 or 3 days had similar features.
2) CI induces the rapid expression of several molecules within 1 to 2 days of culture
Initially, we performed FACS analysis on samples cultured under various conditions in order to determine the optimal concentration of CI and the appropriate duration of AML cell culture. As shown in Fig. 1, AML cells showed rapid upregulation in the expression of several molecules within 1~2 days, and the optimal CI concentrations were determined to be 180 and 270 ng/ml. Some molecules showed decreased expression when treated with lower concentrations of CI or when cultured for a longer period of time. We also cultured AML cells in the presence of CI (360 ng/ml or 500 ng/ml) for various durations, but it was impossible to perform further analyses because the yields of harvested cells were so low. We then performed further experiments for the generation of leukemic DCs from AML cells that were cultured with 270 ng/mL of CI for 2 days. In comparison with their expression in uncultured AML cells, the expression levels of several molecules, such as CD83, CD86, CD80, CD1a and CD40, were clearly upregulated in the AML cells in the presence of CI (p<0.05), whereas the expression of CD11c was decreased. Furthermore, the addition of IL-4 further augmented the expression of several molecules (Fig. 2).
3) Leukemic DCs induced by CI showed the highest MLR activity
We performed an MLR assay to evaluate the ability of CI-treated leukemic DCs to be used in the functional assay. Allogeneic CD3+ T cells were used as responder cells, and AML cells and CI-treated leukemic DCs were used as effector cells. In comparison to uncultured AML cells, leukemic DCs showed potent allostimulatory capacity in a dose-dependent manner (Fig. 3). The addition of IL-4 at the beginning of the culture did not augment the MLR activity.
4) Apoptosis inducing effect of CI on AML cells
In contrast to the conventional cytokine-treated leukemic DCs, the activation of intracellular signal transduction pathways by surface receptor-independent agonists led to the inhibition of proliferation and induction of apoptosis in AML cells. To evaluate the levels of apoptosis in AML cells cultured with CI, we used FACScan for Annexin V & PI to identify viable cells, early apoptotic cells and late apoptotic or dead cells. When AML cells were cultured with or without CI (270 ng/ml) for 2 days, leukemic DCs showed more significant apoptosis than primary culture AML cells, and the addition of IL-4 to the CI-treated AML cell culture did not affect the apoptosis of leukemic DCs (Fig. 4). The extent of apoptosis was much greater when the dose of CI was increased, and it was impossible to harvest leukemic DCs in the culture condition with higher concentrations (360 or 500 ng/ml) of CI.
DISCUSSION
In this study, we sought to determine the optimal dose of CI required to induce the generation of leukemic DCs from AML cells, the optimal duration of AML cell culture required for the cells to acquire leukemic DC characteristics, whether the addition of IL-4 further augments the function of leukemic DCs in terms of the expression of several molecules or T cell stimulatory capacities, and, finally, the induction of apoptosis in AML cells after treatment with CI in order to evaluate the limitations of CI. We found that, in the initial cultures to determine the optimal dose of CI and length of culture, several important molecules related to DCs were rapidly expressed within 1 to 2 days when treated with CI, and their expression levels were rather decreased on day 3. The optimal concentrations of CI were determined to be 180 and 270 ng/mL and treatment with much higher concentrations of CI made it difficult to harvest viable leukemic DCs due to extensive apoptosis. It usually takes 8 to 10 days to induce the generation of leukemic DCs from AMLS using the conventional approach involving the use of a combination of cytokines. On the other hand, the results of previous studies and those of this study have shown that CI is quite advantageous because it is associated with a reduced culture period (2~3 days), and because it is a simple low-cost culture method that can be used as an immunotherapy in patients with AML. However, the fact that CI treatment induces marked apoptosis, resulting in less viable leukemic DCs than leukemic DCs generated in the presence of conventional cytokine combinations, significantly limits its application to the generation of DCs from AML cells (16).
Unlike other diseased cells, AML cells can be directed to differentiate into functional DCs by a number of stimuli. The fact that the identification of leukemic antigens and their loading onto DCs are not necessary when using the CI method gives this method a great advantage over the others (7). The conventional approach is to utilize receptor-mediated extracellular signaling through various cytokine combinations (GM-CSF, IL-4, TNFα, SCF, CD40L, IL-3, etc), and it shows considerable variability and a relatively modest ability to generate leukemic DCs despite a more tailored cytokine approach to optimizing the generation of leukemic DCs (7,8,18~20). Another approach to the generation of leukemic DCs is to use direct intracellular signal transduction pathways through protein kinase C (PKC), such as phorbol esters, or intracellular calcium signaling, such as CI (10,13~17,21).
Evidence of total ablation by calcineurin antagonists, such as ascomycin or cyclosporine A, suggest that the calcium mobilizing agents may direct the differentiation of AML cells into APC by triggering downstream signaling through the activation of calmodulin and calcineurin (22,23). Recently, Li et al (24) suggested that PKC plays a role in determining the capacity of CI to induce leukemic cell differentiation. They demonstrated that the blockade of PKC with bisindolylmaleimide-I (Bis-1) inhibited the differentiation of HL-60 myeloid blasts into leukemic DCs with CI. In an effort to generate much more potent leukemic DCs, Kharfan-Dabaja et al (25) compared leukemic DCs cultured with intracellular signal transduction agonists and those cultured with extracelluar cytokines. The leukemic DCs cultured with signal transduction agonists, especially the combination of phorbol 12-myristate 13-acetate (PMA) and CI, showed the greatest capacity for the induction of T cell proliferation. Although it is associated with a shorter culture time and greater capacity to stimulate the production of more mature and more potent T cells, the relatively lower viability of DCs generated from AML cells treated with CI due to the increased toxicity of CI in comparison to conventional cytokines needs to be overcome before CI can be used as an immunotherapy against AML.