Association of Body Composition with Long-Term Survival in Non-metastatic Rectal Cancer Patients
Article information
Abstract
Purpose
We evaluated the association of body composition with long-term oncologic outcomes in non-metastatic rectal cancer patients.
Methods
We included 1,384 patients with stage(y)0-III rectal cancer treated at Asan Medical Center between January 2005 and December 2012. Body composition at diagnosis was measured using abdomino-pelvic computed tomography (CT). Sarcopenia, visceral obesity (VO), and sarcopenic obesity (SO) were defined using CT measured parameters such as skeletal muscle index (total abdominal muscle area, TAMA), visceral fat area (VFA), and VFA/TAMA. Inflammatory status was defined as a neutrophil-lymphocyte ratio of ≥3. Obesity was categorized by body mass index (≥ 25 kg/m2).
Results
Among the 1,384 patients, 944 (68.2%) had sarcopenia and 307 (22.2%) had SO. The 5-year overall survival (OS) rate was significantly lower in sarcopenic patients (no sarcopenia vs. sarcopenia; 84% vs. 78%, p=0.003) but the 5-year recurrence-free survival (RFS) rate was not different (77.3% vs. 77.9% p=0.957). Patients with SO showed lower 5-year OS (79.1% vs. 75.5% p=0.02) but no difference in 5-year RFS (p=0.957). Sarcopenia, SO, VO, and obesity were not associated with RFS. However, obesity, SO, age, sex, inflammatory status, and tumor stage were confirmed as independent factors associated with OS on multivariate analysis. In subgroup analysis, association of SO with OS was more prominent in patients with (y)p stage 0-2 and no inflammatory status.
Conclusion
The presence of SO and a low body mass index at diagnosis are negatively associated with OS in non-metastatic rectal cancer patients.
Introduction
Identification of potentially modifiable factors associated with oncologic outcomes and treatment response in patients with cancer is clinically important. In this context, body composition parameters associated with fat and muscle distribution has gained increased attention [1,2]. Besides this, systemic inflammation is a speculated risk factor affecting the survival of cancer patients [3,4].
Previous studies have reported that the composition and the distribution of skeletal muscle mass and visceral adipose tissue offer prognostic implications in patients with colorectal cancer (CRC) [5-7]. Sarcopenia, defined as low muscle mass status, is known to be associated with increased postoperative complications and delayed recovery in various types of cancers including colorectal cancer [4,8,9]. There is growing research interest in the correlation of sarcopenia or sarcopenic obesity (SO) with oncological outcomes, and a recent report has indicated that sarcopenia and systemic inflammation affect overall survival (OS) and recurrence-free survival (RFS) in CRC patients [10]. Studies reporting sarcopenic pati-ents with colorectal cancer have higher levels of systemic inflammatory markers and increased systemic inflammation affects survival in these cases has furthered the interest in these parameters [11-13]. SO, in which excessive body fat is present alongside low muscle mass and quality, has also been shown to be associated with decreased survival in colorectal cancer [14-16]. However, studies evaluating the influence of various body composition parameters on oncologic outcomes in colorectal cancer are limited.
Since sarcopenia, SO, and inflammatory markers can be readily measured by routine abdominopelvic computed tomography (CT) and laboratory blood tests prior to surgery and are correctable by exercise and medication, their correlation with negative oncological outcomes would be clinically significant. In the present study, we aimed to examine whether body composition parameters and systemic inflammation affect oncological outcomes in rectal cancer patients.
Materials and Methods
1. Study population
We enrolled stage (y)0-III rectal cancer patients who received surgical treatment at Asan Medical Center from January 2005 to December 2012. All of the included study patients underwent abdominopelvic CT and blood testing during their first diagnosis. For patients who had received preoperative chemoradiotherapy (PCRT), test records at the time of diagnosis, i.e., prior to this treatment, were analyzed. Data on the body mass index (BMI), age, sex, tumor stage, PCRT, recurrence, survival duration, and laboratory findings for the study patients were collected via a review of their medical records.
2. Body composition parameters
All CT images were retrieved from the Picture Archiving and Communication System at our institution. The presence of sarcopenia was evaluated on abdominal CT using Asan-J software, based on ImageJ (NIH, Bethesda, MD). Two consecutive axial CT images at the level of the inferior endplate of the L3 lumbar vertebra were processed and averaged for each patient. Using Asan-J, the total abdominal muscle area (TAMA, cm2), including all muscles on selected axial images, i.e., psoas, paraspinals, transversus abdominis, rectus abdominis, quadratus lumborum, and internal and external obliques, were demarcated using predetermined Hounsfield unit thresholds on CT or the signal intensity on precontrast images [17]. The visceral fat area (VFA, cm2) and subcutaneous fat area (SFA, cm2) were demarcated using the adipose tissue thresholds on CT (Fig. 1). Visceral obesity (VO) was defined as a VFA ≥ 100 cm2. The skeletal muscle index (SMI) was calculated as TAMA/height 2 and sarcopenia was defined by an SMI of ≤ 52.4 cm2/m2 for men and ≤ 38.5 cm2/m2 for women [8]. A VFA/TAMA ratio of above 3.2 was defined as SO [18]. The BMI was calculated as weight (kg)/ height2 (m2). A BMI above 25 was considered obesity.
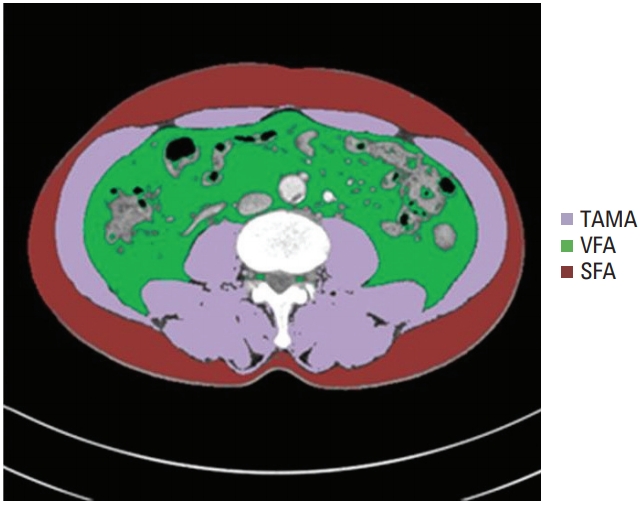
Body morphometric evaluations of abdominal fat and muscle areas. At the level of the inferior endplate of the L3 vertebra, an axial computed tomography image was segmented into the total abdominal muscle area (TAMA), visceral fat area (VFA), and subcutaneous fat area (SFA).
3. Marker of systemic inflammation
We used neutrophil-lymphocyte ratio (NLR) as an indicator of systemic inflammation. A NLR of 3 or greater was considered to indicate an inflammatory status and values below 3, of no inflammatory status [10,19].
4. Statistical analysis
All continuous variables were shown as mean values with a standard deviation. Survival duration was determined from the time of first diagnosis to the period of death from any cause or the last follow-up date. In the RFS analysis, the time of disease recurrence or death from any cause was considered. The associations between sarcopenia and SO and the 5-year OS and RFS outcomes in our rectal cancer cohort were analyzed using Kaplan-Meier curves. Cox regression analysis was used to evaluate the factors associated with patient survival duration, and calculate the hazard ratios (HRs) and 95% confidence intervals. The covariates used in the analysis were sarcopenia, SO, VO, sex, age, pathologic tumor stage, obesity, PCRT, and inflammation. Variables with p < 0.2 were used in the multivariate analysis.
Subgroup analysis for evaluating the association between sarcopenia/SO and oncologic outcomes was performed according to the pathologic tumor stage (yp stage 0-2 and yp stage 3) and the inflammatory status (inflammation and no inflammation). Cancer stages were categorized using TNM tumor staging. We then analyzed whether sarcopenia and SO were associated with survival outcomes in these subgroups. The OS and RFS of each subgroup were analyzed by Kaplan-Meier curves and the HR was calculated using Cox regression analysis.
Statistical significance was reported at the p < 0.05 level. Statistical analyses were conducted using SPSS software ver. 21.0 (IBM Corp., Armonk, NY).
5. Ethical statement
The Institutional Review Board of the Asan Medical Center (2018-0993) approved this study. The informed consent was waived due to the retrospective design of this study.
Results
1. Clinicopathological characteristics of the study patients
Among the 1,384 rectal cancer patients included in the whole study cohort, 944 (68.2%) were categorized as sarcopenia and 307 (22.2%) as having SO. Majority of the patients were men (n=888, 64.2%). The mean BMI was 23.9±4.4, 458 patients (33.1%) were obese (25 kg/m2 ≤ BMI), and 42 patients (3%) had a BMI of 30 or more. In addition, 670 patients (48.4%) had VO and 536 subjects had undergone PCRT (38.7%). In terms of the tumor pathology, 911 patients (65.8%) had (y)p stage 0-2 tumor. Based on NLR, 278 patients (20.2%) were categorized with inflammatory status. Table 1 summarizes these clinicopathological characteristics.

Clinicopathological characteristics of the study patients
2. Distribution and correlations among sarcopenia, BMI, and VO
Among the parameters, SMI, BMI, and visceral fat showed correlations. The SMI and BMI had a positive correlation (r=0.637, p < 0.001), BMI and visceral fat had a slightly weaker positive correlation (r=0.444, p < 0.001), and SMI and visceral fat showed a weak positive correlation (r=0.247, p < 0.001) (Fig. 2). Incidence of sarcopenia and VO according to sex, age, and pathologic tumor stage was analyzed (Table 2). Sarcopenia and VO had a higher incidence in men. Patients older than 65 years were both more sarcopenic and had VO. The (y)p stage 0-2 cases also had a predominance of VO. The distribution of sarcopenia, obesity, or VO was not different according to receipt of PCRT.

(A-C) Correlation among skeletal muscle index (SMI) and body mass index (BMI), and visceral fat area (VFA). (A) The SMI and BMI showed a positive correlation (r=0.637).

Distribution of sarcopenia, body mass index, and visceral fat according to sex, rectal tumor stage, and receipt of PCRT
3. Association of body composition and inflammatory status with oncologic outcomes
The sarcopenic patients showed a significantly lower 5-year OS rate (84% vs. 78%, p=0.003), similar to the SO patients (79.1% vs. 75.5% p=0.020). Those with inflammation also displayed a significantly worse 5-year OS (83.3% vs. 66.0%, p < 0.001) (Fig. 3) and lower 5year RFS (75.7% vs. 55.4%, p < 0.001). However, RFS showed no difference bet-ween patients categorized with sarcopenia and with SO. Moreover, the 5-year RFS and OS did not vary according to VO.

Overall survival (OS) outcomes according to sarcopenia (A), sarcopenic obesity (SO) (B), and the neutrophil-lymphocyte ratio (NLR) (C). Sarcopenia and SO showed negative association with the 5-year overall survival rate. A high NLR was also associated with a poorer 5-year OS.
Sarcopenia, SO, visceral obesity, and obesity were not associated with RFS (Table 3). However, sarcopenia, SO, obesity, inflammatory status, age, sex, and pathologic stage were found to be associated with OS in univariate analysis. Obesity, SO, and inflammatory state were confirmed as independent factors associated with OS, together with age, sex, and pathologic stage, in multivariate analysis (Table 4).

Risk factors associated with recurrence-free survival

Risk factors associated with overall survival
4. Influence of sarcopenia and SO on oncologic outcomes according to tumor stage and inflammatory status
Oncologic outcomes according to sarcopenia and SO were analyzed in subgroups categorized by pathologic tumor stage and inflammatory status. For patients without lymph node metastasis ((y)p stage 0-2), the OS was significantly lower in the sarcopenia cases (p=0.003), but no such differences were observed among the patients with lymph node metastasis (y)p stage 3) (p=0.310). SO patients with (y)p stage 0-2 also showed lower OS (p=0.024), but this difference was not observed in SO patients with (y)p stage 3 (p=0.097). The HR of SO was higher in patients with (y)p stage 0-2 (HR, 1.592) than in those with (y)p stage 3 (HR, 1.243) (Fig. 4).
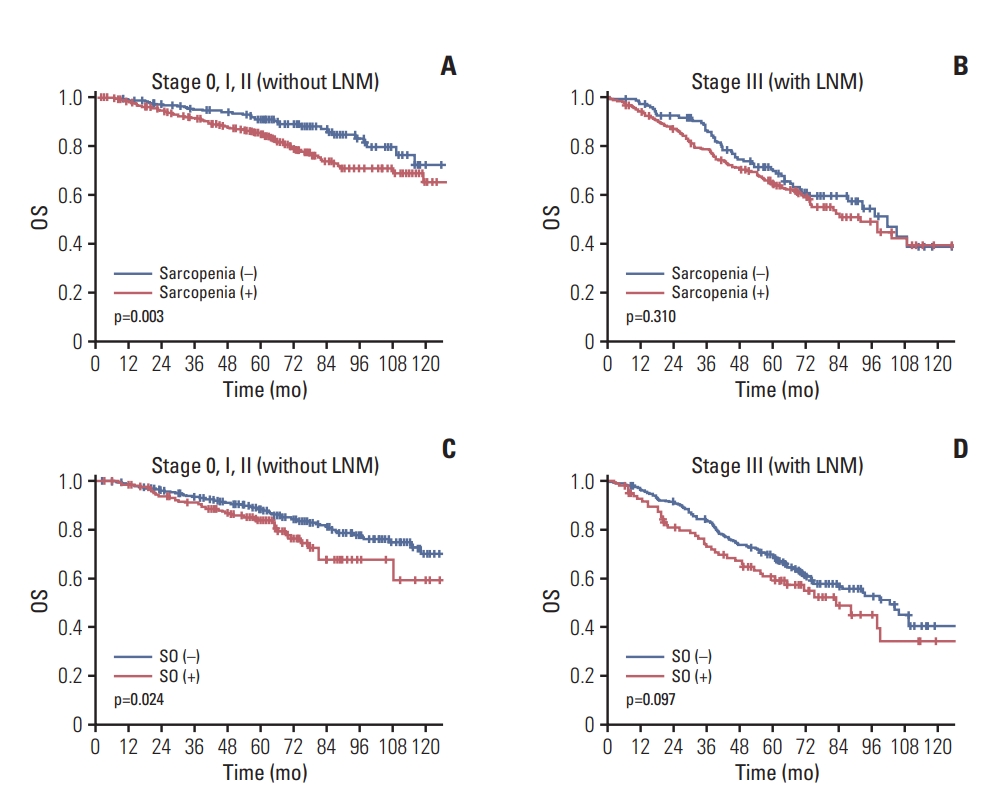
Association between overall survival (OS) and sarcopenia and sarcopenic obesity (SO) according to the pathologic stage of the rectal tumor. The influence of sarcopenia on survival was evaluated in patients with (y)p stage 0-2 (A) and (y)p stage 3 (B) tumor. The association between SO and OS was also evaluated in the (y)p stage 0-2 (C) and (y)p stage 3 (D) rectal cancer cases. LNM, lymph node metastasis.
In the no inflammatory status, an OS decline was observed in the sarcopenic cases (86.3% vs. 81.7%, p=0.014). For patients with inflammatory status, however, no OS differences were found. Whilst SO patients exhibited a lower OS with a no inflammatory status (84.5% vs. 79.4%, p=0.006), there were no differences among the SO cases with an inflammatory state. In terms of OS, HR of SO was higher in no inflammatory status (HR, 1.576) than in inflammatory status (HR, 1.054) (Fig. 5).
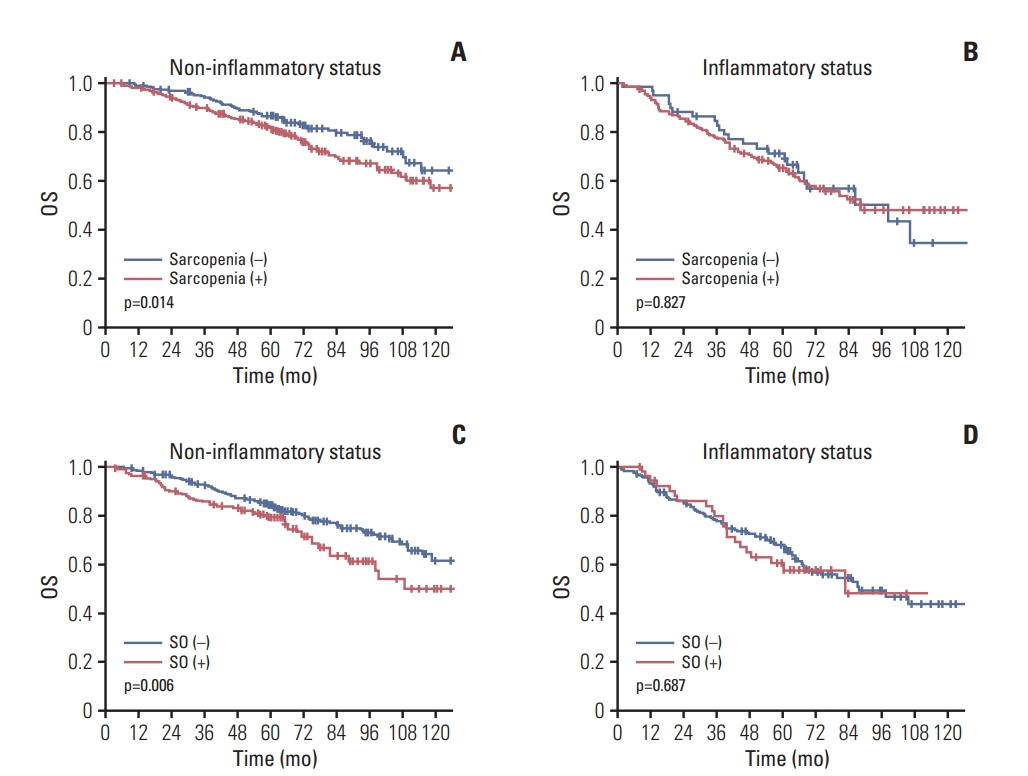
Association between overall survival (OS) and sarcopenia and sarcopenic obesity (SO) according to the inflammatory status of the rectal cancer patients. The influence of sarcopenia on the OS rate in patients with a non-inflammatory (A) and inflammatory (B) status was assessed. The association between SO and OS outcomes in non-inflammatory (C) and inflammatory (D) status cases was also evaluated.
Discussion
We found from our current analyses that SO, low body mass index, and an inflammatory status are independent negative prognostic indicators for OS. Furthermore, our subgroup analysis demonstrated that association between OS and SO was more prominent in patients without lymph node metastasis or with no inflammatory status.
We analyzed the long-term outcomes of SO in our current rectal cancer patient series and were able to observe the effects of current practical treatment settings on survival outcomes by including the patients who had undergone PCRT, which has recently become a standard therapy for rectal cancer, and by considering combined treatment effects. Furthermore, by examining the associations between various body composition values including sarcopenia, SO, BMI, and VO, and analyzing the effects of each of these parameters, we could evaluate those that had the most prognostic utility.
Studies on the association between body composition and long-term outcomes in colorectal cancer have shown inconsistent results. Sarcopenia has been reported as a risk factor for worse OS in some reports [1,10,15], but, its influence on RFS was reportedly varied [1,15]. Some studies evaluating the influence of both body fat and skeletal muscle mass on oncologic outcomes indicated that SO is an independent predictor of poorer outcomes in colorectal cancer [4,14-16]. A recent study analyzed sarcopenia and systemic inflammation together and reported that these are independent factors for a decreased OS and RFS and are predictors of a higher risk if found in combination [10]. This study further discussed the effects of sarcopenia in concert with systemic inflammation on survival.
In the present study, the independent prognostic factors affecting OS were found to be SO and inflammatory status. There are studies reporting on the association between SO and poor OS and higher mortality associated with solid tumors [17,18]. The exact mechanism of how body composition (such as sarcopenia and SO) affects the survival of cancer patients remains unknown. Systemic inflammation might be a possible explanation [10]. A systemic inflammatory condition is known to increase the risk of cancer [19] and reduce a patient’s response to treatment [20]. Sarcopenia and systemic inflammation are known to be correlated and this relationship would be substantial in obese patients who were defined as SO [5]. Possible explanations of how SO is independently related to mortality and morbidity might be the associations between immunity, inflammation, and myokines and adipocytokines [5,21,22]. Myokines play a pivotal role in cancer prevention as mediators of the beneficial effects of physical activity, counteracting the harmful effects of proinflammatory adipokines [23,24]. SO might be the condition bringing about the worsening of the imbalance in cytokines.
Our present subgroup analysis indicated an OS difference in SO patients and this was more pronounced in patients without lymph node metastasis or with no inflammatory status. This supports the hypothesis that systemic inflammation is a mechanism in which SO affects cancer survival. It may be possible that a severe inflammatory state itself has the principal negative effect on survival and that SO worsens this risk but relatively weakly. Although a non-inflammatory state accompanies SO, it might still progress into the aforementioned vicious cycle, exacerbate systemic inflammation, and thus have a relatively larger negative impact on survival. Since the advanced stage of CRC is also associated with a high inflammatory state [25,26], the effects of stage without lymph node metastasis can possibly be explained in a manner similar to the no inflammatory state. Further studies will be needed to elucidate these possibilities.
In the present study, SO was associated with OS but not RFS. Obese patients are more likely to be affected by hypertension, diabetes, cardiac disease, and metabolic syndrome, and are usually associated with increased morbidity and mortality. Therefore, it was suspected that the adverse effect of SO on OS might be associated with medical co-morbidities rather than an effect of SO. In this study, however, we used CT measured parameters for the definition of SO, not the combination of obesity and sarcopenia. Indeed, obesity itself was rather associated with better OS in the present study. Therefore, the negative effect of SO on OS was not considered to be mainly due to medical co-morbidities. Inflammatory status was the most potent associated factor of both RFS and OS in our cohort. Impact of SO on OS differed in degree according to the inflammatory status. Therefore, SO might be associated with OS through inflammation-related processes. Mechanism of how SO is associated with OS in colorectal cancer needs to be studied further.
Our present study had some limitations of note. First, since the definition of sarcopenia and SO is not fully established in Korea, we adopted the widely used Western definition. The prevalence of sarcopenia in CRC patients has been reported previously to range from 40%-60% [10,27,28], which is comparable to our present findings, but the cut-offs may not be appropriate for a Korean population since people in the West and East have a different baseline muscle mass or fat mass. Thus, our findings may have differed from those of other studies if a different baseline is adopted. Second, as we analyzed the effects of body mass composition parameters and inflammation based on single measurements prior to treatment, we were unable to examine postoperative changes over time. Furthermore, since our analyses were retrospective in nature and we had to use medical records to determine the inflammatory state, analysis of the effects of inflammatory markers is limited.
Notwithstanding these limitations, we enhanced the reliability of our data through the use of a larger-scale cohort that ensured greater statistical power. We thus believe that we have provided valid early study findings on the possibility of using SO as a prognostic factor in rectal cancer patients.
In conclusion, SO is a negative prognostic indicator in rectal cancer patients and is a more potent risk factor for poorer survival in patients with cancers without lymph node metastasis or those in a non-inflammatory state. Given that SO can be corrected, further prospective studies are warranted to determine if such interventions could improve cancer survival outcomes.
Notes
Conflict of interest relevant to this article was not reported.
Acknowledgements
This research was supported by a grant of the Korea Health Technology R&D Project through the Korea Health Industry Development Institute (KHIDI), funded by the Ministry of Health & Welfare, Republic of Korea (grant number: HI18C1216).