Alterations in PD-L1 Expression Associated with Acquisition of Resistance to ALK Inhibitors in ALK-Rearranged Lung Cancer
Article information
Abstract
Purpose
The purpose of this study was to evaluate the relationships between the resistance of anaplastic lymphoma kinase (ALK)‒positive non-small cell lung cancer (NSCLC) to ALK inhibitors and the programmed cell death-1/programmed cell death–ligand 1 (PD-L1) pathway, we evaluated alterations in PD-L1 following acquisition of resistance to ALK inhibitors in ALK-positive lung cancer.
Materials and Methods
We established ALK inhibitor-resistant cell lines (H3122CR1, LR1, and CH1) by exposing the parental H3122 ALK-translocated NSCLC cell line to ALK inhibitors. Then, the double-resistant cell lines H3122CR1LR1 and CR1CH1 were developed by exposing the H3122CR1 to other ALK inhibitors. We compared the alterations in PD-L1 expression levels using western blotting, flow cytometry, and quantitative polymerase chain reaction. We also investigated gene expression using RNA sequencing. The expression of PD-L1 in the tumors from 26 ALK-positive metastatic NSCLC patients (11 ALK inhibitor-naïve and 15 ALK inhibitor-resistant patients) was assessed by immunohistochemistry and analyzed.
Results
PD-L1 was expressed at higher levels in ALK inhibitor-resistant cell lines than in the ALK inhibitor-naïve parental cell line at the total protein, surface protein, and mRNA levels. Furthermore, PD-L1 expression in the double-resistant cell lines was much higher than that in the single resistant cell lines. RNA sequencing demonstrated that expression of immune-related genes were largely involved in ALK inhibitor resistance. The mean value of the PD-L1 H-score was 6.5 pre-treatment and 35.0 post-treatment, and the fold difference was 5.42 (p=0.163).
Conclusion
PD-L1 expression increased following acquisition of ALK inhibitor resistance in ALK-positive NSCLC cell lines and tumors.
Introduction
Oncogenic fusion genes that activate the tyrosine kinase anaplastic lymphoma kinase (ALK) have been identified as oncogenic drivers of non-small cell lung cancer (NSCLC) in 4% to 15% of NSCLC patients [1,2]. Treatment with an ALK tyrosine kinase inhibitor is a standard therapy for patients with ALK-rearranged NSCLC; however, most patients relapse within 1 to 2 years due to the development of drug resistance [3]. In contrast to epidermal growth factor receptor (EGFR)–mutant NSCLC in which T790M represents the only EGFR-resistance mutation, only one-third of crizotinib-resistant cases have a genetic alteration of ALK itself. The remaining cases of crizotinib-resistance are thought to arise through several different mechanisms [3].
Tumorigenesis is not only dependent on the properties of cancer cells but also on the interactions with the immune system [4,5]. The interaction of programmed cell death–ligand 1 (PD-L1, also known as B7-H1 or CD274) expressed on antigen-presenting cells and parenchymal cells and its receptor programmed cell death-1 (PD-1, also known as CD279) on T cells is a physiologic mechanism that underlies escape from immune activity [6]. PD-L1 is also expressed in tumor cells, resulting in inhibition of the immune response to tumor cells and consequent facilitation of tumor progression. Approximately 24.8% to 69.2% of NSCLC were found to express PDL1 [5-7]. Thus, PD-L1 inhibition was introduced as a cancer treatment for NSCLC and resulted in survival improvement in these patients [8,9].
PD-L1 is more likely to be expressed in ALK-positive NSCLC than in EGFR/KRAS/ALK wild-type NSCLC (60% vs. 24%) [7]. The association between the PD-1/PD-L1 pathway and the resistance of ALK-positive NSCLC to ALK inhibitors, however, has yet to be defined well. Here, we investigated alterations in PD-L1 expression after acquisition of resistance to ALK inhibitor in ALK-positive NSCLC to investigate the association of the resistance to ALK inhibitor with PD-1/PD-L1 pathway in ALK-positive NSCLC.
Materials and Methods
1. Cell lines and reagents
NCI-H3122 cells were provided by Pasi A. Jänne (DanaFarber Cancer Institute, Boston, MA). H3122 cells were maintained in RPMI 1640 medium with gentamicin (Gibco, Grand Island, NY) and supplemented with 10% fetal bovine serum (Gibco). The cell line was incubated at 37°C in a humidified atmosphere of 5% carbon dioxide. Crizotinib and alectinib were purchased from Selleck Chemicals (Houston, TX) and dissolved in dimethyl sulfoxide (Sigma-Aldrich, St. Louis, MO) for experiments. Ceritinib was obtained from Active Biochem (Maplewood, NJ). ALK inhibitor-resistant cell lines (CR1, LR1, and CH1) were established by exposing parental H3122 cells to crizotinib, ceritinib (LDK378), and alectinib (CH-5424802), respectively, at doses of 100 nM to 1 μM. Double-resistant cell lines (CR1LR1 and CR1CH1) were generated by exposing the crizotinib-resistant cell line CR1 to ceritinib and alectinib, respectively. The subclonal resistant cell lines exhibited ≥ 5-fold greater IC50 values for ALK inhibitors than parental cells, as determined using the cell viability assay, and this phenotype was stable for at least 6 months without ALK inhibitor treatment.
2. Western blotting
The cell lines were harvested and lysed for western blot analysis. Primary antibodies PD-L1 and glyceraldehyde 3-phosphate dehydrogenase (Cell Signaling Technology, Danvers, MA) were used for immuno-blotting. The blots were washed, transferred to freshly prepared enhanced Lumi-Light Western Blotting Substrate (Roche, Indianapolis, IN), and subjected to imaging analysis using an LAS-3000 imaging system (Fuji Photo Film Co., Stamford, CT).
3. Flow cytometry
Cells (2×10⁵) were separated into aliquots and placed into assay tubes. Then, 2 mL of fluorescence-activated cell sorting (FACS) buffer was added to each tube and rinsed by centrifugation twice. Cells were resuspended in 100 μL FACS buffer and then stained with mouse anti-human PD-L1 (MIH1, BD Pharmingen, San Jose, CA) or a mouse IgG1 isotype control for 30 minutes on ice in staining buffer (2% bovine serum albumin and 0.01% sodium azide). Analysis was conducted using a FACSCalibur instrument (BD Biosciences, San Jose, CA) with CELLQuest software (BD Biosciences) or Flow Jo software (Tree Star Inc., Ashland, OR).
4. Quantitative polymerase chain reaction
Total RNA was collected from cultured cells using the Pure Link RNA mini kit (Invitrogen, Carlsbad, CA). The cDNA was synthesized with SuperScript Ⅲ reverse transcriptase using random hexamer primers (Invitrogen). β-Actin expression was used as an internal reference to normalize input cDNA. The ratios of the expression levels of each gene to that of the reference gene were calculated. The primer sequences used for quantitative polymerase chain reaction (PCR) are provided in supplementary data. All experiments were repeated two times with similar results.
5. RNA sequencing
RNA sequencing was performed on NCI-H3122-derived cell lines using the Illumina TruSeq RNA sample prep kit v2 (Illumina, San Diego, CA). Quality and quantity of the library were measured using Bioanalyzer and Qubit. Sequencing of the transcriptome library was carried out using the pairedend mode of the TruSeq Rapid SBS kit (Illumina). Reads from FASTQ files were mapped against the hg19 human reference genome using TopHat2. Quantification of gene expression was performed, and differentially expressed genes were identified using the Tophat2–cufflink–cuffdiff axis [10]. Differentially expressed genes were selected and analyzed according to Gene Ontology (GO) classification, with GO searches using Gene Ontology Consortium (http://www.geneontology.org/) and ToppGene Suite (http://toppgene.cchmc.org/) [11]. We determined the representative pathways using Kyoto Encyclopedia of Genes and Genomes (KEGG) mapper [12].
6. Patients and samples
We collected tumor tissues from 26 patients with metastatic NSCLC with ALK translocation from the Seoul National University Hospital. Eleven specimens were biopsied before ALK inhibitor treatment, and 16 specimens were acquired after resistance developed to the ALK inhibitor crizotinib. The pre- and post-treatment specimens were non-paired. Clinical and histological data were reviewed retrospectively.
7. Immunohistochemistry
Immunohistochemistry was performed as previously described [13]. The ALK inhibitor-naïve and -resistant tumor samples were stained for PD-L1, PD-1, CD3, CD4, CD8, CD68, and FOXP3. Commercially available primary antibodies were used according to the manufacturer’s instructions (anti-PD-L1 [E1L3N] XP, rabbit monoclonal, Cell Signaling Technology; anti-CD8, rabbit monoclonal, clone SP16, Neomarkers, Fremont, CA; anti-FOXP3, mouse monoclonal, clone 236A/E7, Abcam, Cambridge, UK; and anti-CD3, rabbit polyclonal, Dako, Glostrup, Denmark).
The stained slides were scanned using ScanScope XT (Aperio Technology, Vista, CA). The densities of the positively stained tumor-infiltrating lymphocytes (TILs) were evaluated in the intratumoral areas using the image analysis system (ScanScope XT, Aperio Technology).
For PD-L1 expression analysis, the intensity of staining was evaluated according to the following scale: 0, no staining; 1, weak staining; 2, moderate staining; and 3, strong staining. The proportion of membranous and/or cytoplasmic staining in tumor cells expressing PD-L1 was determined. Two kinds of PD-L1 scoring systems were applied. One scoring system was the H-score, which was defined and calculated as the product of the intensity score (0, 1, 2, and 3) and the proportion, resulting in a score of 0-300, as previously described [14,15]. The other scoring system was also based on the intensity and proportion of tumor cells as follows: 0, negative; 1, weak or moderate in < 10% of tumor cells; 2, moderate in ≥ 10% of tumor cells; and 3, strong (more intense than alveolar macrophages) in ≥ 10% of tumor cells. Cases with scores of 2 or 3 were deemed positive for PD-L1 expression [13]. The immunohistochemical stain results were analyzed by two pathologists who were blinded to the patients’ identities and clinical data.
8. Statistical analysis
The independent t test and the Mann-Whitney U-test were used to compare differences in densities of immune cell markers and PD-L1 H-score before and after acquisition of crizotinib resistance. The PD-L1 score and positivity before and after acquisition of crizotinib resistance were analyzed by Fisher exact test and by linear-by-linear association. Two-sided p-values < 0.05 were considered to indicate statistical significance. All statistical analyses were performed using SPSS statistics software ver. 20 (IBM Corp., Armonk, NY).
9. Ethical statement
This study was approved by the Institutional Review Board at Seoul National University Hospital (Research for change of immune system related to treatment with ALK inhibitor in ALK-positive non-small cell lung cancer, H-1505-011-667). As the present study was carried out retrospectively, written informed consent from patients was waived. Personal identifiers were completely removed and the data were analyzed anonymously.
Our study was conducted according to the ethical standards recommended by the 1964 Declaration of Helsinki and its later amendments.
Results
1. Changes in PD-L1 protein levels before and after acquisition of ALK inhibitor resistance in ALK-positive lung cancer cell lines
Growth inhibition rates were used to calculate the IC50 for each cell line (S1 Table). We investigated the resistance mechanisms, including secondary mutations in ALK, EGFR, and KRAS, and found no mutations in these cell lines. In vitro clones with resistance to ALK inhibitors were selected by growing H3122 cells in increasing concentrations of ALK inhibitors to a final concentration of 1 μM, and cells were maintained under these conditions for ≥ 6 months. PD-L1 expression in H3122 and sublines was analyzed by immunoblotting. Increased PD-L1 expression was observed in the cell lines as resistance to ALK inibitors was acquired (Fig. 1A). Furthermore PD-L1 expression in the double-resistant cell lines was much higher than that in the single-resistant cell lines.
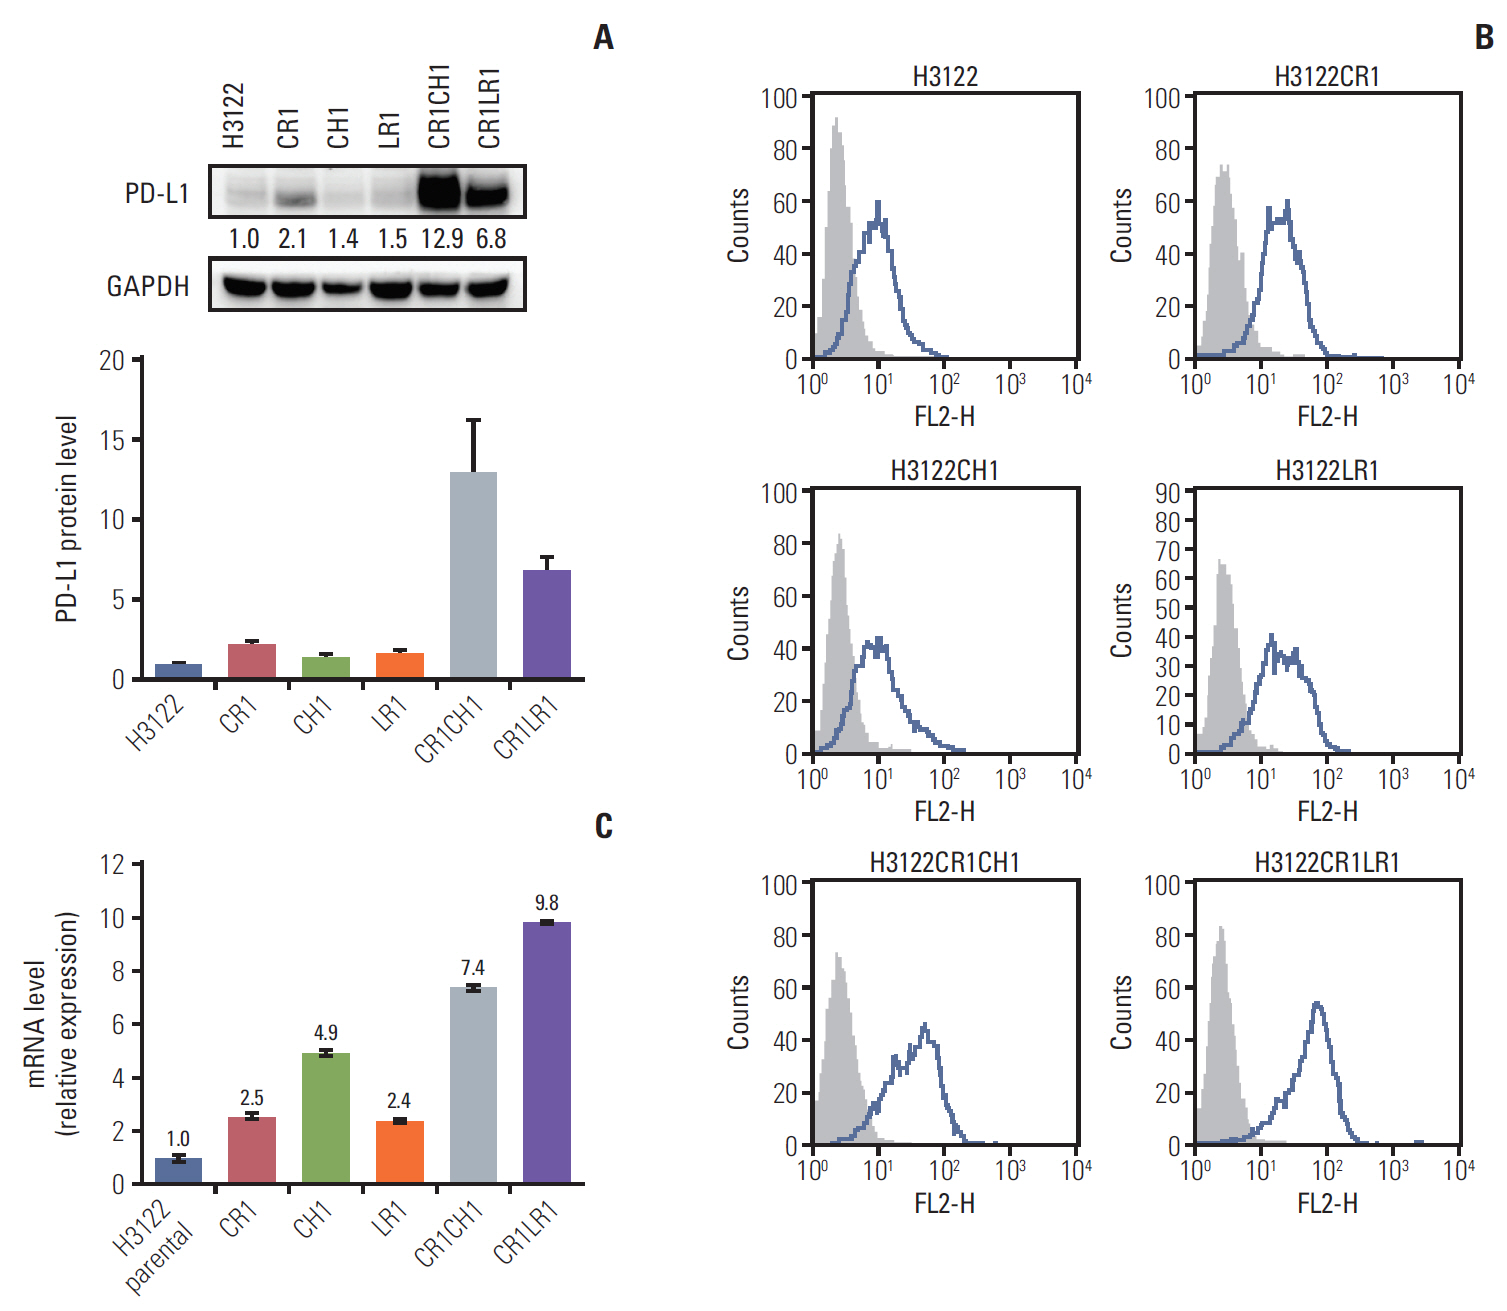
Programmed cell death–ligand 1 (PD-L1) protein levels in the parental H3122 and its subclonal cell lines with single- and double-resistant cell lines by Western blot (band intensities were measured by densitometry using Image J and normalized to those of glyceraldehyde 3-phosphate dehydrogenase (GAPDH) serving as a loading control) (A) and fluorescence-activated cell sorting analysis. Histograms depict PD-L1 expression (B). PD-L1 mRNA levels. The error bars indicate the standard deviation (C).
2. Changes in PD-L1 surface protein levels before and after acquisition of ALK inhibitor resistance in ALK-positive lung cancer cell lines
The panel of lung cancer cell lines harboring the ALK translocation was examined for cell surface PD-L1 expression by flow cytometry before and after the establishment of ALK inhibitor resistance (Fig. 1B). The expression of surface PD-L1 as assessed by the median fluorescence intensity was increased 1.3- to 2.5-fold in CR1, LR1, and CH1 cell lines compared with levels in the parental cell line. Following the establishment of the double resistance to ALK inhibitors, the CR1LR1 and CR1CH1 cell lines expressed markedly higher levels (3.9- to 5.2-fold increase) of PD-L1 than their parental line counterparts.
3. Changes in PD-L1 mRNA levels before and after acquisition of ALK inhibitor resistance in ALK-positive lung cancer cell lines
The changes in PD-L1 mRNA levels after acquisition of resistance to ALK inhibitors were assessed by quantitative PCR. In CR1, LR1, and CH1 cell lines, the levels of PD-L1 mRNA were increased by 2.5-, 2.4-, and 4.9-fold, respectively. Following acquisition of double resistance to ALK inhibitors, lung cancer lines expressed 7.4- to 9.8-fold higher levels of PD-L1 than their parental line counterparts (Fig. 1C).
4. Transcriptome profile
RNA sequencing was performed on the following six cell lines: H3122 parental, CR1, LR1, CH1, CR1LR1, and CR1-CH1. The mean read count was 6.7×10⁷ (standard deviation, ±7.0×10⁶). The gene expression levels were estimated as fragments per kilobase of transcript per million fragments mapped (FPKM) values. We excluded genes that were not matched to reference genes or nameless, and at least one of the FPKM values for each cell line was 0, to avoid erroneous detection. In total, 16,984 genes were analyzed. CR1 and CH1 shared similar features of gene expression, and the double-resistant CR1LR1 and CR1CH1 cells also shared common features of gene expression (S2 Fig.).
To evaluate differently expressed genes in the resistant lines compared to the H3122 parental line, we divided the cell lines into the following three groups according to the degree of resistance: parental, R1 (CR1, LR1, and CH1), and R2 (CR1LR1 and CR1CH1) groups. We estimated the mean FPKM values for each group. Then, we selected 739 genes that were expressed differently with an absolute log2 fold change in FPKM values > 2 between H3122 parental and either R1 or R2 (S3 Fig.).
We then selected the top 20 ranked genes in each comparison (parental vs. R1 and parental vs. R2). Log2 fold changes of mean FPKM values in each group compared to the parental H3122 cell line are shown in Fig. 2 and S4 Table. Eight genes were among the top 20 absolute log2 fold changes in both the R1 and R2 groups, highlighting the importance of these genes. Among the top 20 differentially expressed genes in the R1 or R2 groups compared to the H3122 parental cell line, the majority of the genes were associated with the immune system.
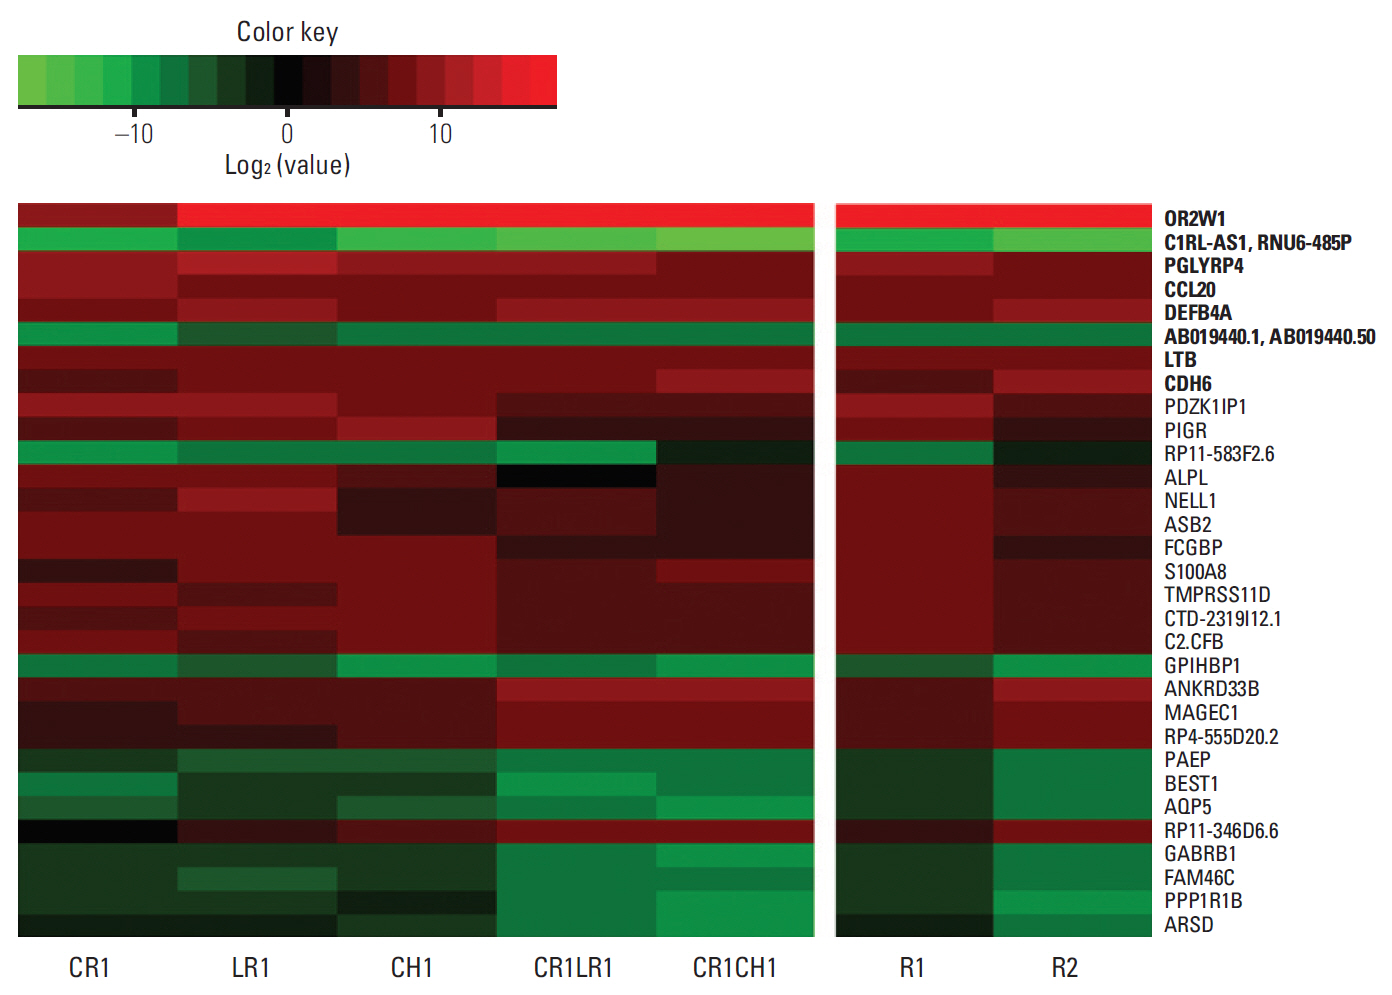
The heatmap of log2 fold changes of gene expression in anaplastic lymphoma kinase (ALK) inhibitor-resistant cell lines compared to parental H3122 cell lines. The image represents the top 20 absolute log2 fold changes in each comparison (H3122 vs. R1 and H3122 vs. R2; total: 32 genes). Eight genes among the top 20 absolute log2 fold changes in both the R1 and R2 groups are shown in bold texts.
Of the several immune checkpoints identified, only PD-L1 gene expression increased as resistance to ALK inhibitors became more profound (S5 Table). No alterations in expression of genes of other oncogenic pathways and lung adenocarcinoma-related genes by The Cancer Genome Atlas were observed in the ALK inhibitor-resistant cells, indicating a lack of bypass pathway activation in these cell lines (S6 Table).
GO enrichment analysis was performed using the ToppGene database. The analysis was performed with genes that were differentially expressed by > 4 or < –4 log2 fold changes to explore the relationship between the resistance and the biological processes and pathways (S7 and S8 Tables). The differentially expressed genes with a > 2 or < –2 log2 fold change were assessed using the KEGG mapper tool. Representative pathways related to the differentially expressed genes include cancer, cytokine-cytokine receptor interactions, and extracellular matrix-receptor interactions (S9-S11 Figs.).
5. Patients and tumor characteristics
The baseline characteristics of the patients are provided in Table 1. Twenty-six ALK-positive NSCLC patients (11 ALK inhibitor-naïve and 15 ALK inhibitor-resistant patients) were included in the present study. No significant differences in the baseline clinicopathologic characteristics between the two groups were noted. All ALK inhibitor-resistant patients underwent biopsy when the disease had progressed following crizotinib treatment. Crizotinib was most frequently used as the second-line chemotherapy (range, 1st to 4th).

Baseline characteristics of patients and patient outcomes after crizotinib treatment
6. Comparison of PD-L1 in pre-treatment and post-treatment tumor specimens
Representative immunohistochemistry images for PD-L1 expression that were scored as 0, 1, 2, and 3 are shown in Fig. 3. The mean PD-L1 H-score was 6.5 in pre-treatment samples and 35.0 in post-treatment samples, and the fold difference between these two measurements was 5.42 (p=0.163) (Fig. 4A). The results of analysis with another PD-L1 score (0-3) and PD-L1 positivity are shown in Fig. 4B and C. Despite the lack of statistical significance, more samples from post-treatment patients were positive for PD-L1 than samples from pre-treatment patients (3 [20.0%] vs. 0 [0.0%] patients, p=0.175).

Representative images of programmed cell death–ligand 1 (PD-L1) immunohistochemistry in non-small cell lung cancer patients (×400). PD-L1 score was graded as absent (score 0) (A), weak (score 1) (B), moderate (score 2) (C), or strong (score 3) (D). A score of 2 or 3 was deemed positive for PD-L1 expression.
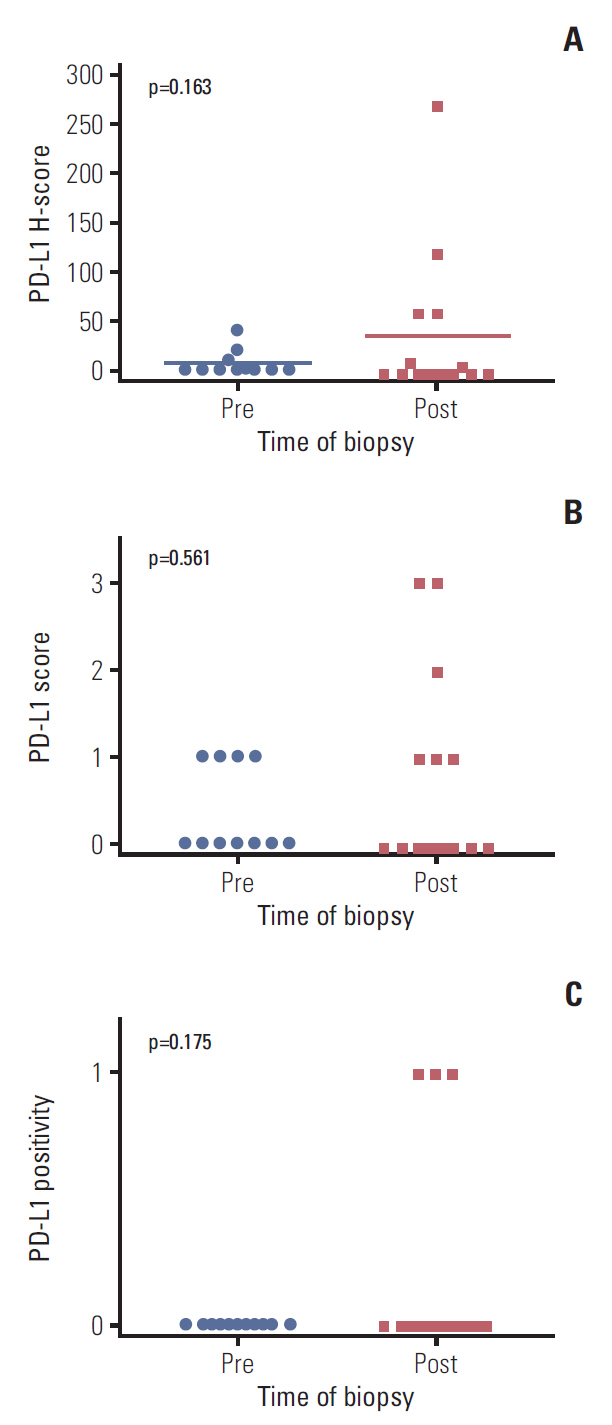
Changes in programmed cell death–ligand 1 (PD-L1) before and after crizotinib treatment in anaplastic lymphoma kinase–positive non-small cell lung cancer tumor tissues based on H-score (A), PD-L1 score (0, 1, 2, 3) (B), and positivity (C).
7. Comparison of expression of lymphocyte markers in TILs between pre- and post-treatment NSCLC tumor specimens
The mean numbers of CD68/mm2 were 181.6±115.4 in pretreatment tumor samples and 90.8±48.9 in post-treatment tumor samples (p=0.030). In addition, expression of CD3, CD8, and PD-1 tended to be lower in the post-treatment group compared to the pre-treatment group samples; however, this difference was not significant (S12 Table).
Discussion
To date, the associations or cross-talk between the oncogenic driver pathways in cancer cells and the immunoregulatory pathways, involving such players as PD-L1, have not been fully elucidated [16]. Recently Akbay et al. [17] reported activation of the PD-L1 pathway by activation of the EGFR pathway in EGFR-driven lung tumors, raising the possibility that other oncogenes may drive immune escape. Thereafter, upregulation of the PD-L1 pathway by ALK pathway activation was reported in ALK-positive NSCLC cells [6]. Based on these findings, we conclude that oncogenic driver signaling does not only have antitumor effects through inhibition of the tyrosine kinase pathway itself but also remodels the tumor microenvironment to induce immune tolerance.
In melanoma, several studies demonstrated an increase in PD-L1 expression in BRAF inhibitor-resistant cell lines [16,18,19]. Furthermore, Kakavand et al. [20] found that patient tumors that were positive for PD-L1 at baseline exhibited a significant decrease in PD-L1 expression during progression, whereas patient tumors that were negative for PD-L1 expression at baseline exhibited a significant increase in PD-L1 expression during progression when treated with BRAF inhibitor.
Although obtaining a biopsy of melanoma tumor tissue is easier due to the availability of the cutaneous location, obtaining biopsies from metastatic lung cancer tissues are difficult. Accordingly, reports comparing tumor tissue before and after treatment with chemotherapeutic agents have been rare for lung cancer. Recently, PD-L1 expression was reported to be markedly increased in a subset of patients with EGFR-mutant NSCLC after gefitinib treatment [15]. Gainor et al. [21] reported PD-L1 expression was 47% in the crizotinib-naïve setting (n=19) and 25% among crizotinib-resistant patients (n=12) in a retrospective parallel cohort of patients with metastatic ALK-rearranged NSCLC, which was not significant (p=0.500). And in a crizotinib-resistant cell line, DFCI076 which was from pleural effusion from a patient who had developed acquired resistance to crizotinib, PD-L1 expression was reported to be increased [22].
To tell the mechanism how PD-L1 is increased after ALK resistance, one explanation could be that with ALK inhibitor resistance, ALK inhibition becomes not effective so ALK activity can be restored and accordingly PD-L1 can be activated again. Otherwise it can be explained with change of the immune system. Recently increased tumor mutational load was related to decreased efficacy of EGFR tyrosinekinase inhibitor in EGFR-mutated lung cancer [23]. When resistance to ALK inhibitor is acquired, tumor might get more mutational burden and more immunogenicity. Because of the dynamic and complex properties of immune system, to further explain the mechanism of resistance of ALK inhibition related to the PD-1/PD-L1 pathway, serial biopsies are needed in the patients who receive ALK inhibitor therapy, before ALK inhibitor treatment, early during treatment, and at progression [20].
Our RNA sequencing results revealed that the gene expression profiles differed between the parental cells and the cell lines from the single- and double-resistant groups. Moreover, the R1 and R2 groups were distinct according to clustering analysis, and the differences (fold changes) tended to be greater in the double-resistant group. The direction and the degree of gene expression changes between the single-resistance and the parental cells were reproducible by the comparison of the double-resistant cell lines and the parental cells, indicating the validity of these results.
Among the top 20 differentially expressed genes in the R1 or R2 groups compared to the H3122 parental cell line, the majority of the genes were associated with the immune system (S2 Fig.). OR2W1 exhibited a log2 fold change of > 16 in both groups. OR2W1 is reportedly upregulated following 48-h asbestos exposure in lung cancer cell lines [24]. PGLYRRP4 is related to immune homeostasis and is induced in response to bacterial infection, limiting the innate immune response and preventing excessive inflammation [25]. GO annotations related to CCL20 include cytokine activity and chemokine activity, and several reports demonstrated the relationship between this gene and aggressive tumor behavior [26], tumor-promoting macrophages, regulatory T cells, myeloid-derived suppressor cells, and the epithelial-mesenchymal transition [27]. DEFB4 has been reported to be associated with immune response in NSCLC [28]. Lymphotoxin β (LTB) was reported to act as one of the central mediators in liver cancer formation with chronic liver injury [29]. Recently, utilization of the LTB pathway was described as a novel strategy to overcome resistance to PD-L1 blockade [17]. Meanwhile, S100A8 was found to be increased in PD-L1-upregulated pancreatic cancers [30].
In the analysis of biologic processes and pathways, several pathways related to the immune system, cancer, and extracellular matrix-receptor interactions were identified. Taken together, Our RNA seq data indicate that resistance to ALK inhibitors in NSCLC is related to the immune system, several cancer pathways, and the epithelial-mesenchymal transition. To elucidate the association and causal relationship further research is warranted.
Our study with patients’ tumor specimen was performed retrospectively and pre- and post-treatment tumor specimens were non-paired. Despite the difference was large (5.42-fold difference), small sample size would have underpowered the dataset and potentially contributed to the lack of statistical significance. To overcome these limitations, we conducted in vitro experiments through various methods and the outcomes were consistent. And experiments in cell lines even showed that as the resistance became more profound, PD-L1 became more potently expressed.
Despite shortcomings, this study is one of the first report on alterations in PD-L1 expression related to resistance to ALK inhibitors in ALK-positive NSCLC patients. Thus, this study is expected to provide the foundation for further investigations of the role of PD-1/PD-L1 pathway in resistance to target agents.
In conclusion, PD-L1 expression was consistently increased after acquisition of resistance to ALK inhibitor in lung cancer specimens and cell lines. Thus, the PD-1/PD-L1 pathway is associated with resistance to ALK inhibitors in ALK-rearranged NSCLC. Future studies will further examine the relationship between the PD-1/PD-L1 pathway and ALK inhibitor resistance.
Electronic Supplementary Material
Supplementary materials are available at Cancer Research and Treatment website (http://www.e-crt.org).
Notes
Conflict of interest relevant to this article was not reported.
Acknowledgements
We would like to thank Myungseop Shin for his help of analysis of RNA sequencing. This study was supported by a grant of the Korean Health Technology R&D Project, Ministry of Health and Welfare, Republic of Korea (HI14C0069) and by the SNUH Research Fund (0420150250, 2015-1102).