Trends in the Aggressiveness of End-of-Life Care for Advanced Stomach Cancer Patients
Article information
Abstract
Purpose
It is important to balance the appropriateness of active cancer treatments and end-of-life care to improve the quality of life for terminally ill cancer patients. This study describes the treatment patterns and end-of-life care in terminal gastric cancer patients.
Materials and Methods
We retrospectively analyzed the records of 137 patients with advanced gastric cancer receiving chemotherapy and dying between June 1, 2006 and May 31, 2011. We recorded interval between last chemotherapy dose and death; frequency of emergency room visits or admission to the intensive care unit in the last month before death; rate of hospice referral and agreement with written do-not-resuscitate orders; and change in laboratory values in the last three months before death.
Results
During the last six months of life, 130 patients (94.9%) received palliative chemotherapy; 86 (62.7%) during the final two months; 41 (29.9%) during the final month. During the final month, 53 patients (38.7%) visited an emergency room more than once; 21 (15.3%) were admitted to the intensive care unit. Hospice referral occurred in 54% (74 patients) of the patients; 93.4% (128 patients) gave written do-not-resuscitate orders. Platelets, aspartate aminotransferase and creatinine changed significantly two weeks before death; total bilirubin, one month before; and C-reactive protein, between four and two weeks before death.
Conclusion
Our results demonstrated that a significant proportion of gastric cancer patients received palliative chemotherapy to the end of life and the patients who stopped the chemotherapy at least one month before death had a lower rate of intensive care unit admission and longer overall survival than those who sustained aggressive chemotherapy until the last months of their lives.
Introduction
Despite recent advances in early detection and treatment, cancer remains a leading cause of death in most countries [1]. For terminally ill patients, the primary goal of end-of-life care is to achieve the best possible quality of life, including adequate pain control, relief of psychological, social, and spiritual distress and support for the patients to live as actively and comfortably as possible until death [2]. Indicators of the quality of end-of-life care include: interval between last chemotherapy dose and death; frequency of emergency department visits; number of hospital and intensive care unit (ICU) days near the end of life; and proportion of patients enrolled in hospice [3].
It is important to distinguish between terminally ill cancer patients who die as a result of the cancer itself and those who die from complications of cancer treatment [4]. Balancing the appropriateness of active cancer treatments and end-of-life care is necessary to improve the quality of life as well as to improve the allocation of resources from a socioeconomic aspect. Despite this, a significant proportion of patients still receive aggressive cancer care up to the last month of life [5,6].
Gastric cancer ranks second in causes of death from cancer, with 700,000 confirmed deaths annually and is more prevalent in East Asia, Eastern Europe, and Central and South America [7,8]. Chemotherapy remains the mainstay of treatment [9]. However, because of poor response rates and the toxic effects of palliative chemotherapeutic agents, as well as the high rate of peritoneal dissemination and liver metastasis, the quality of life in advanced gastric cancer patients is poorer than for other malignancies.
Therefore, the need to provide appropriately-timed cessation of chemotherapy and intervention in advanced gastric cancer patients is critical. The aim of this study was to describe the treatment pattern and end-of-life care in terminal gastric cancer patients in a single Korean oncology institution and to identify any changes suggesting approaching death for use as surrogate markers to define the time to stop aggressive treatment.
Materials and Methods
We designed a retrospective study of patients with advanced gastric cancer who received palliative chemotherapy and died between June 1, 2006 and May 31, 2011 in Seoul St. Mary's Hospital. The patients who did not received palliative chemotherapy and were managed only for symptom control and quality of life were designated as the best supportive care group, so they were excluded from the analysis. We reviewed each patient's medical records as well as determining whether the patients died and the death dates from the death registration database of the Korea National Statistical Office.
To understand the aggressiveness of end-of-life care, we examined the following: 1) interval between last chemotherapy dose and death; 2) frequency of emergency room (ER) visits or admission to the ICU in the final month prior to death; 3) rate of hospice referral and agreement with written do-not-resuscitate orders; and 4) changes in laboratory values in the last three months before death. Our goal was to find objective factors suggesting approaching death as surrogate markers to define the time to stop aggressive treatment. We also compared the differences in the end-of-life care between the patients receiving chemotherapy up to the final month of their lives and the patients stopping chemotherapy in at least one month before death.
Median and ranges were used as descriptive statistics. We used the unpaired t-test, κ2 test, and log-rank test for comparisons between non-categorical data. We used repeated measures ANOVA and the Bonferroni correction for multiple comparisons to analyze the specific period of changes in laboratory values. We used SPSS ver. 18.0 (SPSS Inc., Chicago, IL) for all statistical analyses.
We obtained ethical approval for this study from the institutional and university human ethics review committees. Informed consent was waived because of the characteristic as a retrospective chart review of this study.
Results
We identified 157 patients with advanced gastric cancer who died in Seoul St. Mary's Hospital between June 1, 2006 and May 31, 2011. Of those, 137 (87.26%) received palliative chemotherapy (Fig.1).
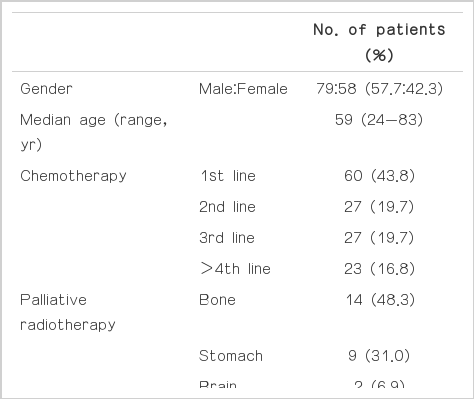
Table 1 shows the baseline characteristics of the patients. Seventy-nine patients were men, with a median age of 59.0 years (range, 24 to 83 years). Sixty patients (43.8%) received first-line chemotherapy; 27 (19.7%) received second-linechemotherapy; 27 (19.7%) received third-line; and 23 (16.8%) received over fourth-line. A total of 137 patients received palliative chemotherapy; 29 received palliative radiotherapy; and five received palliative surgery for symptom control.
1. Indicators of aggressive care
Fig. 2 shows the periods between the last chemotherapy day and death. Among the 137 patients, 130 patients (94.9%) received palliative chemotherapy during the last six months of life. Eighty-six patients (62.7%) received palliative chemotherapy during the last two months and 41 (29.9%) during the final month. Thirteen patients (9.5%) died within two weeks and seven patients (5.1%) died within two within one week after receiving chemotherapy. The median period between the start of the last continued round of chemotherapy and death was 51.0 days (range, 1 to 365 days). Physicians ordered completely new chemotherapy regimens a median of 84.0 days (range, 1 to 637 days) before death (Table 2). The median number of cycles that the patients received was 6.5 (range, 1 to 40) (Table 2).
2. Status of end-of-life care
Fifty-three patients (38.7%) visited an ER more than once during the final month and 21 (15.3%) were admitted to the ICU during the final month (Table 2). Of the 137 patients, 54% (74 patients) were referred to hospice and 93.4% (128 patients) authorized written do-not-resuscitate orders.
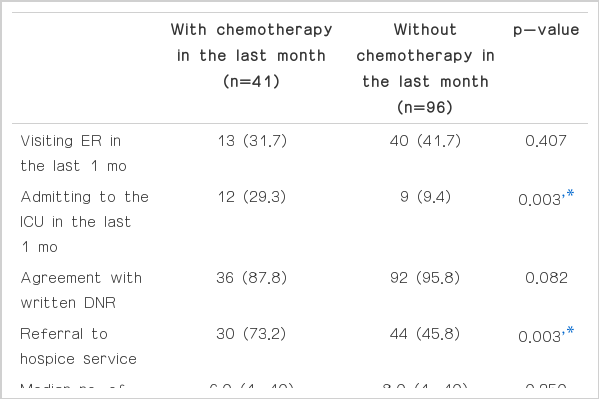
Table 3 shows the comparison of the end-of-life care in the final month between patients with chemotherapy and without chemotherapy. The patients receiving chemotherapy during the final month were more frequently admitted to the ICU in the final month (29.3% vs. 9.4%, p<0.01). There were no statistical differences between the groups for the proportion of ER visits, agreement with written do-not-resuscitate orders and hospice referral. However, the median overall survival was longer in the best supportive care group than in the group receiving chemotherapy in the final month (124 days vs. 239 days, p<0.01).

Comparison of end-of-life care between the group receiving chemotherapy even in the last month and the group without chemotherapy at least 1 mo before death
We also analyzed the proportion of patients receiving invasive procedures for symptom palliation. The proportion of the patients receiving an intraperitoneal drainage catheter was 34.4% in the final month; intrapleural drainage catheter, 16.1%; percutaneous transbiliary drainage catheter, 21.9%; percutaneous nephrotomy, 4.4%; and gastrointestinal stent, 10.2%.
3. Changes in laboratory values
Seven of the ten laboratory factors changed significantly during the last three months (Table 4). The mean white blood cellcount increased significantly from 7.6×10⁹/L to 11.46×10⁹/L (p=0.013) between three months before death and near death. Platelets decreased from 211.31×10⁹/L to 100.3×10⁹/L (p<0.01); creatinine increased from 76.91 µmol/L to 161.77 µmol/L (p=0.013); total bilirubin increased from 11.63 µmol/L to 70.28 µmol/L (p<0.01); aspartate aminotransferase increased from 75.28 U/L to 349.32 U/L (p=0.012); albumin decreased from 33.1 g/L to 25.5 g/L (p<0.01); and C-reactive proteinincreased from 37.52 nmol/L to 133.34 nmol/L (p<0.01) within three months before death.
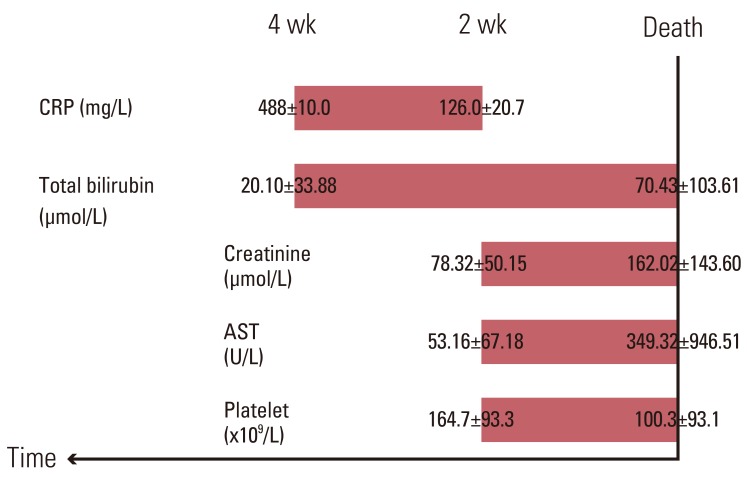
We used the Bonferroni correction for multiple comparisons to determine which specific period in the three months before death suggested that patients were worsening. Platelets significantly decreased during the two weeks before death (164.67×10⁹/L to 100.33×10⁹/L, p<0.01). Aspartate aminotransferase increased significantly from 53.16 U/L to 349.32 U/L (p=0.012) and creatinine significantly increased from 77.79 µmol/L to 161.77 µmol/L (p=0.013) in the two weeks before death. C-reactive protein significantly increased between one month and two weeks before death (48.78 mg/L to 125.56 mg/L, p<0.01) and total bilirubin increased significantly one month before death (20.01 µmol/L to 70.28 µmol/L, p<0.01) (Fig. 3).
Discussion
Our study described the treatment patterns and end-of-life care in terminal gastric cancer patients in a single Korean institution and changes in certain laboratory values near death.
Our results showed that 94.9% of gastric cancer patients received palliative chemotherapy in the last six months of life, very similar to the 96.6% result reported in a previous study targeting non-specified terminal cancer patients in Korea (94.6%) [5]. However, the proportion of terminal cancer patients receiving palliative chemotherapy in the last six months of life is much higher than in the United States where Emanuel et al. [10] reported a rate of 26-33% in 2003. The proportion of the use of palliative chemotherapy in metastatic or advanced solid cancer patients in the last two weeks of life has been decreasing (18.5% in North America in 2004, 8% in Australia in 2009, and 6% in Italy in 2011) [11-13]. However, in our study, the use of palliative chemotherapy in the last two weeks of life was 9.5%, still higher than in other countries. Additionally, the median days between the last chemotherapy day and death was 51.0 days in our study, shorter than previous results of 77.1 days in Korea in 2009 and 65.3 days in United States in 1996 [5,12]. Also, the median days between the start of the last chemotherapy regimen and death was 84.0 days in our study, also shorter than in United States in 1996 (127.7 days) [12]. Finally, 16.8% of stomach patients received fourth-line palliative chemotherapy in our institution.
The reasons for aggressive end of life care could be as follows: First, unique to East Asian culture [14], caregivers or the patient's family do not want the patient to know the exact state of their health for fear that the patient would lose hope and decline further treatment. Second, from the physician's viewpoint, recommending another course of chemotherapy is often easier than discussing cessation of chemotherapy and transition to palliative care [11]. Feelings of failure and frustration, as well as personal stressors, surround these matters [6]. Health care providers are more likely to be reimbursed for ordering chemotherapy than they are for engaging in complex, emotional, difficult and long conversations about end-of-life concerns [15]. Another possible explanation for the continuation of chemotherapy at the end of life is that there are no guidelines for the appropriate use of chemotherapy in advanced cancer patients with a short life expectancy. Oncologists are not accurate in predicting a patient's course or death and are generally overly optimistic, overestimating survival by at least 30% according to a recent meta-analysis [16]. Several reports provide a predictive model for survival in terminally ill patients with cancer, but none are used routinely. This study suggests an urgent need to create guidelines for the appropriate use of chemotherapy in terminally ill patients with cancer. Using changes in laboratory values near the end-of-life and the Bonferroni correction for multiple comparisons, we found that platelet counts, aspartate aminotransferase and creatinine changed significantly two weeks before death. Total bilirubin changed one month before death and C-reactive protein changed between four and two weeks before death (Fig. 3). Although these factors may not be adequate objective predictors of survival, they do provide evidence to support future research to determine when to discontinue chemotherapy near the end of life.
In the final month, 15.3% of patients visited ERs in our study, markedly lower than the percentage reported in 2002 (33.6%) in Korea. The hospice referral rate was 54.0% in our study compared with only 9.1% reported in Keam et al.'s study [5] and the percentage of patients agreeing to written do-not-resuscitate (DNR) orders was 93.4% in our study, compared with 11.7% in the study by Keam et al. [5]. In the final month, the best supportive care group had a lower rate of ICU admission than the aggressive chemotherapy group (p<0.01) and overall survival was significantly longer in the best supportive care group (p<0.01). There was no significant difference in the rate of hospice referral and agreement with DNR orders (Table 3). The recent expansion of a well-established hospice center and social awareness might explain this difference.
Our findings have certain limitations. First, this was a retrospective study and the reliability of our results depended on the accuracy and completeness of the patient records. Second, these results represent only a single center, so further validation is needed using large prospective studies. Nevertheless, to the best of our knowledge, this study is the first to evaluate the pattern of end-of-life care in terminal gastric cancer patients in a single institution.
Conclusion
In conclusion, our results demonstrated that a significant proportion of gastric cancer patients received palliative chemotherapy to the end of life and the patients who stopped the chemotherapy at least one month before death had a lower rate of ICU admission and longer overall survival than those who sustained aggressive chemotherapy until the last months of their lives.
Notes
Conflict of interest relevant to this article was not reported.


