Trends in Cancer Screening Rates among Korean Men and Women: Results from the Korean National Cancer Screening Survey (KNCSS), 2004-2010
Article information
Abstract
Purpose
The Korean National Cancer Screening Survey (KNCSS) is a continuous nationwide survey implemented by the National Cancer Center in Korea since 2004. The purpose of the present study was to report trends in cancer screening rates for the five major cancers (stomach, liver, colorectal, breast, and cervix uteri) in Korean men and women.
Materials and Methods
The study used KNCSS data collected between 2004 and 2010. The survey was conducted on Korean men aged 40-74 years and Korean women aged 30-74 years with no history of cancer diagnosis. The annual percentage change and corresponding 95% confidence intervals were used to examine changes in annual screening rates.
Results
Screening rates with recommendation increased by 4.4% annually for stomach cancer, 1.5% for liver cancer, 2.8% per year for colorectal cancer, 4.5% for breast cancer, and 1.2% for cervix uteri cancer. The increasing trend in cancer screening rates, with the exception of liver cancer, was significant.
Conclusion
Cancer screening rates have increased consistently from 2004 to 2010 among Korean men and women. Stomach and breast cancer screening rates in particular have increased markedly.
Introduction
Cancer is the leading cause of death in Korea, with approximately 178,000 people developing cancer annually and 70,000 deaths reported in 2008 [1]. The Korean government established the Comprehensive 10-Year Plan for Cancer Control in 1996 to reduce cancer burden at the national level. National cancer control programs were formulated and have been implemented since 1996. As part of these programs, guidelines for cancer screening programs were developed and initiated in 1999 [2].
Cancer screening of a population may be opportunistic, part of an organized program, or a combination of the two. The primary distinction between opportunistic and organized screening is that the target population is selected from centralized population registers in organized programs [3]. Organized screening programs have nationally implemented guidelines that define who should be invited to participate in screenings, how frequently they should be screened, and how abnormalities detected on screening should be followed up and treated. In contrast, with no central register, opportunistic screening depends on the decision of an individual to seek screening or on the recommendation of a health-care provider.
In Korea, both organized and opportunistic cancer screening programs have been widely used. The organized programs include the National Cancer Screening Program (NCSP) and the cancer screening services carried out by the National Health Insurance Corporation (NHIC) [4-6]. The NCSP for stomach, breast, and cervix uteri cancer was established in 1999 to increase access to cancer screening services for Medical Aid Program (MAP) recipients. Since 2002, the NCSP has gradually extended its target population to National Health Insurance (NHI) recipients. Liver cancer screening programs for a high-risk group were added to the NCSP in 2003, and colorectal cancer screening was implemented in 2004. Currently, the NCSP provides MAP recipients and lower than 50% of NHI recipients with free-of-charge screening services for the five most common cancers, which are stomach, liver, colorectal, breast, and cervical cancers. The upper 50% of NHI recipients not covered by the NCSP are enrolled in the organized cancer screening program run by the NHIC.
The aim of the present study was to report trends in overall screening rates among Korean men and women in opportunistic and organized cancer screening programs and to evaluate policies on cancer screening programs implemented at the national level to reduce the cancer burden.
Materials and Methods
The present study used Korean National Cancer Screening Survey (KNCSS) data from 2004 to 2010. The KNCSS is a continuous nationwide survey that has been conducted by the National Cancer Center since 2004. To obtain a nationally representative sample, the KNCSS study population was selected based on Resident Registration Population data using a stratified, multistage, and random sampling procedure according to geographic area, age, and gender.
Investigators from a professional research agency conducted face-to-face interviews in participant homes, except in 2004 when the data was collected using computer-assisted telephone interviews. The subjects in the present study were recruited by door-to-door contact, and at least three attempts to contact a resident at each dwelling were made. The response rates were 34.8-58.3% between 2005 and 2010. Informed consent was obtained from all study participants. General characteristics of the survey respondents for each year are shown in Appendix 1.
Eligibility was restricted to respondents with no history of a cancer diagnosis. The respondents were asked about their screening experience with the five common cancers, which were stomach, liver, colorectal, breast, and cervix uteri. The current recommended screening guidelines in Korea are the following: upper endoscopy or upper gastrointestinal (UGI) series every 2 years for gastric cancer; abdominal ultrasonography and serum α-fetoprotein every 6 months for liver cancer; fecal occult blood test (FOBT) every year, double-contrast barium enema every 5 years, or colonoscopy every 10 years for colorectal cancer; mammography every 2 years for breast cancer; and conventional cytology every 2 years for cervical cancer.
According to these guidelines, we limited our analyses to cancer-free men aged 40 years and over and women age 30 years and over. The gastric cancer screening survey participants were men and women aged over 40 years, and the subjects in the colorectal cancer survey were men and women over 50 years of age. Women over 40 were included in the breast cancer screening survey, and women over 30 were included in the cervical cancer survey. Liver cancer screening was restricted to high-risk groups such as people positive for the hepatitis B virus surface antigen, the hepatitis C virus antibody, or cirrhosis of the liver. Thus, the survey for liver cancer screening was performed in high-risk men and women over 40 years of age.
Questions were developed to assess the uptake of each of the five cancer screening programs. Previous cancer screening experience was assessed by asking participants: (a) whether they had ever been screened for a specific cancer by a screening modality, and (b) when they underwent their most recent screening. Screening rates were calculated from the proportion of men and women who responded 'yes' to question (a). 'Lifetime screening' was defined as ever having had a screening test and was derived from question (a) by collapsing across all types of screening tests. For 'screening with recommendation,' participants in the targeted age group for the relevant cancer who underwent screening were determined from the response to question (b) taking the cancer screening guidelines into consideration. Despite the 6-month interval for liver cancer screening, screening with recommendation was defined as a screening test performed within 1 year. Changes in the annual screening rates were assessed by calculating the annual percentage change and the corresponding 95% confidence intervals [7].
Furthermore, subgroup analyses by gender, age, and income level were performed. Income level was determined by monthly household income and classified into three groups by tertiles for each year. Liver cancer was excluded from the subgroup analyses because of too few subjects, and the data were not stable from year to year.
Results
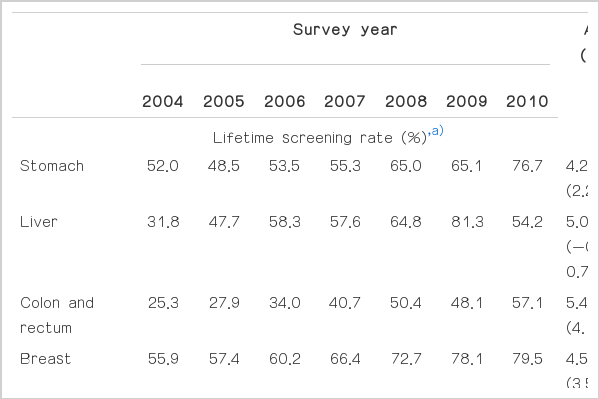
Screening with recommendation and lifetime screening rates increased steadily from 2004. Between 2004 and 2010, screening with recommendation rates increased annually by 4.4% for stomach cancer, 1.5% for liver cancer, 2.8% for colorectal cancer, 4.5% for breast cancer, and 1.2% for cervix uteri cancer (Table 1). We found a significant increase in the screening with recommendation rate for all types of cancer except liver cancer (Table 1). Trends in the screening rate differed according to the screening method. For example, stomach cancer screening using upper endoscopy increased more rapidly than screening using the UGI series (4.6% vs. 2.2% per year, respectively). The increase in the trend for colorectal cancer screening using the FOBT was steeper than that for overall colorectal cancer screening (3.5% vs. 2.8% per year, respectively).
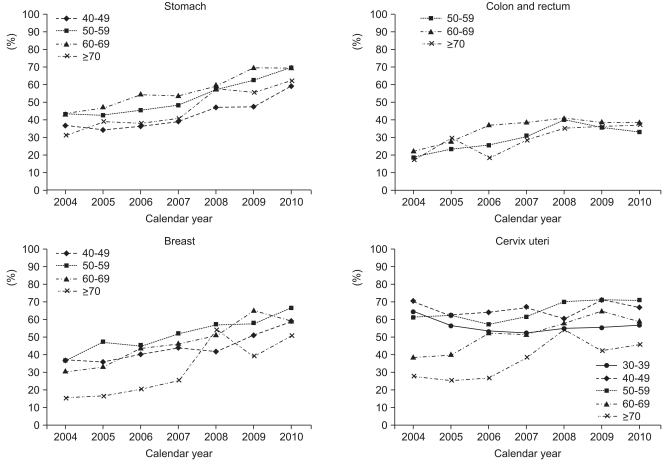
The trend in colorectal screening rates among men in the recommended screening population was slow in comparison to the increase in the gastric cancer screening rates. The trend in stomach and breast cancer screening rates among women in the recommended screening population increased steeply, but despite the high screening rate for cervix uteri cancer, the trend in the uptake of cervical cancer screening plateaued in recent years (Fig. 1). According to age groups, increasing trends in cancer screening rates for individuals in the recommended screening population were observed across the board, particularly in women aged 70 and over for breast cancer screening and in women aged 60 and over for cervical cancer screening (Fig. 2).
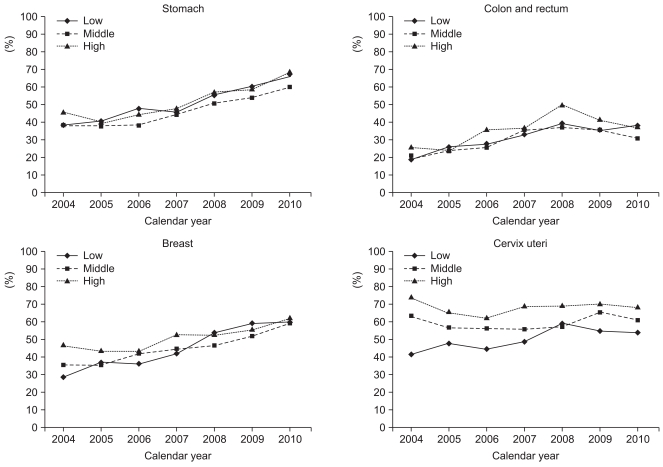
In 2004, the screening rates for stomach, colorectal, breast, and cervix uteri cancer among the screening with recommendation participants were lower in the low-income group than in the middle- and high-income groups. However, the increment in the screening rate was greater in the low-income group compared to the middle- and high-income groups, and by 2010, the screening rates were similar for all income levels (Fig. 3). An increase in the trend for cervix uteri cancer screening was observed only in low-income women.
Discussion
Screening rates for stomach, liver, colorectal, breast, and cervix uteri cancer have steadily increased since 2004. The screening rate for cervical cancer exceeded 60% in 2009 and those for stomach and breast cancer reached 61.1%, and 65.1%, respectively, in 2010. These rates are close to the 70% screening rate target of the Second-term 10-Year Plan for Cancer Control with recommendation in Korea [8].
In the United States [9,10], where screening is predominantly opportunistic, the breast cancer screening rate using mammography (women aged≥40 years) was 67% and the cervical cancer screening rate using the Pap smear test (women aged≥18 years) was 78% in 2005. The trend in breast cancer screening rose until 2000, remained stable until 2003, and fell slightly in 2005. The trend for cervical cancer screening rose until 2000 and then declined slightly.
In the United Kingdom, where nationwide organized screening programs have been implemented, 73.7% of women aged 45-74 years underwent mammography screening in 2008-2009, showing a slight increase from the 2007-2008 rates [11]. The 5-yearly coverage of cervical cancer screening using the Pap smear test was 78.9% in women aged 25-64 in 2009-2010 [12]. The coverage of cervical cancer continued to fall slightly from 80% in 2008-2009, particularly in women aged 50-64. This finding reflects a downward trend in screening uptake in this age group, and the first time coverage has fallen below the target of 80% in the United Kingdom.
According to a Japanese study [13], the screening rate for stomach cancer was 11.8% in 2007, showing a declining trend. The screening rate for cervix uteri cancer had declined since 1991, but recently increased to 18.8% in 2007. The screening rate for breast cancer increased dramatically in 2005 and showed a steadily increasing trend up to 14.2% in 2007. The screening rate for colon and rectal cancer in Japan increased by 0.5% per year and was 18.8% in 2007.
The National Cancer Control Plan in Korea has led to several improvements in cancer screening in addition to increasing participation in screening. First, socioeconomic disparities in the use of cancer screening programs have decreased from year to year. Second, an increasing number of Korean men and women in the targeted aged groups for the relevant cancers have undergone screening tests according to the recommendations. Although the influence of opportunistic screening cannot be ruled out, the introduction of the NCSP has played an important role in improving the use of screening in Korea.
The KNCSS conducted a nationwide survey to investigate participation rates in cancer screening for five kinds of cancers in Korea and reported the current status. However, this survey has several limitations. First, our results relied on self-reported data. Some tests may have been performed following a physician's order for other purposes because screening tools such as endoscopies are used not only for cancer but also for the diagnosis and follow-up of other diseases. Although survey data from self-reported interviews may have introduced a misclassification bias, many studies have shown the reliability of self-reported histories of cancer screening, which have been shown to agree well with medical records [14,15]. Second, although our response rates (34.8-58.3%) were acceptable in Korea [16,17], it may have nonetheless produced a non-response bias. In general, the preventative health behaviour patterns of survey participants may differ from those who refuse to participate [18]. For example, those with more interest in gastric cancer screening may have been more likely to participate in the survey.
Conclusion
The KNCSS is the ongoing systematic collection, analysis, and interpretation of data essential to the planning, implementation, and evaluation of nationwide cancer screening policies in Korea. These efforts will provide decision-makers with guidance for developing and implementing the best strategies to use in screening programs for cancer prevention and control in Korea.
Acknowledgments
This study was supported by a Grant-in-Aid for Cancer Research and Control from the National Cancer Center of Korea (#1010201-2).
Notes
Conflict of interest relevant to this article was not reported.
Appendices
Appendix 1
Distribution (%) of general characteristics of the study population in the Korean National Cancer Screening Survey (KNCSS) 2004-2010
| Survey year | |||||||
|---|---|---|---|---|---|---|---|
| 2004 | 2005 | 2006 | 2007 | 2008 | 2009 | 2010 | |
| Total (n) | 3,592 | 2,028 | 2,030 | 2,021 | 2,038 | 2,000 | 4,056 |
| Gender | |||||||
| Male | 42.4 | 41.0 | 40.2 | 39.4 | 40.6 | 41.0 | 41.4 |
| Female | 57.6 | 59.0 | 59.8 | 60.6 | 59.4 | 59.1 | 58.6 |
| Age (yr) | |||||||
| 30-39a) | 14.1 | 12.0 | 17.6 | 17.8 | 17.7 | 17.0 | 15.9 |
| 40-49 | 35.9 | 41.1 | 34.6 | 34.8 | 35.5 | 35.6 | 34.9 |
| 50-59 | 22.7 | 28.6 | 21.8 | 21.6 | 24.7 | 25.2 | 27.3 |
| 60-69 | 17.3 | 15.6 | 19.1 | 21.9 | 16.4 | 16.4 | 16.8 |
| ≥70 | 10.2 | 2.7 | 6.9 | 3.9 | 5.8 | 5.9 | 5.2 |
| Educationb) (yr) | |||||||
| ≤8 | 25.8 | 16.4 | 20.9 | 18.2 | 13.6 | 15.1 | 8.1 |
| 9-11 | 15.6 | 16.1 | 15.1 | 14.3 | 16.6 | 11.3 | 10.9 |
| 12-15 | 34.3 | 47.6 | 44.7 | 46.3 | 46.6 | 46.8 | 52.1 |
| ≥16 | 22.6 | 18.5 | 17.6 | 19.1 | 20.7 | 24.9 | 28.8 |
| Monthly household incomeb), ($)c) | |||||||
| ≤999 | 25.3 | 11.4 | 14.1 | 10.0 | 9.3 | 9.4 | 4.6 |
| 1,000-2,999 | 39.0 | 57.1 | 53.1 | 50.5 | 48.8 | 45.0 | 37.6 |
| ≥3,000 | 18.8 | 29.7 | 29.9 | 38.7 | 40.3 | 44.5 | 57.7 |
| Marital statusb) | |||||||
| Married | 88.2 | 92.8 | 89.6 | 89.8 | 90.3 | 90.2 | 91.5 |
| Not married | 1.6 | 2.1 | 2.2 | 2.8 | 2.5 | 3.6 | 3.0 |
| Otherd) | 9.5 | 5.1 | 8.3 | 7.4 | 7.2 | 6.3 | 5.5 |
| Residence area | |||||||
| Metropolitan | 46.8 | 47.4 | 47.4 | 47.5 | 46.5 | 46.6 | 44.3 |
| Urban | 53.2e) | 39.8 | 40.5 | 40.3 | 44.2 | 44.0 | 42.2 |
| Rural | 12.7 | 12.1 | 12.2 | 9.3 | 9.4 | 13.5 | |
| Health insurance typeb) | |||||||
| National Health Insurance | 90.8 | 95.8 | 94.5 | 96.7 | 95.9 | 95.3 | 96.5 |
| Medical Aid Program | 6.0 | 4.2 | 4.2 | 3.2 | 3.8 | 4.3 | 3.5 |
a)Restricted to women aged 30-39, b)Some data are missing, which is why row sums are not 100% every year, c)1 USD=1,000 KWN, d)Others: divorced or separated, e)The question related to residence area did not distinguish between urban and rural area in 2004.


