Changes in Gut Microbiome upon Orchiectomy and Testosterone Administration in AOM/DSS-Induced Colon Cancer Mouse Model
Article information

Abstract
Purpose
Sex hormones are known to affect the gut microbiota. Previously, we reported that endogenous and exogenous testosterone are associated with colorectal cancer (CRC) development and submucosal invasion. In the present study, we investigated whether the gut microbiota is affected by orchiectomy (ORX) and testosterone propionate (TP) administration using an azoxymethane/dextran sulfate sodium (AOM/DSS)-induced CRC mouse model.
Materials and Methods
Gut microbiota was evaluated by means of 16S rRNA gene sequencing of stool DNA extracted from feces that were obtained at 13 weeks after AOM injection (from 22-week-old animals) and stored in a gas-generating pouch.
Results
The increase in microbial diversity (Chao1 and Phylogenetic Diversity index) and Firmicutes/Bacteroidetes (F/B) ratio upon AOM/DSS treatment in ORX mice was significantly decreased by TP supplementation. The ratio of commensal bacteria to opportunistic pathogens was lower in the TP-administered females and ORX mice than in the AOM/DSS group. Opportunistic pathogens (Mucispirillum schaedleri or Akkermansia muciniphila) were identified only in the TP group. In addition, microbial diversity and F/B ratio were higher in male controls than in female and ORX controls. Flintibacter butyricus, Ruminococcus bromii, and Romboutsia timonensis showed similar changes in the male control group as those in the female and ORX controls.
Conclusion
In conclusion, testosterone determines the dysbiosis of gut microbiota, which suggests that it plays a role in the sex-related differences in colorectal carcinogenesis.
Introduction
Colorectal cancer (CRC) is the third leading cause of cancer death in both men and women in the United States, with an estimated 149,500 new cancer cases and 52,980 cancer-related deaths in 2021 [1]. Sex-specific differences in the incidence of CRC are observed worldwide [2,3]. Female sex hormones, especially estrogen, protect against colonic carcinogenesis [4,5]. The incidence of CRC in women is strongly associated with menopause [6]. Interestingly, sex hormones could regulate the composition of the intestinal microbiome [7]. Especially, estrogen regulates the intestinal microbial composition, and vice versa, the levels of estrogen are also affected by the gut microbiome [8]. Ovariectomy (OVX), which mimics postmenopausal women, changes the composition of the intestinal microbiome in mice and rats [9–11]. Furthermore, the levels of short-chain fatty acids (SCFAs), which are the main metabolites produced during the microbial fermentation in the large intestine, are strongly diminished in OVX rats compared to normal females [10]. In a mouse model for colitis-associated CRC, the richness and diversity of the composition of the gut microbiota were altered upon treatment with azoxymethane (AOM) and/or dextran sulfate sodium (DSS) [12–14]. However, little is known about the relationship between testosterone and the gut microbiota.
The gut microbiota plays a key role in maintaining the homeostasis of host immune. Dysbiosis of the intestinal microbiome is associated with gastrointestinal diseases, cancers, metabolic diseases, and immune disease [15]. Previous metagenomic analyses have suggested that patients with CRC have intestinal dysbiosis. There is an enhancement in the abundances of opportunistic pathogens, such as Fusobacterium nucleatum, Streptococcus bovis, S. galloliticus, Escherichia coli, and Bacteroides fragilis in patients with colorectal adenoma or CRC [16]; thus, they are considered as a possible factor for colon tumorigenesis [17]. In addition, F. nucleatum was abundant in CRC patients with metastasis, and the infection with F. nucleatum promotes metastasis in CRC by activating autophagy signaling via the upregulation of CARD3 expression in the several CRC mouse models, as well as, HCT116 and SW480 colon cancer cells [18]. Additionally, F. nucleatum promotes chemoresistance to 5-fluorouracil by upregulating the expression of BIRC3 in the HCT116 xenografted CRC mouse model, as well as, HCT116 and HT29 colon cancer cells [19].
Previously, we reported that 17β-estradiol inhibits CRC progression in AOM/DSS-treated male mice by regulating the protein expression of Nrf2 and antioxidant enzyme genes [20]. In addition, the intestinal microbial composition, Firmicutes to Bacteroidetes (F/B) ratio, and alpha diversity have also been found to be regulated by 17β-estradiol [11]. Interestingly, in an experiment involving orchiectomy (ORX), the presence of endogenous and exogenous testosterone was found to be associated with tumor development and submucosal invasive cancer [21]. Therefore, we hypothesized that testosterone could affect the gut microbiome composition, contributing to CRC progression. Thus, the aim of this study was to investigate the gut microbiome in the AOM/DSS-induced CRC mouse ORX model.
Materials and Methods
1. Mice
Seven-week-old male and female C57BL/6 mice were purchased from Koatech (Pyeongtaek, Korea). The mice were maintained in specific pathogen-free facilities with a 12-hour light/12-hour dark cycle at a controlled temperature of 23°C. All mice were randomly divided based on sex and housed in the same room in filter-top cages, with 3–5 mice per cage. The animals were marked with ear punches so that individual mice could be tracked for the duration of the experiment.
2. Surgical ORX and establishment of the CRC mouse model
The study design is illustrated in Fig. 1A. After adaptation for one week, the ORX group of male mice underwent surgical ORX after respiratory anesthesia using isoflurane (Hana Pharm. Co. Ltd., Seoul, Korea) at 8 weeks of age. TP supplementation was initiated on the day of the surgery. Female, male, and ORX mice were further divided into three subgroups: control group (CON), AOM/DSS-treated group (AOM/DSS), and AOM/DSS-treated+TP-supplemented (AOM/DSS+TP) group. C57BL/6 mice were classified into two categories: group 1, to study the effects of AOM/DSS treatment and TP administration; and group 2, to study the effects of sex and ORX, on the AOM/DSS-induced CRC mouse model (Fig. 1B) [21].
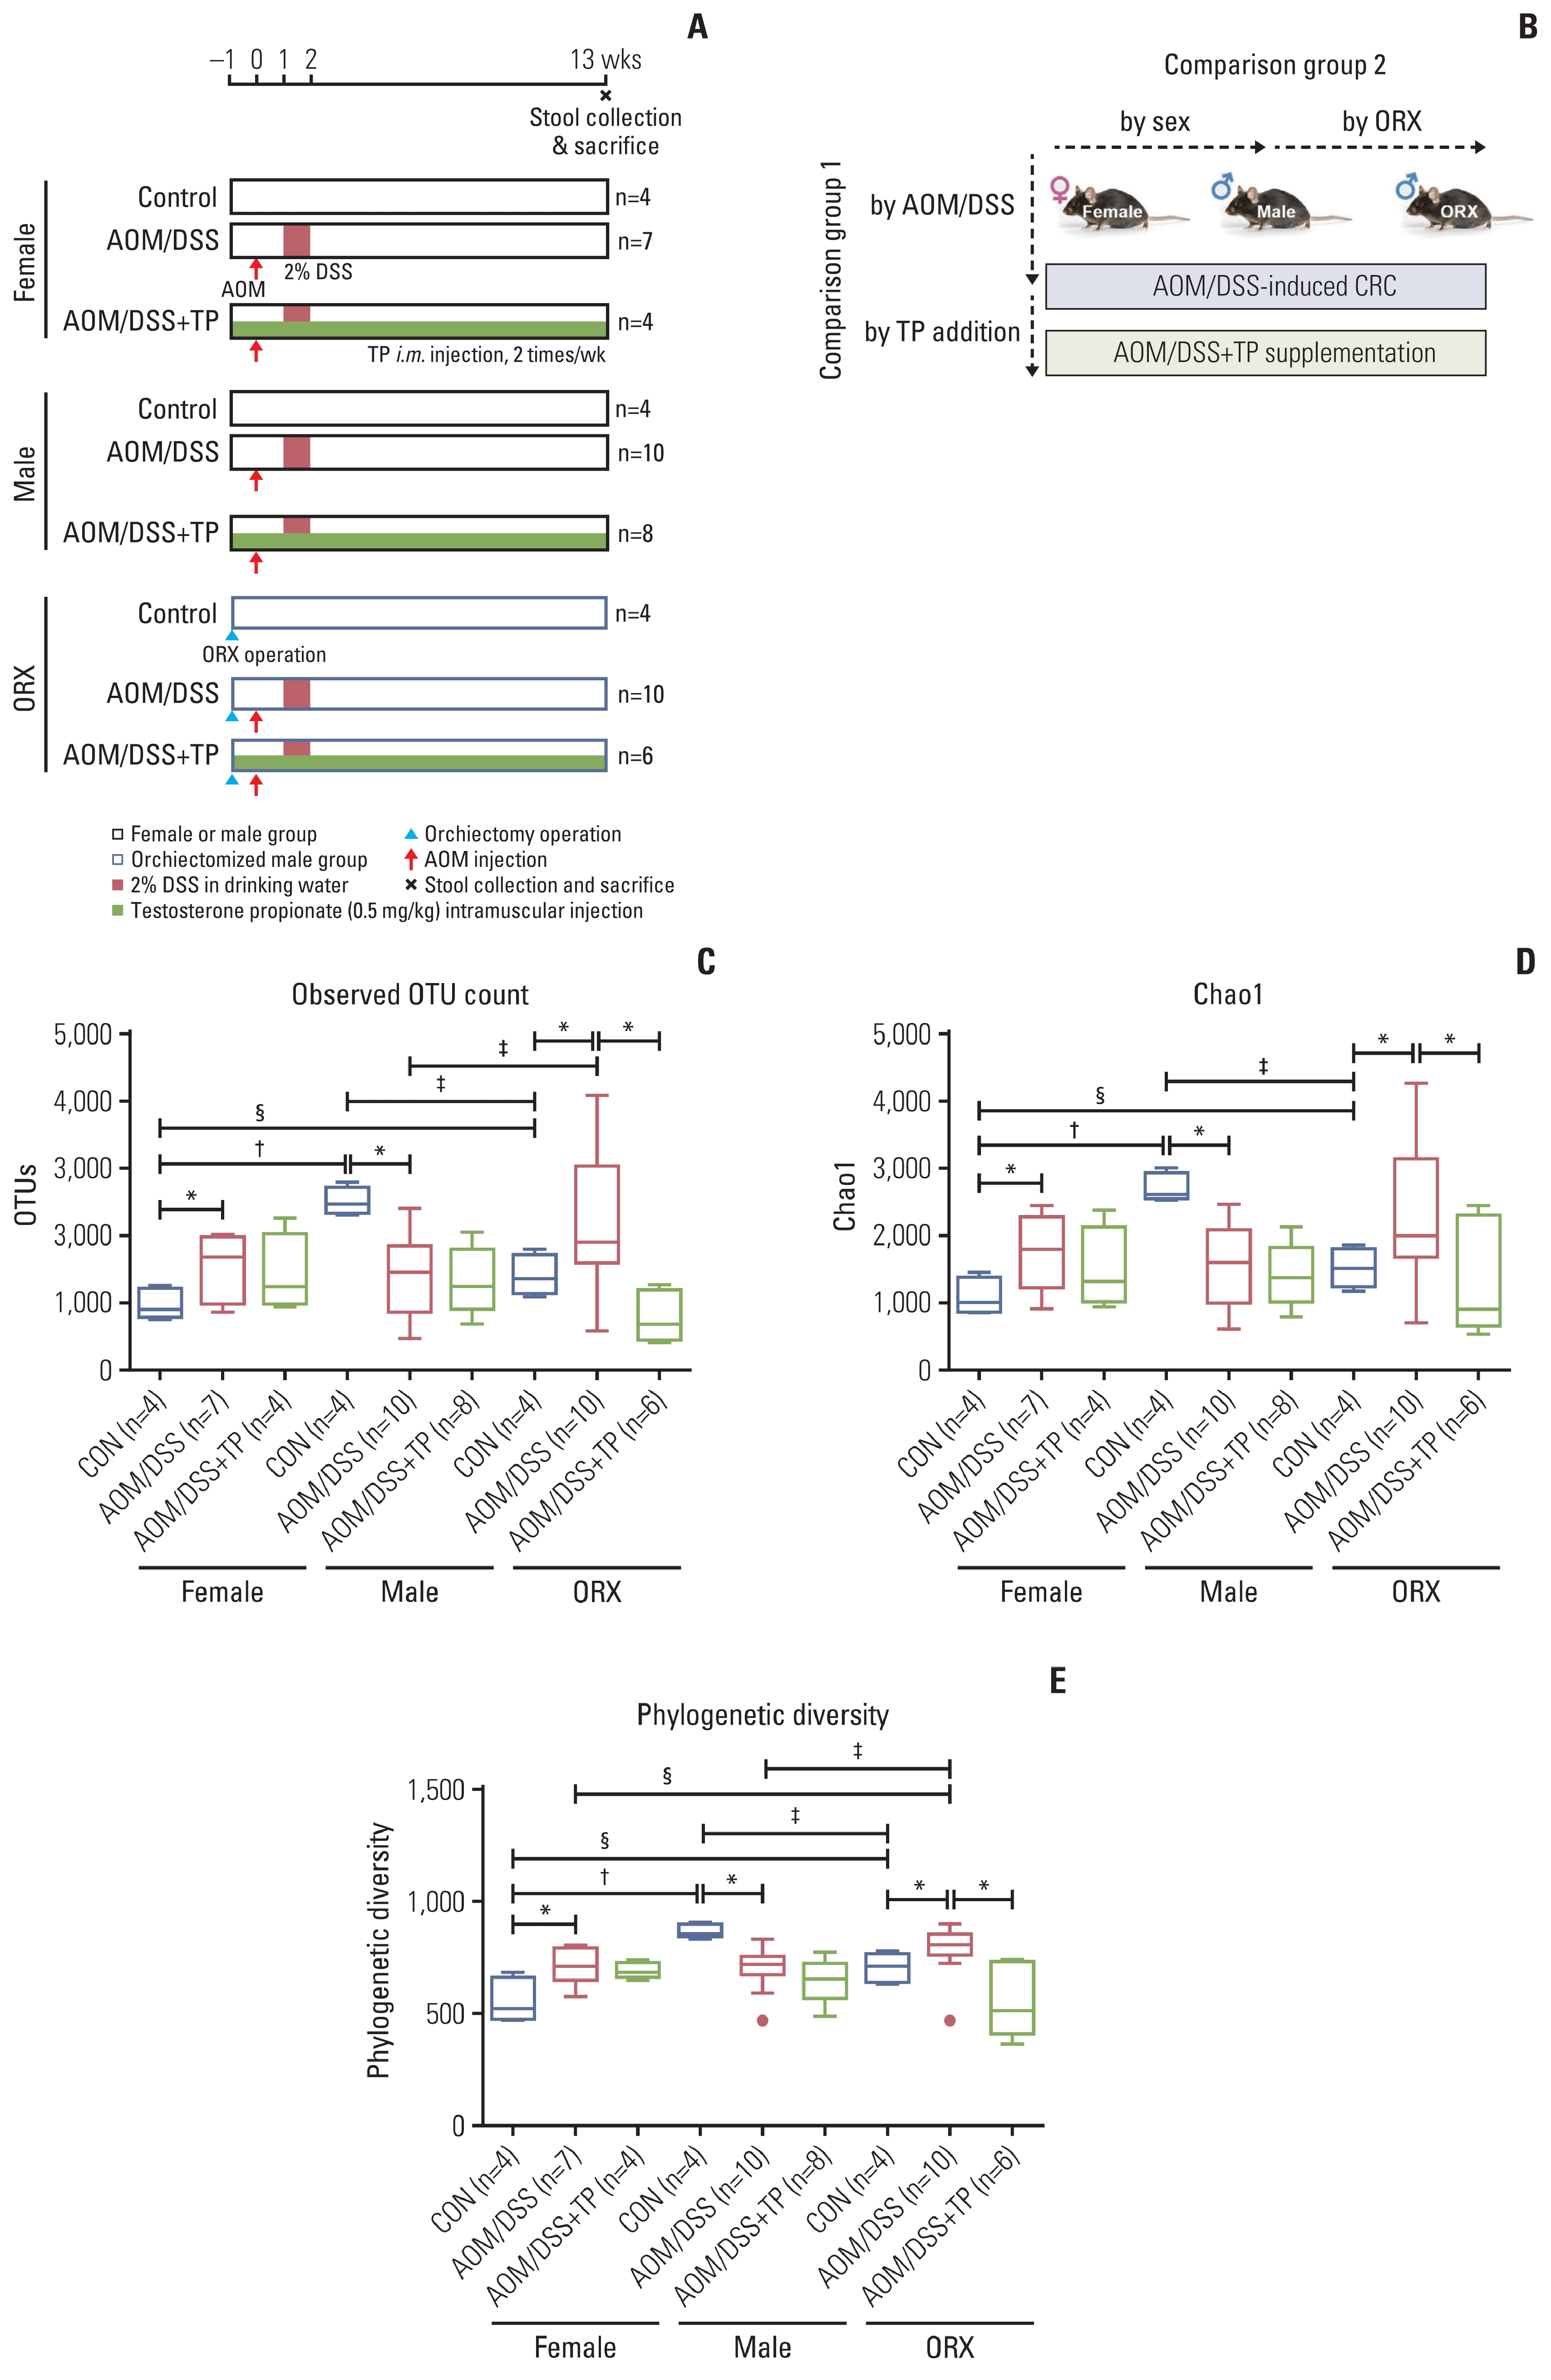
Study design to evaluate the effect of testosterone on gut microbiota composition during colon tumorigenesis. (A) Study design. Female, male, and orchiectomized mice were treated with AOM/DSS to induce colitis-associated CRC. One week after orchiectomy, all mice were enrolled in the AOM/DSS protocol. The mice were injected with AOM (10 mg/kg bodyweight) on day 0. One week after AOM injection, DSS (2% w/v) was provided in the drinking water for 1 week, followed by normal drinking water. TP was administered by intramuscular (i.m) injection twice a week from the day of surgery to the end of the experiment. Fecal collection and mouse sacrifice were performed at week 13 (22-weeks age) after AOM injection. (B) Data analysis scheme. In comparision group 1, the effects of AOM/DSS-induced CRC and TP addition in AOM/DSS group on the gut microbial composition was examined. In comparision group 2, the effects of male sex hormone on the gut microbial composition was examined. (C–E) Alpha diversity of gut microbiota. Next-generation sequencing was performed with 16S rRNA gene from mouse stool DNA. Observed OTU count (C), Chao1 as a species richness estimator (D), Phylogenetic Diversity as a phylogenetic richness estimator (E) of the intetinal microbiota in female, male, and ORX mice. Data are expressed as the mean±SEM. Whiskers show the minimum and maximum values. Mann-Whitney U test for comparison difference between independent two groups was performed. AOM, azoxymethane; CON, control; CRC, colorectal cancer; DSS, dextran sulfate sodium salt; ORX, orchiectomized; OTU, operational taxonomic unit; SEM, standard error of the mean; TP, testosterone propionate. *p < 0.05 for “CON vs. AOM/DSS” or “AOM/DSS vs. AOM/DSS+TP” in female, male, and ORX groups, †p < 0.05 for “Female vs. Male”, ‡p < 0.05 for “Male vs. ORX”, §p < 0.05 for “Female vs. ORX” in CON, AOM/DSS, and AOM/DSS+TP subgroups.
A method for constructing a CRC mouse model using AOM and DSS treatment has previously been described [21]. Briefly, AOM (catalog No. A5486; Sigma-Aldrich, St. Louis, MO) solution dissolved in phosphate-buffered saline was intraperitoneally injected at a dose of 10 mg/kg per mouse; this was considered as day 0 and the start date of the experiment. On the 7th day, 2% DSS (catalog No. 160110, MP Biomedicals, Solon, OH) solution was given in the drinking water for one week. In the AOM/DSS+TP group, TP (catalog No. T0028, Tokyo Chemical Industry Co. Ltd., Tokyo, Japan) was dissolved in olive oil and supplied twice a week by means of intramuscular injections (0.5 mg/kg) in a 50 μL volume; olive oil was administered to all other groups as a vehicle. Feces were freshly collected from the 57 individual mice. All fecal samples were immediately placed in a gas-generating pouch system (BD GasPak EZ Anaerobe Pouch System with Indicator, catalog No. 260683, Becton Dickinson and Company, Sparks, MD) to minimize fecal exposure to a high oxygen ambient atmosphere and stored in a 4°C refrigerator for 1 week. Mice were sacrificed by means of CO2 asphyxiation at week 13 (22-week-old) after AOM injection (Fig. 1A). Feces from the previous experimental sets [21] were also used for the current study.
3. Stool DNA extraction and next-generation sequencing of bacterial 16S rRNA gene
Genomic DNA was extracted from the fecal samples stored in gas-generating pouches at 4°C using an AccuPrep Stool DNA Extraction Kit (Bioneer, Daejeon, Korea), according to the manufacturer’s instructions. The bacterial 16S rRNA gene was amplified using polymerase chain reaction (PCR) with the primer pair 341F-805R [22], which amplifies the V3–V4 region. Interestingly, the number of valid reads was much higher in the current set, which used the gas-generating pouch system (S1B Fig.), than that observed in the previous set, which used the freezing system (S1A Fig.). The presence of the PCR products was confirmed using agarose gel electrophoresis. The PCR products were then purified using an AccuPrep PCR/Gel Purification Kit (Bioneer). The purified PCR products were tagged with Illumina indices and adapters using a Nextera XT Index Kit (Illumina Inc., San Diego, CA). Short DNA fragments were eliminated using the Accu-Prep PCR/Gel Purification Kit. The amplified PCR products were quantified using a PicoGreen dsDNA quantitation assay (Thermo Fisher Scientific, Wilmington, DE). After pooling the DNA (300 ng per sample), the PCR products were purified using the AccuPrep PCR/Gel Purification Kit. Quality assessment to confirm the integrity and product size of the DNA was conducted using a Bioanalyzer 2100 system (Agilent Technologies, Palo Alto, CA) with a DNA 7500 chip at ChunLab Inc. (Seoul, Korea). Next-generation sequencing was performed using the MiSeq platform (Illumina Inc.) at ChunLab Inc.
4. Sequencing data processing
The processing manual for the sequencing data has been previously described [22]. Briefly, low-quality (< Q25) read filtering and paired-end sequence data merging were performed using Trimmomatic 0.32 [23] and PANDAseq [24], respectively. Primers were then trimmed with ChunLab’s in-house program at a similarity cutoff of 0.8. Next, non-specific amplicons were identified, sequences were de-noised, and non-redundant reads were extracted using hmmsearch [25], DUDE-Seq [26], and UCLUST-clustering [27], respectively. EzBioCloud’s 16S rRNA gene database [28] using the USEARCH program [27] was used for taxonomic assignment. In addition, the EzBioCloud 16S rRNA gene database was used to detect chimeras for reads with a best hit similarity rate of less than 97%.
5. Alpha diversity
The rarefaction curve, which expresses species diversity by plotting the correlation between the sample data size and the number of operational taxonomic units (OTUs), is presented in S2 Fig. The rarefaction curves of OTUs were generated using BIOiPLUG, which is a commercially available ChunLab bioinformatics cloud platform for microbiome research. To avoid bias in the results, an analysis was performed after normalizing the reads to 102,344, the lowest number of valid reads across the entire sample. Alpha diversity indices, such as ACE, Chao1, Jackknife, Shannon, and Phylogenetic Diversity, were calculated using OTU information.
6. Beta diversity
The differences in the microbiome composition between the comparison groups were visualized using 2D and 3D principal coordinate analysis (PCoA). The grouping of the samples was explained based on principal coordinate values. Additionally, an unweighted pair-group method with arithmetic mean (UPGMA) tree was generated using BIOiPLUG (ChunLab Inc.). The distances of beta diversity, such as PCoA and UPGMA, were calculated using the generalized UniFrac method at the species level. Between-group significance was calculated using permutation multivariate analysis of variance (PERMANOVA).
7. Taxonomic composition
Stacked bar graphs were created to simultaneously view the microbiome distribution as taxonomic summaries at the phylum and family levels. Graphs were generated using Prism (ver. 5.01, GraphPad, San Diego, CA).
8. Taxonomic biomarker discovery
Based on their relative taxonomic abundance (%), we assessed the identification and significance of taxonomic biomarkers using the LEfSe (linear discriminant analysis effect size) method [29] at the species level, to identify testosterone-specific taxonomic biomarkers associated with sex and CRC severity. The steps carried out to perform LEfSe analysis were as follows: (1) alpha value of the factorial Kruskal-Wallis H test between the assigned taxa < 0.05; (2) alpha value for the pairwise Wilcoxon test among the taxonomic members < 0.05; (3) threshold of the logarithmic linear discriminant analysis score for discriminative features < 2.0; (4) a multi-class analysis set as all-against-all. Because of the large number of results of LEfSe analysis, the LEfSe plots were simplified and graphically presented as previously described [22]; (5) identification and classification of the bacterial characteristics based on previous reports as “commensal bacteria”, “opportunistic pathogens”, and “not characterized”; (6) removal of non-overlapping bacteria from the “not characterized” microbiome; and (7) inclusion of all commensal bacteria and opportunistic pathogens and the top 10 “not characterized” bacteria in the LEfSe plot.
9. Disease activity index
The method of calculating the disease activity index (DAI), which is used as an index to evaluate clinical symptoms, is well described in the previous reports [30,31]. In brief, in a blinded manner, two researchers scored the DAI by dividing the sum of weight loss, fecal bleeding, and stool consistency scores by three.
10. Histopathology
Briefly, colonic tissues separated into proximal and distal parts with any abnormal lesions were fixed with 4% paraformaldehyde solution. After paraffin embedding, each section was stained with hematoxylin and eosin. The colonic damage score was calculated as the sum of crypt damage and infiltration depth of inflammatory cells in the inflammatory phase (week 2) as previously described [32]. The identification of adenoma and cancer was blindly analyzed by a specialized histopathologist in the tumorigenesis stage (week 13) [33].
11. Statistical analysis
Statistical analyses were performed using PASW Statistics ver. 18 (SPSS Inc., Chicago, IL). More than two groups were compared based on the results of the Kruskal-Wallis H test. The two groups were then compared using the Mann-Whitney U test (also known as the Wilcoxon rank-sum test). A p-value < 0.05 was considered statistically significant. To adjust for multiple comparisons, corrected q-values for false discovery rate were calculated for a significance value of less than 5%.
12. Data availability
The raw unprocessed datasets of 16S rRNA gene, which were generated during the current study, are available with the NCBI Sequence Read Archive (SRA accession number PRJNA765478, https://www.ncbi.nlm.nih.gov/sra/PRJNA765-478).
Results
1. Effect of testosterone on colitis-associated symptoms and CRC progression in AOM/DSS-treated ORX mice
Previously, we have already reported the effects of TP on colitis-associated symptoms (at week 2) and CRC progression (at week 13) [21]. The DAI score, one of colitis-related symptoms, peaked at 2 weeks after AOM injection and gradually decreased thereafter (S3A Fig.). The DAI scores, which peaked 2 weeks after AOM injection, were significantly higher in male mice compared to ORX males or females (S3A Fig.). Interestingly, the further increase in DAI scores by TP supplementation was significant only in ORX males and females (S3A Fig.). Furthermore, AOM/DSS-induced crypt loss and inflammatory cell infiltration in colon tissues, as assessed by histopathological analysis, were exacerbated after TP supplementation in all groups (S3B Fig.). However, the male AOM/DSS+TP group showed a more severe trend compared to ORX males and females (S3B Fig.). As a result of histopathological analysis at week 13, the incidence of mucosal invasive adenocarcinoma was significantly high only in the male AOM/DSS group, and interestingly, there was an increase in submucosal invasive adenocarcinoma in all groups administered AOM/DSS after TP supplementation (S4 Fig.).
2. Effect of testosterone on the alpha diversity indices of the gut microbiome in AOM/DSS-treated ORX mice
First, the alpha diversity indices were analyzed accordingly in the “AOM/DSS and TP addition” group. The OTU count was significantly lower in the male AOM/DSS-treated mice, as compared to that observed in the male control mice (p=0.007) (Table 1, Fig. 1C), similar to the Chao1 and Phylogenetic Diversity indices (p=0.005 and p=0.005, respectively) (Table 1, Fig. 1D and E). In contrast, there was a profound increase in the OTU, Chao1, and Phylogenetic Diversity estimators upon AOM/DSS treatment in female and ORX mice, as compared to that in the controls (p=0.038 in females and p=0.048 in ORXs for OTUs; p=0.038 in females and p=0.048 in ORXs for Chao1; and p=0.038 in females and p=0.047 in ORXs for Phylogenetic Diversity) (Table 1, Fig. 1C–E). Upon AOM/DSS treatment, only the ORX group showed a significant decrease in the indices after TP administration (p=0.005 for OTUs, p=0.005 for Chao1, and p=0.007 for Phylogenetic Diversity), as compared to those in females or males without ORX (Table 1, Fig. 1C–E). Next, the alpha diversity indices were analyzed accordingly in the “sex and ORX” group. The female CON showed lower alpha diversity than the male controls (p=0.021 for OTUs, Chao1, and Phylogenetic Diversity in female controls vs. male controls) (Table 1, Fig. 1C–E). Interestingly, the ORX CON also showed a lower alpha diversity than the male controls, similar to that in the females (p=0.021 for OTUs, Chao1, and Phylogenetic Diversity in female controls vs. male controls) (Table 1, Fig. 1C–E). In the AOM/DSS-treated group, the observed sex-based difference in alpha diversity in the CON disappeared, and there was no difference between males and females upon TP supplementation (Table 1, Fig. 1C–E). Among male groups, some alpha diversity indices were different in the ORX AOM/DSS and AOM/DSS+TP groups; that is, the ORX AOM/DSS group showed higher levels of OTUs (p=0.049), Jackknife (p=0.049), and Phylogenetic Diversity (p=0.019), and the ORX AOM/DSS+TP group showed lower levels of ACE (p=0.039) than the males (Table 1). Taken together, changes in alpha diversity due to AOM/DSS treatment and TP administration in ORX mice showed a pattern similar to that in females. These results suggested that the differences in the gut microbiota between males and females are due to testosterone.
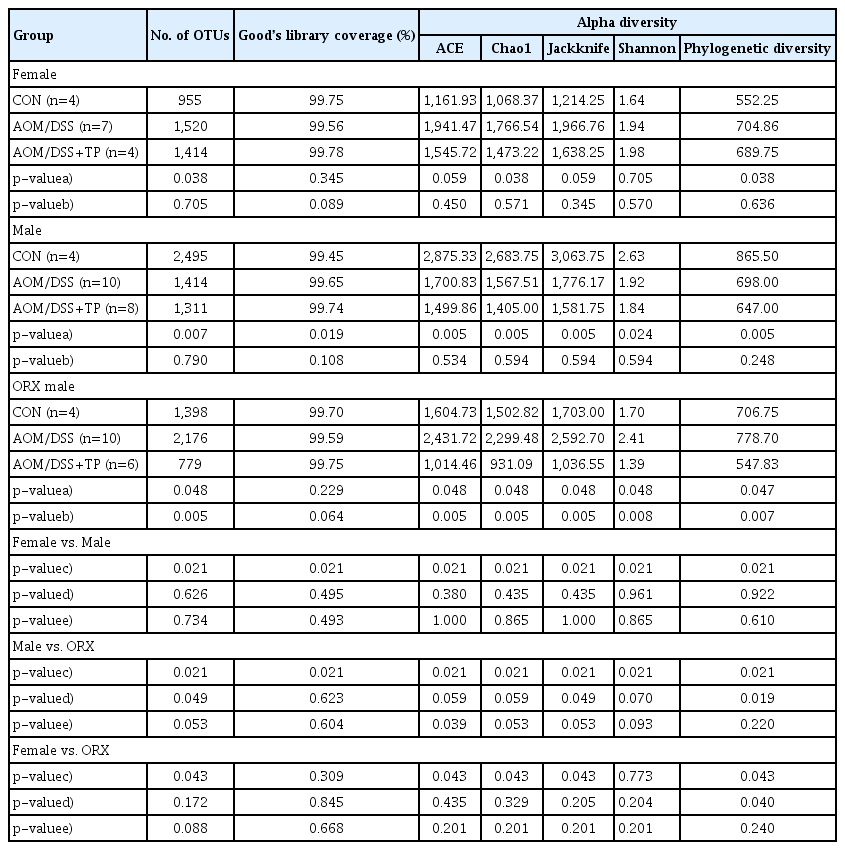
Alpha diversity of microbiota from fecal contents
3. Effect of testosterone on individual bacterial communities in AOM/DSS-treated ORX mice
Individual bacterial communities were examined using PCoA and UPGMA (Fig. 2, S5 Fig.). In the “AOM/DSS and TP addition” group, clustering was clearly separated upon AOM/DSS treatment, as compared to that in the control female (Fig. 2A and D), male (Fig. 2B and E), and ORX (Fig. 2C and F) mice. Furthermore, TP supplementation to the ORX AOM/DSS group clearly changed the clustering, as compared to that in the AOM/DSS group (Fig. 2C and F), whereas TP supplementation to the female and male AOM/DSS groups did not change the clustering (Fig. 2A, B, D and E). PERMANOVA results for 2D PCoA revealed that beta diversity representing individual bacterial communities differed significantly between the control, AOM/DSS, and AOM/DSS+TP groups in female (p=0.022), male (p=0.032), and ORX (p=0.001) mice (Fig. 2A–C). Next, in the “sex and ORX” group, clustering was clearly separated by sex and ORX in the CON (Fig. 2G and J). However, there was no difference between males and females in both the AOM/DSS and AOM/DSS+TP groups, and only the ORX group was separated from the male and female AOM/DSS (Fig. 2H and K) and AOM/DSS+TP (Fig. 2I and L) groups. PERMANOVA results for 2D PCoA revealed that beta diversity differed significantly between female, male, and ORX mice in the control (p=0.002), AOM/DSS (p=0.014), and AOM/DSS+TP (p=0.001) (Fig. 2G–I) groups. The UPGMA results also showed a clustering pattern similar to that of PCoA (S5 Fig.). Taken together, it was confirmed that only the ORX group was affected upon testosterone administration and segregated differently in the males and females.
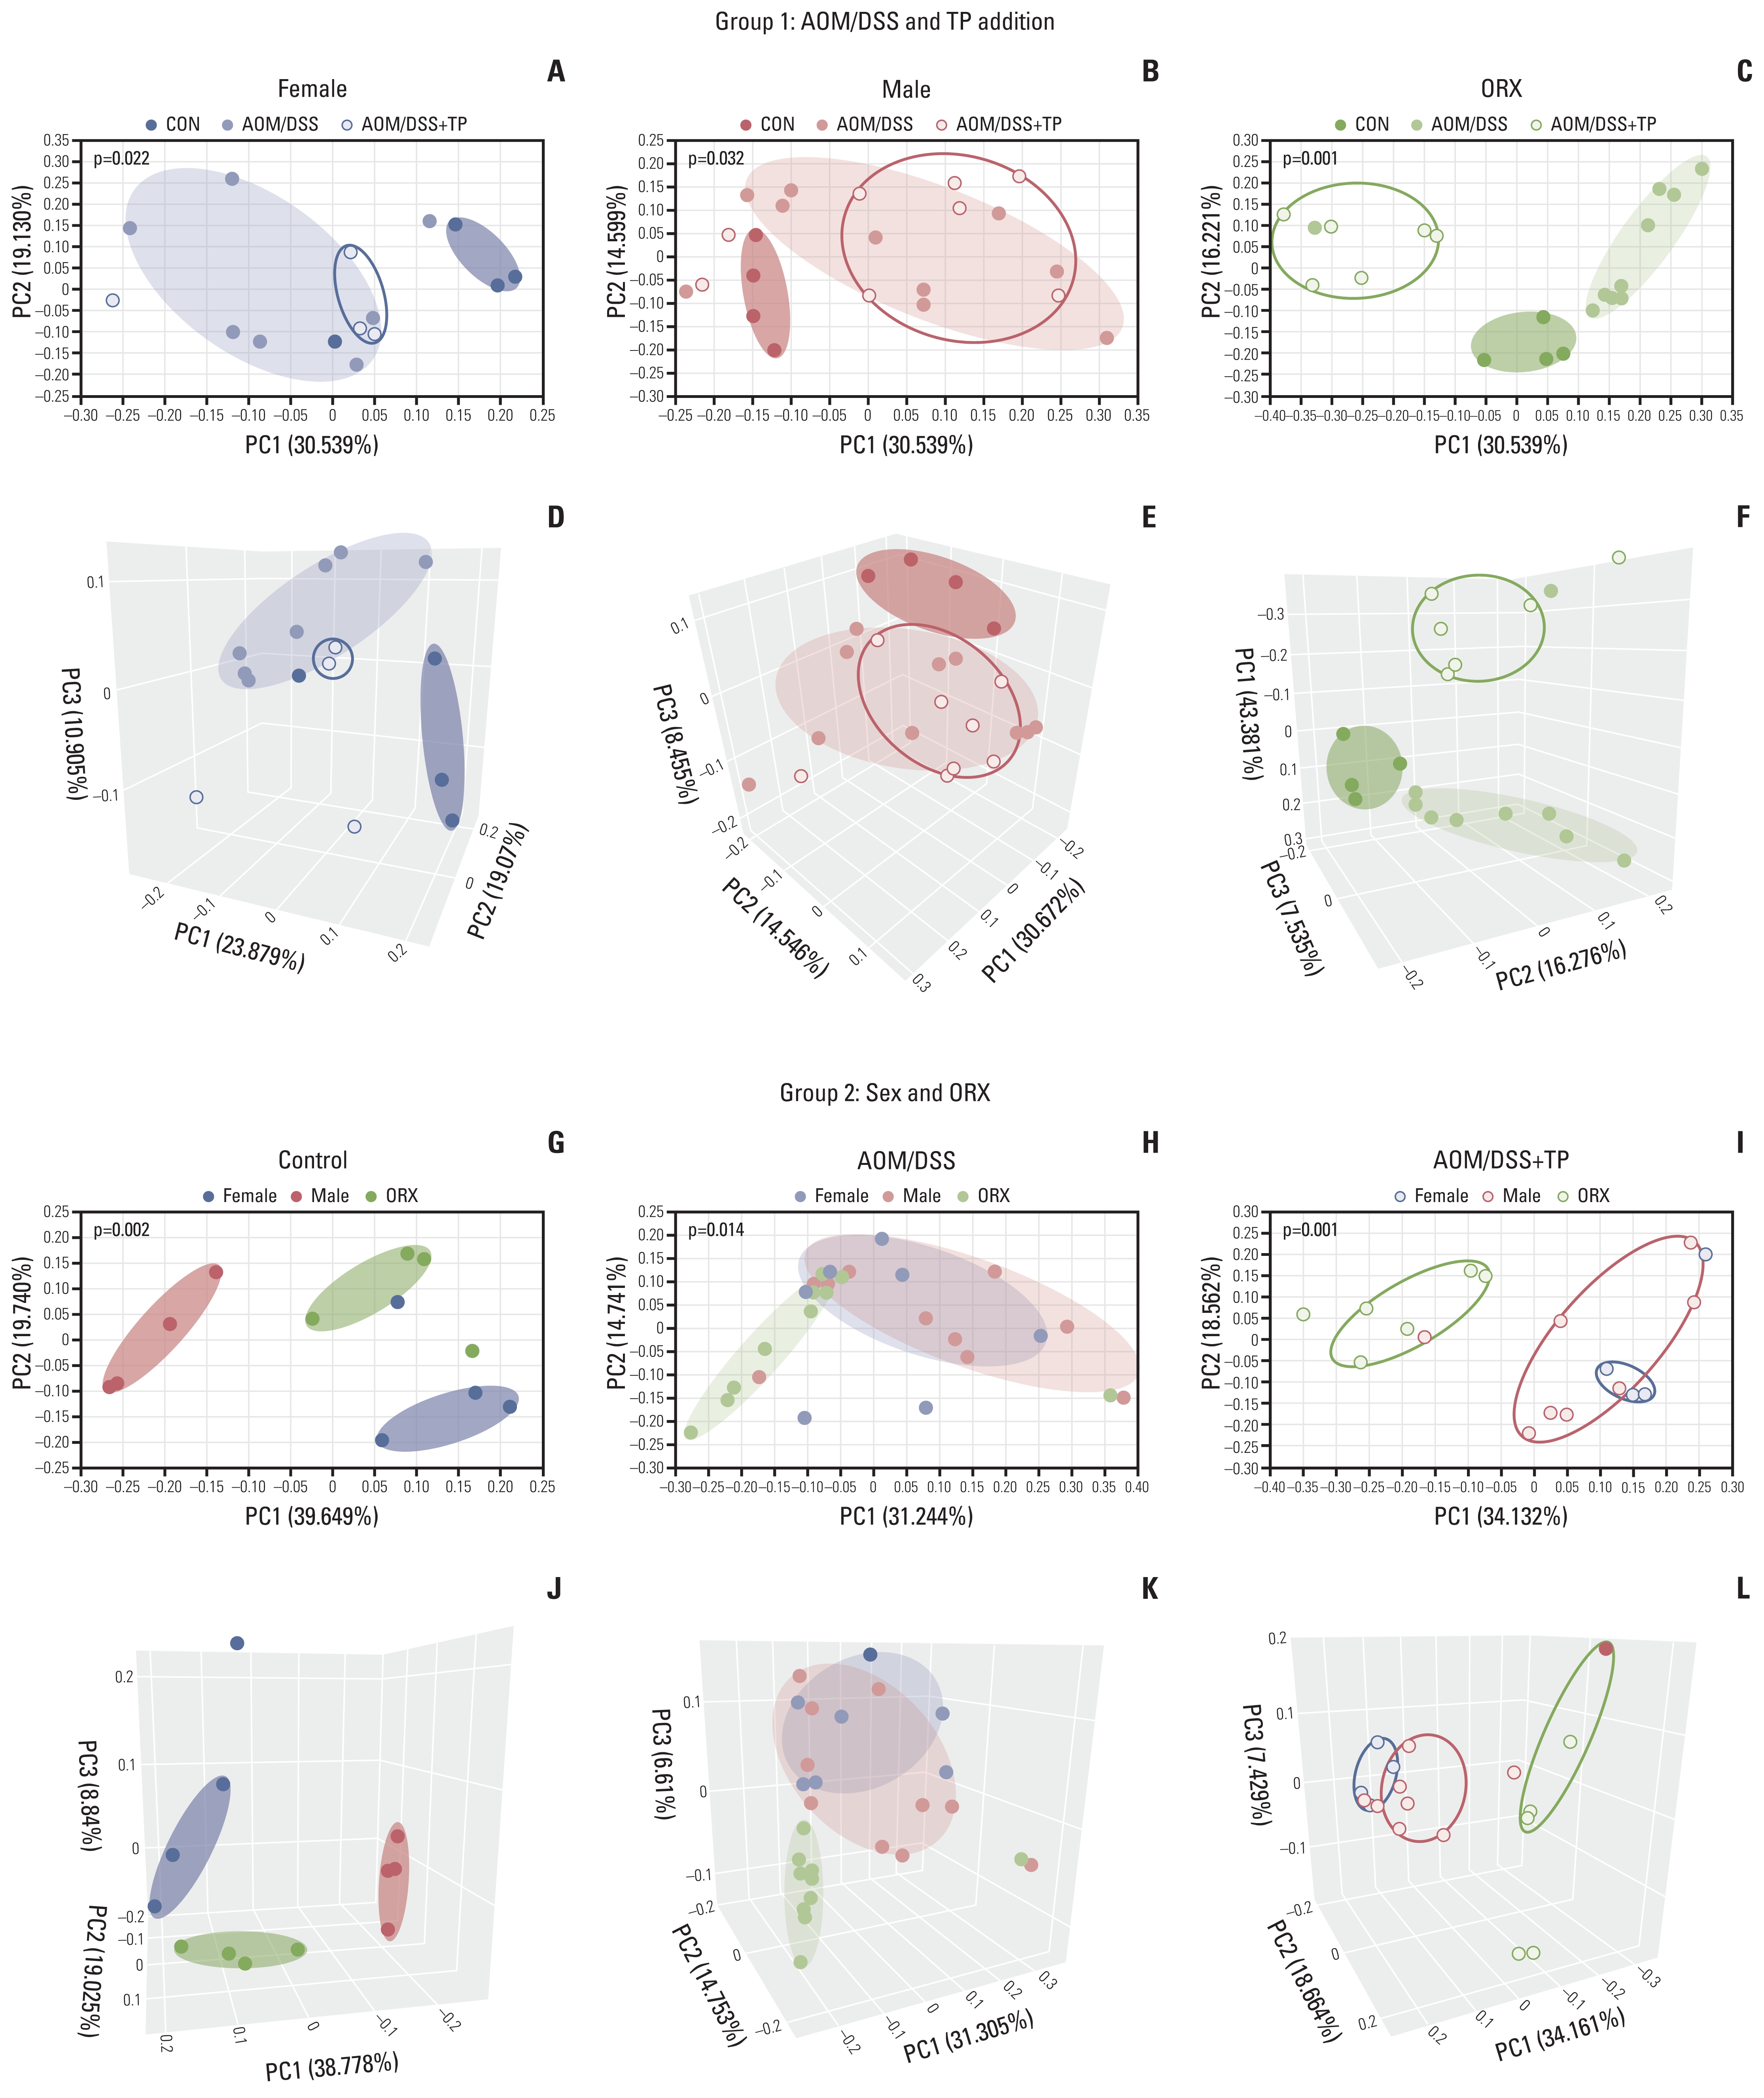
Sample clustering by UniFrac-based PCoA at the species level. (A–F) Clustering to see the difference between control, AOM/DSS, and AOM/DSS+TP in female (A, D), male (B, E), ORX (C, F) group samples by PCoA 2D (A–C) and 3D (D–F) plot. (G–L) Clustering to see the difference between female, male, and ORX in control (G, J), AOM/DSS (H, K), and AOM/DSS+TP (I, L) subgroup samples by PCoA 2D (G–I) and 3D (J–L) plot. Group 1 and group 2 samples were clustered using the Generalized UniFrac method at the species level. Significance for similarity of bacterial population structure was analyzed by PERMANOVA. The clustering of each group is marked with a different color: Female control, filled red ellipse; Female AOM/DSS, filled pink ellipse; Female AOM/DSS+TP, blanked red ellipse; Male control, filled blue ellipse; Male AOM/DSS, filled skyblue ellipse; Male AOM/DSS+TP, blanked blue ellipse; ORX control, filled green ellipse; ORX AOM/DSS, filled light green ellipse; ORX AOM/DSS+TP, blanked green ellipse. AOM, azoxymethane; CON, control; DSS, dextran sulfate sodium salt; ORX, orchiectomized; PCoA, principal coordinates analysis; PERMANOMA, permutational multivariate analysis of variance; TP, testosterone propionate.
4. Changes in the taxonomic composition of microorganisms at the phylum and family levels, after testosterone supplementation in the AOM/DSS-induced CRC mouse model
In the “AOM/DSS and TP addition” group, at the phylum level, there was a significant decrease in the abundance ratio of Firmicutes in the male AOM/DSS group (18%), as compared to that in the controls (28%) (p=0.048) (Fig. 3B). In contrast to males, the AOM/DSS groups of female (19%) and ORX (29%) mice showed higher levels of Firmicutes compared to the controls (12% for females and 13% for ORXs) (Fig. 3A and C), but only the ORX group showed a significant difference (p=0.024) (Fig. 3C). Interestingly, only in the ORX group, the levels of Firmicutes and Verrucomicrobia were significantly altered upon TP supplementation, as compared to those in the ORX AOM/DSS group, as follows: decrease in Firmicutes (from 27% to 9%, p=0.005) and increase in Verrucomicrobia (from 4% to 29%, p=0.007) (Fig. 3C), but not in males and females. At the family level, the abundance ratio of Lachnospiraceae (phylum: Firmicutes) was commonly altered upon AOM/DSS treatment in female, male, and ORX groups (Fig. 3G–I). TP supplementation significantly altered the abundances of the following gut microbiota: Bacteroidaceae (phylum: Bacteroidetes), Christensenellaceae, Lachnospiraceae, Ruminococcaceae (phylum: Firmicutes), and Akkermansiaceae (phylum: Verrucomicrobia) only in the ORX group (Fig. 3I).

Gut microbiota compositions at the Phylum and Family levels. (A–L) The microbiota compostion of stool conetnts from group 1 for “AOM/DSS and TP addition” criteria (A–C, G–I) and group 2 for “sex and ORX” criteria (D–F, J–L) at the Phylum (A–F) and Family (G–L) levels. Mann-Whitney U test for comparison difference between independent two groups was performed. †p < 0.05, female vs. male, ‡p < 0.05, male vs. ORX, §p < 0.05, female vs. ORX in CON, AOM/DSS, and AOM/DSS+TP mice within group 2. a)p < 0.05, CON vs. AOM/DSS, b)p < 0.05, AOM/DSS vs. AOM/DSS+TP in female, male, and ORX mice within group 1. (M–O) Firmicutes/Bacteroidetes ratio (M) calculated by dividing the abundance of Firmicutes (N) with that of Bacteroidetes (O) in female, male, and ORX mice. Data are expressed as the mean±SEM. Whiskers show the minimum and maximum values. The p-values were calculated from the Mann-Whitney U test for comparison difference between independent two groups. *p < 0.05 for “CON vs. AOM/DSS” or “AOM/DSS vs. AOM/DSS+TP” in female, male, and ORX groups, †p < 0.05 for “Female vs. Male”, ‡p < 0.05 for “Male vs. ORX”, §p < 0.05 for “Female vs. ORX” in CON, AOM/DSS, and AOM/DSS+TP subgroups. AOM, azoxymethane; CON, control; DSS, dextran sulfate sodium salt; ORX, orchiectomized; SEM, standard error of the mean; TP, testosterone propionate.
Next, the taxonomic compositions of microorganisms were observed in the “sex and ORX” group (Fig. 3D–F, J–L). At the phylum level in the control group, male mice showed higher levels of Firmicutes (28%; p=0.021 for male vs. female and p=0.021 for male vs. ORX) and lower levels of Bacteroidetes (65%; p=0.043 for male vs. female and p=0.043 for male vs. ORX), as compared to female and ORX mice (Fig. 3D). Similar to the beta diversity results, there was no significant difference in the taxonomic compositions between males and females in both the AOM/DSS (Fig. 3E) and AOM/DSS+TP (Fig. 3F) groups. Only in the ORX group, the levels of Firmicutes and/or Verrucomicrobia were significantly altered upon AOM/DSS treatment and TP supplementation, as compared to those in the males, as follows: increase in Firmicutes (from 8% to 29%, p=0.023) and decrease in Verrucomicrobia (from 12% to 4%, p=0.023) in the AOM/DSS group (Fig. 3E) and increase in Verrucomicrobia (from 8% to 29%, p=0.010) in the AOM/DSS+TP group (Fig. 3F). At the family level, male control mice showed higher levels of Lachnospiraceae (phylum: Firmicutes) and lower levels of Bacteroidaceae (phylum: Bacteroidetes), as compared to the females and ORX controls (Fig. 3J). There was no significant difference in the taxonomic compositions between males and females in the AOM/DSS (Fig. 3K) and AOM/DSS+TP (Fig. 3L) groups. Only in the ORX group, the levels of Christensenellaceae, Lachnospiraceae (phylum: Firmicutes), and/or Akkermansiaceae (phylum: Verrucomicrobia) were significantly altered upon AOM/DSS treatment and TP supplementation, as compared to those in the males.
We further analyzed the ratio of Firmicutes/Bacteroidetes (F/B), which are the two major phyla of the domain bacteria. The male CON showed higher Firmicutes levels (p=0.021 for males vs. females and p=0.021 for males vs. ORX) (Fig. 3N) and lower Bacteroidetes levels (p=0.043 for male vs. females and p=0.043 for males vs. ORX) (Fig. 3O), as compared to females and ORX controls. The male CON had a higher F/B ratio than the female and ORX control groups (p=0.021 for males vs. females and p=0.021 for males vs. ORX) (Fig. 3M). There was no significant difference in the F/B ratio between males and females in the AOM/DSS and AOM/DSS+TP groups (Fig. 3M). However, in the ORX AOM/DSS group, there was no significant difference in the ratio of Bacteroidetes upon TP supplementation (Fig. 3O), but as the ratio of Firmicutes decreased (p=0.005) (Fig. 3N), the F/B ratio decreased (p=0.005) (Fig. 3M).
5. Identification of testosterone-specific taxonomic biomarkers in the gut microbiome
A total of 10 microbiomes, which were functionally known as commensal bacteria and opportunistic pathogens, were significantly altered in this study (Figs. 4–6).
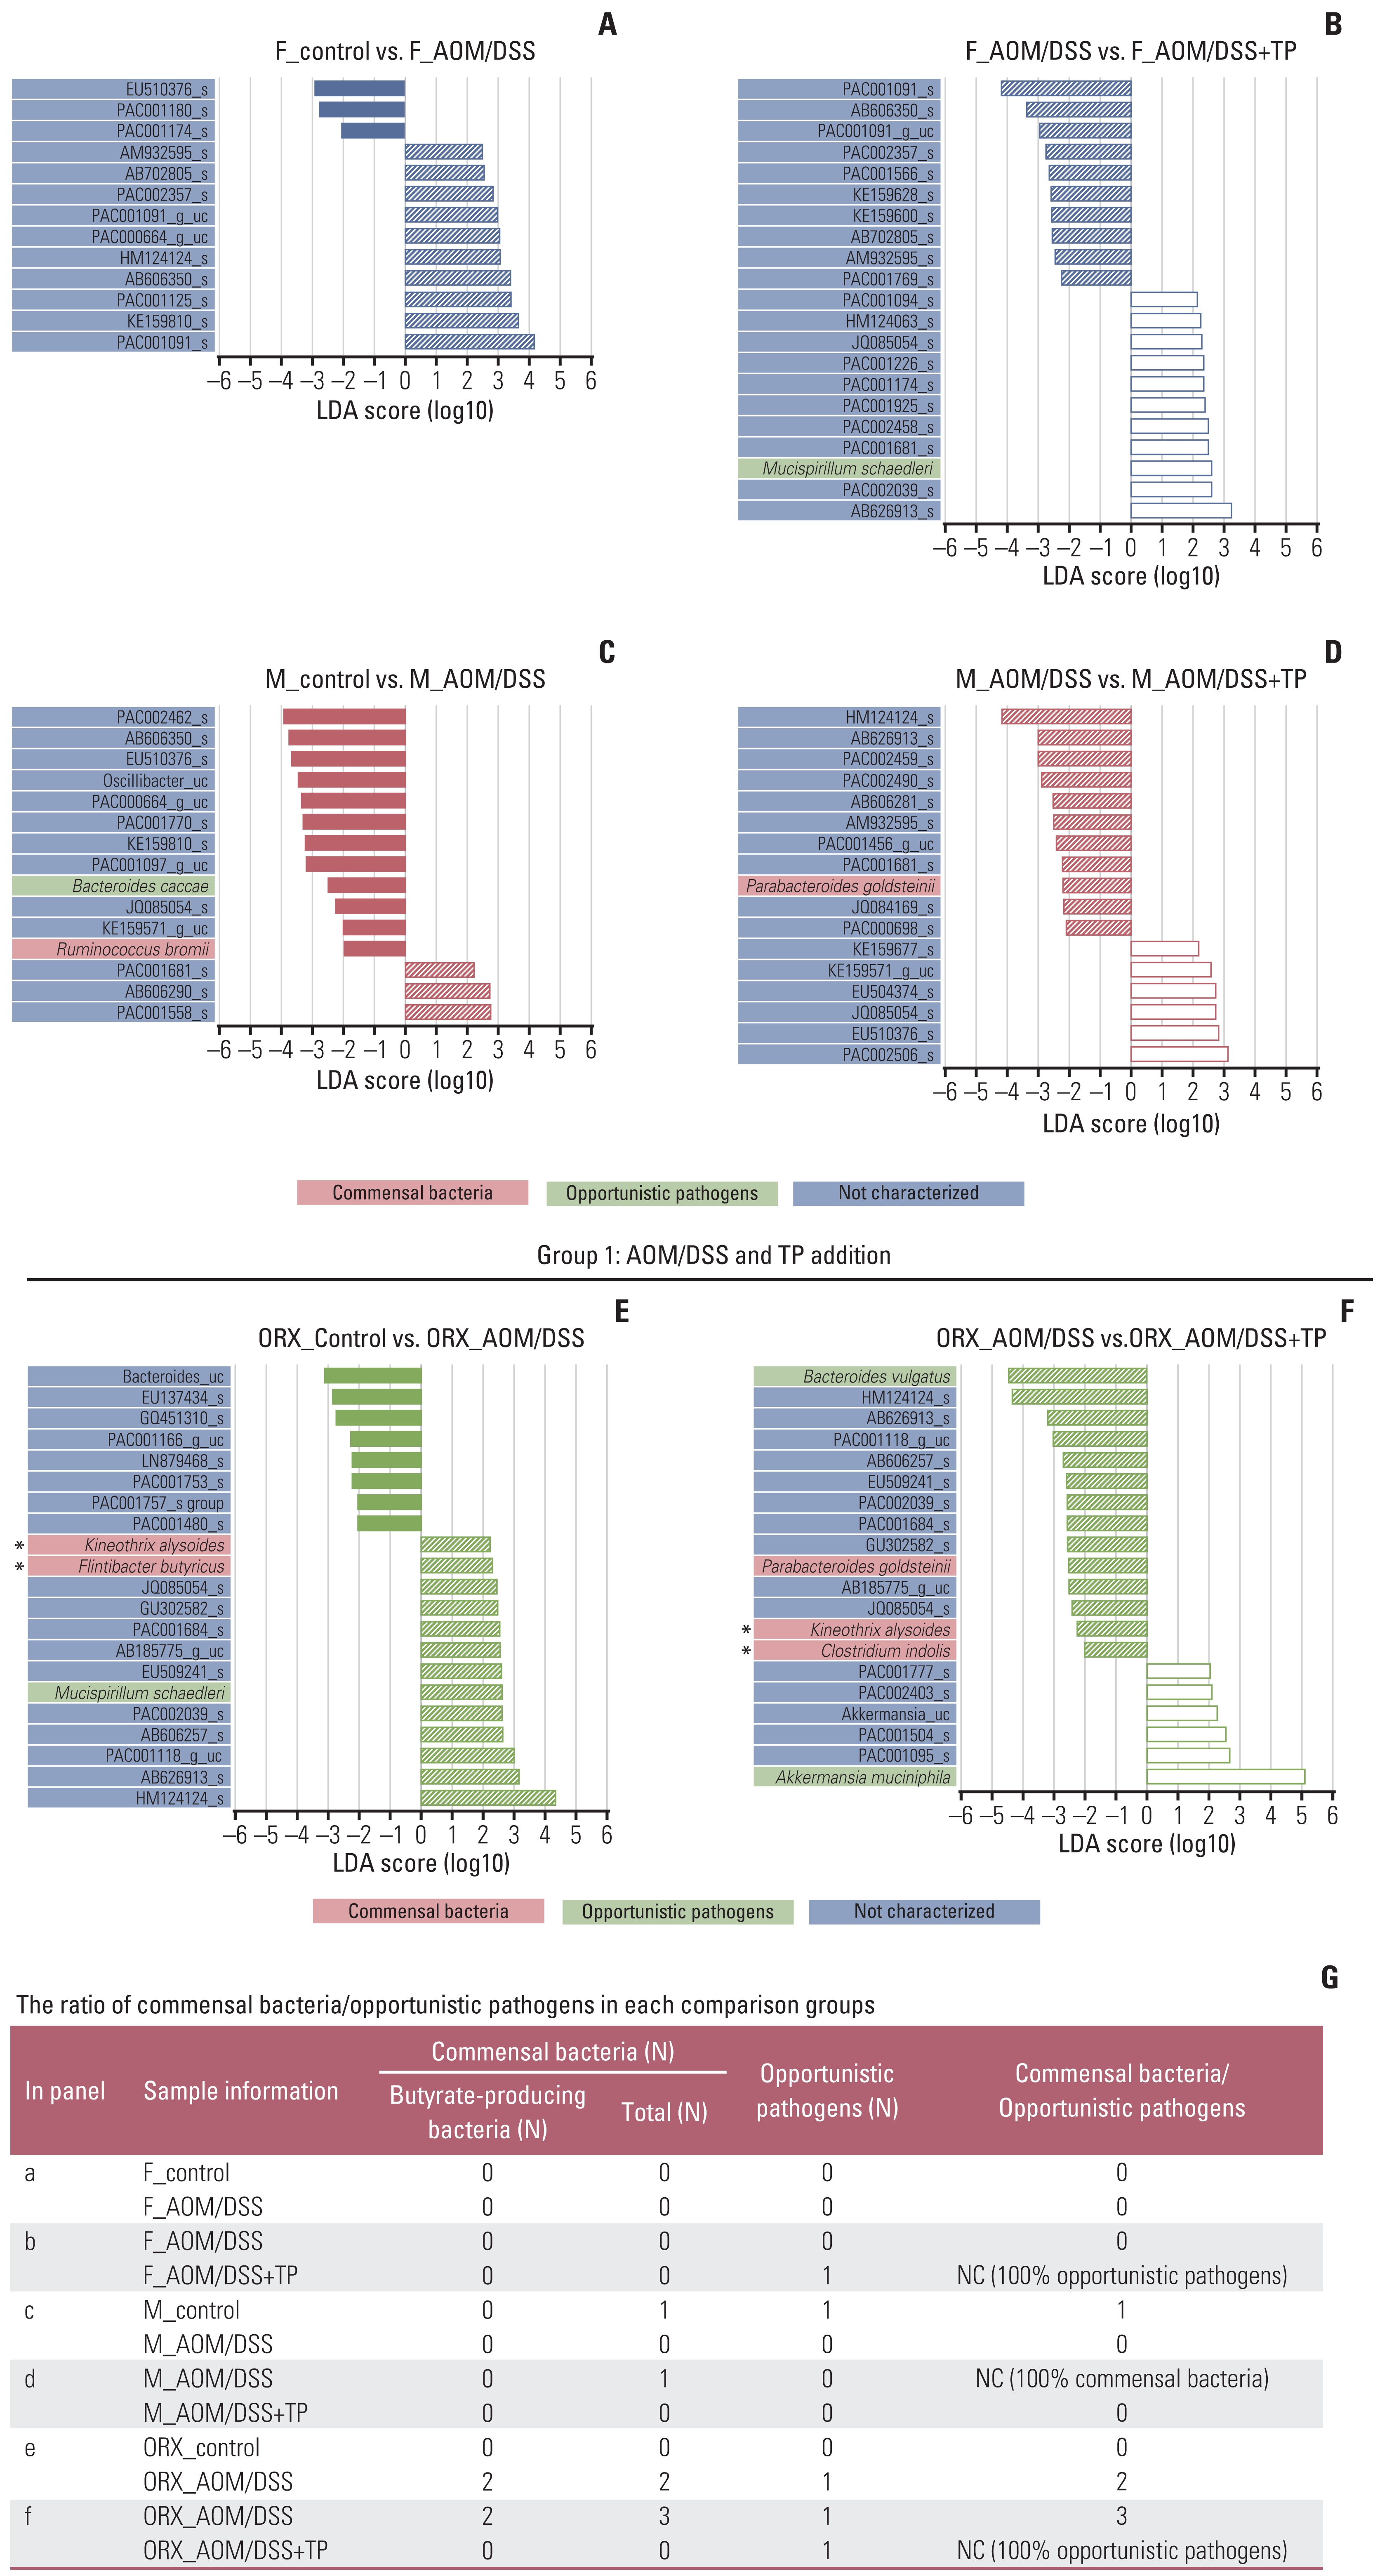
Changes in the abundance ratio of the gut microbiome by AOM/DSS and TP addition: LEfSe analysis. (A–F) Bar plots of the LEfSe results, which were obtained based on the following criteria: (1) alpha value of the factorial Kruskal-Wallis H test between assigned taxa < 0.05; (2) the alpha value for the pairwise Wilcoxon test among the taxonomic members < 0.05; (3) threshold of the logarithmic LDA score for discriminative features < 2.0; and (4) a multi-class analysis set as all-against-all; (5) identifying and classifying the bacterial characteristics based on previous reports as “commensal bacteria,” “opportunistic pathogens,” and “not characterized”; (6) removal of non-overlapping bacteria from the “not characterized” microbiome; and (7) in the LEfSe plot, all commensal bacteria and opportunistic pathogens, and top ten “not characterized” bacteria were included. The color bars show the LDA scores of species that enriched in indicated conditions; (A) filled red bar (female control), (A, B) hatched blue bar (AOM/DSS-treated female), (B) blanked blue bar (AOM/DSS+TP-treated female), (C) filled red bar (male control), (C, D) hatched red bar (AOM/DSS-treated male), (D) blanked red bar (AOM/DSS+TP-treated male). (E) filled green bar (ORX control), (E, F) hatched green bar (AOM/DSS-treated ORX mice), (F) blanked green bar (AOM/DSS+TP-treated ORX mice). The color on the species name indicates the characteristics of each species: yellow for commensal bacteria, orange for opportunistic pathogens, and green for not characterized bacteria. Asterisks indicate the butyrate-producing bacteria. The p- and q-values were determined using the non-parametric factorial Kruskal-Wallis H test. (G) The ratio of commensal bacteria to opportunistic pathogens based on the LEfSe results in each comparison group. AOM, azoxymethane; DSS, dextran sulfate sodium salt; F, female; LDA, linear discriminant analysis; LEfSe, linear discriminant analysis effect size; M, male; NC, not calculated; ORX, orchiectomized; TP, testosterone propionate.

Changes in the abundance ratio of the gut microbiome by sex and ORX: LEfSe analysis. (A–F) Bar plots of the LEfSe results, which were generated based on the criteria mentioned in the legend of Fig. 4. The color bars show the LDA scores of species that enriched in indicated conditions: (A) filled red bar (female control), (A, B) filled blue bar (male control), (B) filled green bar (ORX control), (C) hatched red bar (AOM/DSS-treated female), (C, D) hatched blue bar (AOM/DSS-treated male), (D) hatched green bar (AOM/DSS-treated ORX mice). (E) blanked red bar (AOM/DSS+TP-treated female), (E, F) blanked blue bar (AOM/DSS+TP-treated male), (F) blanked green bar (AOM/DSS+TP-treated ORX mice). The color on the species name indicates the characteristics of each species: yellow for commensal bacteria, orange for opportunistic pathogens, and green for not characterized bacteria. Arstericks indicate the butyrate-producing bacteria. The p- and q-values were determined using the non-parametric factorial Kruskal-Wallis H test. (G) The ratio of commensal bacteria to opportunistic pathogens based on the LEfSe results in each comparison group. AOM, azoxymethane; DSS, dextran sulfate sodium salt; F, female; LDA, linear discriminant analysis; LEfSe, linear discriminant analysis effect size; M, male; NC, not calculated; ORX, orchiectomized; TP, testosterone propionate.

Gut microbiome showing changes in “AOM/DSS and TP addition” and “sex and ORX” criteria. (A–C) The abundance ratio of butyrate-producing bacteria among commensal bacteria. (A) Clostridium indolis (Firmicutes: Clostridia: Clostridiales: Lachnospiraceae: Clostridium_g34). (B) Flintibacter butyricus (Firmicutes: Clostridia: Clostridiales: Ruminococcaceae: Pseudoflavonifractor). (C) Kineothrix alysoides (Firmicutes: Clostridia: Clostridiales: Lachnospiraceae: Kineothrix). (D–F) The abundance ratio of commensal bacteria. (D) Parabacteroides goldsteinii (Bacteroidetes: Bacteroidia: Bacteroidales: Porphyromonadaceae: Parabacteroides). (E) Romboutsia timonensis (Firmicutes: Clostridia: Clostridiales: Peptostreptococcaceae: Romboutsia). (F) Ruminococcus bromii (Firmicutes: Clostridia: Clostridiales: Ruminococcaceae: Ruminococcus_g2). (G–J) The abundance ratio of opportunistic pathogens. (G) Bacteroides caccae (Bacteroidetes: Bacteroidia: Bacteroidales: Bacteroidaceae: Bacteroides). (H) Mucispirillum schaedleri (Deferribacteres: Deferribacteres_c: Deferribacterales: Deferribacteraceae: Mucispirillum). (I) Akkermansia muciniphila (Verrucomicrobia: Verrucomicrobiae: Verrucomicrobiales: Akkermansiaceae: Akkermansia). (J) Bacteroides vulgatus (Bacteroidetes: Bacteroidia: Bacteroidales: Bacteroidaceae: Bacteroides). AOM, azoxymethane; CON, control; DSS, dextran sulfate sodium salt; ORX, orchiectomized; SEM, standard error of the mean; TP, testosterone propionate. Data are expressed as the mean±SEM. Whiskers show the minimum and maximum values. The p-values were calculated from the Mann-Whitney U test for comparison difference between independent two groups. *p < 0.05 for “CON vs. AOM/DSS” or “AOM/DSS vs. AOM/DSS+TP” in female, male, and ORX groups, †p < 0.05 for “Female vs. Male”, ‡p < 0.05 for “Male vs. ORX”, §p < 0.05 for “Female vs. ORX” in CON, AOM/DSS, and AOM/DSS+TP subgroups.
In the “AOM/DSS and TP addition” group, upon LEfSe analysis, there were changes in the abundance ratio of five bacteria (three commensal bacteria: Ruminococcus bromii, Kineothrix alysoides, and Flintibacter butyricus; two opportunistic pathogens: Bacteroides caccae and Mucispirillum schaedleri) upon comparison between control and AOM/DSS groups and six bacteria (three commensal bacteria: Parabacteroides goldsteinii, K. alysoides, and Clostridium indolis; three opportunistic pathogens: M. schaedleri, Bacteroides vulgatus, and Akkermansia muciniphila) upon comparison bet-ween AOM/DSS and AOM/DSS+TP groups (Fig. 4). In the females, the abundance of M. schaedleri was higher in the AOM/DSS+TP group than in the AOM/DSS group (p=0.029) (Fig. 4B), but there were no known bacteria that showed changes upon AOM/DSS treatment, as compared to the controls (Fig. 4A). In the males, the abundances of B. caccae and R. bromii were lower in the AOM/DSS treatment group than in the CON (p=0.040 for B. caccae and p=0.001 for R. bromii) (Fig. 4C), while the abundance of P. goldsteinii was lower in the TP-supplemented group than in the AOM/DSS group (p=0.015) (Fig. 4D). Interestingly, in the ORX group, various microbiota were altered upon AOM/DSS treatment and TP supplementation. The abundance ratios of K. alysoides, F. butyricus, and M. schaedleri were higher in the ORX AOM/DSS group than in the ORX controls (p=0.024 for K. alysoides, p=0.034 for F. butyricus, and p=0.013 for M. schaedleri) (Fig. 4E). Compared to those in the ORX AOM/DSS group, the abundances of B. vulgatus, P. goldsteinii, K. alysoides, and C. indolis were lower, and the abundance of A. muciniphila was higher in the ORX AOM/DSS+TP group (p=0.005 for B. vulgatus, p=0.002 for P. goldsteinii, p=0.006 for K. alysoides, p=0.038 for C. indolis, and p=0.007 for A. muciniphila) (Fig. 4F). Comprehensive results of microbiome showed changes according to AOM/DSS treatment and TP supplementation. B. caccae, which was lower in the male AOM/DSS group comparison with male controls, also showed a tendency to decrease after AOM/DSS treatment in female and ORX groups (Fig. 6G). In addition, K. alysoides and F. butyricus, which were higher in the ORX AOM/DSS group comparison with ORX controls, also showed a tendency to increase upon AOM/DSS treatment only in the female group (Fig. 6B and C). Furthermore, commensal bacteria such as P. goldsteinii, K. alysoides, and C. indolis were commonly lower in the AOM/DSS+TP group, as compared to that in the AOM/DSS group (Fig. 6A, C and D). Interestingly, the ratio of commensal bacteria to opportunistic pathogens was lower in the TP-administered female and ORX AOM/DSS groups than in the AOM/DSS group, and only opportunistic pathogens were identified in the TP groups (Fig. 4G).
In the “sex and ORX” group, LEfSe showed changes in the abundance ratio of the seven bacteria in the CON (four commensal bacteria: Romboutsia timonensis, R. bromii, K. alysoides, and F. butyricus; three opportunistic pathogens: B. vulgatus, B. caccae, and M. schaedleri), four in the AOM/DSS group (two commensal bacteria: C. indolis and R. timonensis; two opportunistic pathogens: M. schaedleri and A. muciniphila), and three in the AOM/DSS+TP group (three opportunistic pathogens: M. schaedleri, A. muciniphila, and B. vulgatus) (Fig. 5). Upon comparing male and female controls, the abundances of R. bromii, F. butyricus, and K. alysoides were higher in the male controls, whereas the abundance of R. timonensis was lower in the male controls (p=0.014 for R. bromii, p=0.042 for F. butyricus, p=0.020 for K. alysoides, and p=0.014 for R. timonensis) (Fig. 5A). Upon comparing male and ORX controls, the abundances of R. bromii, F. butyricus, and M. schaedleri were higher in the male controls, whereas the abundances of R. timonensis, B. vulgatus, and B. caccae were lower in the male controls (p=0.014 for R. bromii, p=0.020 for F. butyricus, p=0.043 for M. schaedleri, p=0.014 for R. timonensis, p=0.021 for B. vulgatus, and p=0.043 for B. caccae) (Fig. 5B). Upon comparing the male and female AOM/DSS groups, the abundances of M. schaedleri and C. indolis were lower in the male AOM/DSS group (p=0.040 for M. schaedleri and p=0.040 for C. indolis) (Fig. 5C). Upon comparison between the male AOM/DSS group and the ORX AOM/DSS group, the abundance of A. muciniphila was higher in the male AOM/DSS group, whereas the abundances of M. schaedleri and R. timonensis were lower in the male AOM/DSS group (p=0.023 for A. muciniphila, p=0.041 for M. schaedleri, and p=0.001 for R. timonensis) (Fig. 5D). In comparison to the male AOM/DSS+TP group, the abundance of M. schaedleri was higher in the female AOM/DSS+TP group (p=0.006) (Fig. 5E), and the abundances of A. muciniphila and B. vulgatus were higher and lower, respectively, in the ORX AOM/DSS+TP group (p=0.010 for A. muciniphila and p=0.002 for B. vulgatus) (Fig. 5F). Unexpectedly, the ratio of commensal bacteria to opportunistic pathogens or the number of commensal bacteria, especially butyrate-producing bacteria, was higher in male controls than in female and ORX controls (Fig. 5G). In the “sex and ORX” group, three microorganisms (F. butyricus, R. bromii, and R. timonensis) that showed common changes in the male control group, as compared to the female and ORX controls, and one microorganism (M. schaedleri) that showed common changes in the male AOM/DSS group, as compared to the female and ORX AOM/DSS group, were identified (Figs. 5 and 6).
Discussion
Using ORX and testosterone supplementation in the AOM/DSS model, we showed that testosterone is a very important factor for determining intestinal microbial dysbiosis. Furthermore, our data suggest that testosterone-induced dysbiosis could be a factor involved in the sex-difference of colorectal carcinogenesis. Increase in alpha diversity indices (Chao1 and Phylogenetic Diversity) and F/B ratio by AOM/DSS treatment in ORX mice was significantly abrogated by TP supplementation. The ratio of commensal bacteria to opportunistic pathogens was lower in the TP-administered females and ORX mice than that in the AOM/DSS group, and only opportunistic pathogens (M. schaedleri or A. muciniphila) were higher in the AOM/DSS+TP group than in the AOM/DSS group. In addition, alpha diversity indices and F/B ratio were higher in male controls than in females and ORX controls. The ratio of commensal bacteria to opportunistic pathogens or the number of commensal bacteria, especially butyrate-producing bacteria, was higher in male controls than in female and ORX controls. Compared to the female and ORX groups, three microorganisms (F. butyricus, R. bromii, and R. timonensis) showed common changes in the male CON and one microorganism (M. schaedleri) showed common changes in the male AOM/DSS group. We used a gas-generating pouch system instead of the immediate freezing method [11,22,34], and as a result, obtained a much higher number of valid reads, in addition to identifying butyrate-producing bacteria known as strict anaerobes.
The development of diseases such as cancer, autoimmune, and inflammatory diseases results in an imbalance in the gut microbiota [35]; however, it is also possible that this dysbiosis contributes to the diseases. In a previous study, we investigated the role of testosterone on colitis-associated symptoms (DAI scores and colonic epithelial damage scores) and the incidence of CRC, which involved introduction of endogenous testosterone-removed ORX [21]. The DAI scores, which peaked 2 weeks after AOM injection, were significantly higher in male mice compared to ORX males or females. Interestingly, the further increase in DAI scores by TP supplementation was significant only in ORX males and females. In addition, the colonic epithelial damage scores, including AOM/DSS-induced crypt loss and inflammatory cell infiltration, were exacerbated after TP supplementation in all groups. However, the male AOM/DSS+TP group had a higher score than ORX males and females. An increase in the severity of colitis caused by testosterone led to the development of colon cancer. The group that underwent ORX presented a significant reduction in the number and incidence of AOM/DSS-mediated enhanced tumors in the distal colon, which was reversed upon testosterone supplementation [21]. At week 13, the incidence of mucosal invasive adenocarcinoma was significantly high only in the male AOM/DSS group, and interestingly, there was an increase in submucosal invasive adenocarcinoma in all groups treated with AOM/DSS after TP supplementation. Taken together, the presence of endogenous and exogenous testosterone was associated with tumor development (> 2 mm size) and submucosal invasive cancer [21]. The stool used in this study was taken from a previous study set [21] and the present study was conducted as a secondary outcome for the identification of the role of testosterone in the gut microbiome.
Recently, the concept of “androbolome” has emerged as a term to describe the role of androgens, a group of male sex hormones, in the gut microbiome with respect to the incidence and pathogenicity of certain diseases [36]. A study of the serum levels of testosterone and the gut microbiota of men showed that a group of men with high testosterone levels (> 4.55 ng/mL) exhibited a more diverse gut microbiome than groups with low testosterone levels [37]. In men, gut microbiota such as Acinetobacter, Dorea, Ruminococcus, and Megamonas were found to be positively correlated with testosterone levels [37]. Furthermore, in mouse model, the gut microbial composition, which was sex-specific in males and females, disappeared in orchiectomized males [38]. According to a study investigating the association between testosterone levels and gut microbial communities in pati-ents with polycystic ovarian syndrome (PCOS), which is a common endocrine disorder in reproductive-aged women, the abundances of Bacteroides, Escherichia/Shigella, and Streptococcus enhanced in PCOS patients were positively correlated with serum testosterone and body mass, while the decreased abundances of Akkermansia and Ruminococcaceae in PCOS patients were negatively correlated with the indicators [39]. Furthermore, removal of letrozole, an aromatase inhibitor, in a letrozole-induced PCOS mouse model restored reproductive, metabolic, and gut microbiome levels to those of adolescent females [40]. These reports suggest that androgens could affect the composition and metabolism of the gut microbiome. However, little is known about the relationship between testosterone and the gut microbiota in CRC.
The human gut microbiota mostly consists of two major phyla, Firmicutes and Bacteroidetes, which account for more than 90% of the total population [41]. Since the relationship between the two major phyla, expressed as the F/B ratio, is related to several pathological conditions, this ratio has been used as an eventual biomarker [41]. Numerous studies have supported that lower F/B ratios are associated with a healthy state [42,43], and higher F/B ratios are associated with obesity [44] and CRC [45]. Some studies have demonstrated that the gut microbiome of obese animals and humans exhibit higher F/B ratios, as compared to those in normal-weight individuals [46–48]. According to the report by Ley et al. [49], when obese people were given a low-calorie diet for one year, their F/B ratio normalized with weight loss. In addition, epidemiological studies have shown that the F/B ratio is associated with obesity and an increased risk of CRC in 30%–70% of patients [7]. However, it has also been reported that the abundance of Firmicutes is lower in patients with inflammatory bowel disease (IBD) than that in healthy controls. In this study, we did not observe any significant change in the F/B ratio either by AOM/DSS treatment or TP supplementation in male and female mice. Only the ORX mice showed a significant change in the F/B ratio when the ORX AOM/DSS group was supplemented with TP. Also, the F/B ratio decreased as the ratio of Firmicutes decreased. Consistent with our previous findings [34], the F/B ratio was higher in male controls than in female controls, as the male controls exhibited higher Firmicutes and lower Bacteroidetes levels, as compared to those in the female controls. Previously, OVX-mediated endogenous estrogen deficiency did not show any change in the F/B ratio, as compared to that in female controls [11]. Contrary to OVX mice, in this study, the F/B ratio of the ORX group was similar to that of females, and consequently lower than that of males. However, there was no significant difference in the F/B ratio between males and females in both the AOM/DSS and AOM/DSS+TP groups. Taken together, although the F/B ratio can be a useful indicator of pathological conditions, several studies have presented various interpretations of the significance of the F/B ratio.
When dietary fiber is fermented in the colon, SCFAs such as acetate, propionate, and butyrate are the primary energy source for colon cells, and are thus, important for gastrointestinal health [50,51]. In particular, butyrate, one of the major SCFAs, is an important factor in maintaining health, which is involved in regulating the immune system [52], maintaining the epithelial barrier [53], and promoting postprandial satiety [54]. The potential of butyrate in preventing several diseases such as CRC [55], IBD [56], and obesity [57], has also been investigated. There is a reduction in the population of Faecalibacterium prausnitzii, a butyrate-producing bacterium, in stool and intestinal mucosa samples from patients with Crohn’s disease, as compared to that in healthy subjects [58]. Furthermore, sex-based differences in butyrate-producing gut microbiota have also been reported, which have been described as the microgenderome [59]. Another study reported that a mixture of tuna oil and algae oil exhibited superior anti-aging effects in male mice, as compared to those in female mice, in a D-galactose–induced aging mouse model [60]. Consumption of the oil mixture altered the composition of the gut microbiota, and interestingly, Lactobacillus and several butyrate producers were more abundant in males than in females [60]. In the present study, butyrate-producing bacteria such as F. butyricus (Firmicutes phylum; Ruminococcaceae family), K. alysoides (Firmicutes phylum; Lachnospiraceae family), and C. indolis (Firmicutes phylum; Lachnospiraceae family) were found. Contrary to expectations, these abundances were higher in male controls than in female and ORX controls, suggesting that these butyrate-producing bacteria may be compensatory phenomena in male mice. In addition to F. butyricus, R. bromii, and R. timonensis were identified as testosterone-specific gut microbiota. Among the butyrate-producing bacteria identified in this study, F. butyricus was found to be more abundant in the gut of mice than in that of humans [61]. F. butyricus produces butyric acid from sugars and amino acids, and this metabolism appears to be affected by a high-fat diet [62]. K. alysoides belongs to the Lachnospiraceae family, one of the most abundant in the human gut microbiome, and contains many known phytolytic agents and butyrate producers in the gut [63]. It has been reported that K. alysoides could help moderate anxiety-like behavior in both male and female mice [64]. When elevated cecal butyrate concentrations were induced by means of dietary D-mannitol feeding in male Wistar rats [65], C. indolis was found to be the major butyrate producer using lactic acid in this model [65]. There was a decrease in the abundances of K. alysoides, P. goldsteinii, and C. indolis upon TP supplementation in all AOM/DSS groups. Parabacteroids, as gut commensal bacteria, are negatively associated with obesity and play a role in anti-inflammatory processes. The abundance of P. goldsteinii was reduced in high-fat diet-fed mice [66]. Oral administration of live P. goldsteinii bacteria to obese mice prevented body weight gain, improved the gut barrier integrity, and reduced inflammation and insulin resistance [66]. Taken together, there are various microorganisms that show changes according to sex, ORX, AOM/DSS, and AOM/DSS+TP conditions. However, butyrate-producing bacteria inhabiting the human intestine are strictly anaerobic microorganisms, and there is a lack of information about their specific roles, due to the fact that not much research has been conducted on them, probably due to the difficulties in their general growth. There is a need for further research on the causal relationship between commensal bacteria, including butyrate-producing bacteria found in this study.
In this study, A. muciniphila and B. vulgatus showed no difference among the control, AOM/DSS, and AOM/DSS+TP groups in male and female mice. In ORX mice, B. vulgatus and A. muciniphila were identified as the predominant species in the AOM/DSS and AOM/DSS+TP groups, respectively. Furthermore, in the TP-supplemented group, A. muciniphila and B. vulgatus were identified as the predominant species in the ORX and male mice, respectively. Both have conflicting reports on their roles as commensal bacteria and opportunistic pathogens. A. muciniphila uses mucin as an energy source to produce acetic acid and propionic acid [67,68]. The abundances of members belonging to the genus Akkermansia have been found to be significantly higher in females than in males in both humans [69] and mice [70]. However, no sex-based differences were found in the abundance of A. muciniphila in this study. Conversely, in a gnotobiotic mouse model infected with Salmonella typhimurium, A. muciniphila fails to regulate host homeostasis in the mucosal layer, exacerbating intestinal inflammation [71]. An increase in A. muciniphila has been reported to be associated with multiple sclerosis [72,73]. B. vulgatus is a member of the Bacteroides species that dominates the normal distal human gut microbiota [74]. Although B. vulgatus is a commensal bacterium, it has been reported to be associated with various inflammatory diseases such as Crohn’s disease [75] and ulcerative disease [76]. Interestingly, A. muciniphila and B. vulgatus showed the opposite dominance in this study. According to a recent report by Shih et al. [77], when cohorts of patients with type 2 diabetes and refractory diabetes were compared, the relative abundances of A. muciniphila and Fusobacterium increased in type 2 diabetes patients, whereas the relative abundances of B. vulgatus and Veillonella denticariosi were significantly higher in the cohort of the refractory diabetes patients. These findings suggested that the decreased abundance of the glucose homeostasis-associated species, A. muciniphila, and the increased abundance of the insulin-resistance-related species, B. vulgatus, could have an overall impact on therapeutic effects and mechanisms that could underlie the pathogenesis of refractory diabetes [77]. The results of the current study alone do not allow an in-depth evaluation of bacterial interactions, which is a limitation of this study. In conclusion, these results suggest that testosterone is a very important factor in the dysbiosis of gut microbiota. This testosterone-induced dysbiosis could play a role in the sex-based differences in colorectal carcinogenesis.
Electronic Supplementary Material
Supplementary materials are available at Cancer Research and Treatment website (https://www.e-crt.org).
Notes
Ethical Statement
The facility of our preclinical animal room was managed by professional personnel, following the Animals in Research: Reporting In Vivo Experiments guidelines (ARRIVE guidelines). All animal experiments were approved by the Institutional Animal Care and Use Committee of Seoul National University Bundang Hospital (permit number: BA1705-223/043-01). All experiments were performed in accordance with relevant guidelines and regulations of Institutional Animal Care and Use Committee of Seoul National University Bundang Hospital as well as the recommendations in the ARRIVE guidelines.
Author Contributions
Conceived and designed the analysis: Song CH, Kim N.
Contributed data or analysis tools: Song CH.
Performed the analysis: Song CH.
Wrote the paper: Song CH, Kim N.
Provided a concept, supervised the study: Kim N.
Performed the animal experiments: Nam RH, Choi SI, Jang JY.
Reviewed the manuscript critically: Lee HN.
Conflicts of Interest
Conflict of interest relevant to this article was not reported.
Acknowledgments
This work was supported by a grant from the National Research Foundation of Korea (NRF) funded by the government of the Republic of Korea (2019R1A2C2085149).