Histopathologic and Molecular Biomarkers of PD-1/PD-L1 Inhibitor Treatment Response among Patients with Microsatellite Instability–High Colon Cancer
Article information

Abstract
Purpose
Recent clinical trials have reported response rates < 50% among patients treated with programmed death-1 (PD-1)/programmed death-ligand 1 (PD-L1) inhibitors for microsatellite instability–high (MSI-H) colorectal cancer (CRC), and factors predicting treatment response have not been fully identified. This study aimed to identify potential biomarkers of PD-1/PD-L1 inhibitor treatment response among patients with MSI-H CRC.
Materials and Methods
MSI-H CRC patients enrolled in three clinical trials of PD-1/PD-L1 blockade at Asan Medical Center (Seoul, Republic of Korea) were screened and classified into two groups according to treatment response. Their histopathologic features and expression of 730 immune-related genes from the NanoString platform were evaluated, and a machine learning–based classification model was built to predict treatment response among MSI-H CRCs patients.
Results
A total of 27 patients (15 responders, 12 non-responders) were included. A high degree of lymphocytic/neutrophilic infiltration and an expansile tumor border were associated with treatment response and prolonged progression-free survival (PFS), while mucinous/signet-ring cell carcinoma was associated with a lack of treatment response and short PFS. Gene expression profiles revealed that the interferon-γ response pathway was enriched in the responder group. Of the top eight differentially expressed immune-related genes, PRAME had the highest fold change in the responder group. Higher expression of PRAME was independently associated with better PFS along with histologic subtypes in the multivariate analysis. The classification model using these genes showed good performance for predicting treatment response.
Conclusion
We identified histologic and immune-related gene expression characteristics associated with treatment response in MSI-H CRC, which may contribute to optimal patient stratification.
Introduction
Colorectal cancer (CRC) is a common neoplasm that accounts for approximately 10% of malignancies diagnosed worldwide, and about 20% of CRC patients are found to have stage IV disease at the time of the initial diagnosis [1,2]. The clinical outcomes of metastatic CRC have improved in the last few decades with a tailored approach of systemic treatment combining targeted agents with cytotoxic chemotherapy based on molecular biomarkers. With these advancements, the median overall survival of patients with stage IV CRC has been extended to 30 months [2].
Deficient mismatch repair (dMMR)/microsatellite instability–high (MSI-H) tumors account for about 5% of patients with stage IV CRC [3,4]. Microsatellite instability (MSI) is a genetic mutational signature of simple and short repeats of DNA sequences caused by the failure of cellular mismatch repair (MMR) systems, which is referred to as the dMMR status. While the majority of sporadic CRC cases with dMMR/MSI-H features arise from somatic epigenomic alteration, such as MLH1 gene promoter methylation in the CpG island hypermethylator phenotype leading to silencing of MLH1 expression, some cases arise in Lynch syndrome patients harboring germline mutations of MMR genes with additional hits leading to biallelic loss of MMR genes [5]. As the dMMR/MSI-H status leads to the accumulation of frameshift mutations generating increased tumor neoantigen burden, the dMMR/MSI-H status was thought to be a predictive biomarker of response to immunotherapy. Accordingly, several phase 2 and phase 3 clinical trials have established dMMR/MSI-H as a predictive biomarker of response to immune checkpoint inhibitors (ICIs) for the treatment of metastatic CRC [6–8].
Although ICI treatment has been associated with encou-raging results against dMMR/MSI-H metastatic CRC, a considerable portion of patients still do not respond to the treatment, and variable clinical outcomes have been reported from different clinical trials, with response rates to ICI in phase 2 clinical trials for pre-treated solid tumors ranging from 30% to 40% [6,7]. Although pembrolizumab as a front-line treatment was associated with a high response rate of 43.8% in a phase 3 trial comparing it with conventional chemotherapy, survival analysis revealed that about 40% of patients progressed within the first 4 months. This implies the presence of a subpopulation among dMMR/MSI-H CRC patients who show primary resistance to immunotherapy [8].
Accordingly, new biomarkers for predicting response or primary resistance to ICIs among dMMR/MSI-H CRC patients are needed to make better clinical decisions and better understand the mechanism of action or resistance to immunotherapy. In the study described and discussed herein, we comprehensively evaluated the characteristics of dMMR/MSI-H metastatic CRC according to the response to programmed death-1 (PD-1)/programmed death-ligand 1 (PD-L1) blockade, including histopathologic features and immune-related gene expression characteristics.
Materials and Methods
1. Patients and study group
Patients diagnosed with dMMR/MSI-H colorectal adeno-carcinoma and treated with ICIs at Asan Medical Center (Seoul, Republic of Korea) between October 2015 and February 2020 were screened for analysis. The patients were either treated with pembrolizumab or were enrolled in one of the phase 2 investigator-sponsored clinical trials of other ICIs, including NCT03150706 (avelumab for previously treated dMMR/MSI-H or POLE-mutant colorectal cancer) and NCT-03435107 (durvalumab for previously treated dMMR/MSI-H or POLE-mutant colorectal cancer) [9,10]. Patients were treated with the conventional ICI doses: intravenous pembrolizumab 200 mg every 3 weeks, avelumab 10 mg/kg intravenously every 2 weeks, and durvalumab 1,500 mg (20 mg/kg for patients with body weight ≤ 30 kg) intravenously every 4 weeks as described in each of the study protocols.
Among the screened patients, those who had finished the study treatment or had undergone disease evaluation once or more at the time of data collection (March 2020) were included in the study. The patients were then divided into two groups according to ICI treatment response (responder group vs. non-responder group). The responders were patients who received ICI treatment for > 4 months without progression after two consecutive disease evaluations within 8 to 9 weeks. The criteria were based on the results from a previous trial of pembrolizumab for pre-treated metastatic CRC patients. From the KEYNOTE-164 study, the median progression-free survival (PFS) was 4.1 months for dMMR/MSI-H metastatic CRC patients who received pembrolizumab after one or more prior treatments [11]. Patients who withdrew consent due to symptomatic deterioration before disease evaluation were included in the non-responder group.
2. Ascertainment of MSI status
Each patient was required to undergo a test for dMMR or MSI-H, or a next-generation sequencing (NGS) test for POLE mutation, which was also one of the eligibility criteria of the two trials. The tests for dMMR and MSI-H included MMR protein immunohistochemistry (IHC), polymerase chain reaction (PCR) fragment assay, and targeted NGS in which the MSI-H status was determined by a tumor mutational burden (TMB) ≥ 40 and an I-index (insertion/deletion mutation to whole mutation percentage) ≥ 9%, as previously described [12].
In current practice, the test methods for MMR and MSI-H are not standardized across patients, and previous studies have reported a considerable degree of discrepancy between MMR and MSI-H test results [9,13]. Therefore, to assure the MSI status of patients before biomarker analysis, we reviewed the results of IHC, PCR fragment assay, and targeted NGS. In cases of inconsistency among the results of IHC, PCR, and NGS, the MSI status was determined according to the results of a thorough review. NGS results were prioritized for determining the MSI status because our NGS testing based on TMB performs well even at low tumor cellularity (10% or more) compared with PCR testing, which requires a tumor cellularity > 20% to yield reliable results. IHC results are often affected by tissue quality, and misinterpretations of IHC results are known to be the most common cause of discrepancies between IHC and molecular testing [14]. Therefore, we prioritized NGS results over PCR and IHC results. For those without NGS results, a pathologist (J.K.) determined MSI status by reviewing the IHC and/or PCR results. Analyses of histopathologic characteristics and immune gene expression profiles were performed for each patient with a verified MSI-H status.
3. Clinical and histopathologic variables
Baseline clinical characteristics, including initial stage, previous treatments, mutational status of KRAS, NRAS, and BRAF, follow-up duration, and survival status, were obtained from the clinical trial database. Histopathologic features were evaluated, including histologic cancer subtypes, neutrophil infiltration grades, lymphocyte infiltration grades, tumor borders, Crohn-like lymphoid aggregate status, and lymphovascular invasion. Additional PD-L1 22C3 IHC (DAKO/Agilent, Santa Clara, CA) analyses were performed for cases with sufficient archival tissue for staining. PD-L1 results were interpreted by a pathologist (J.K.) by combined proportion score (CPS), defined as the ratio of all PD-L1–positive cells to viable tumor cells [15]. PD-L1 results were considered as positive if the CPS was ≥ 1.
4. IHC for PRAME
Differential expression of PRAME according to treatment response was examined using tumor tissues obtained during surgery for routine diagnostic pathologic examinations were analyzed with IHC for PRAME using anti-PRAME antibody (1:1,000, rabbit monoclonal, clone EPR20330, catalog No. ab219650, Abcam, Cambridge, UK). Briefly, 4-μm-thick sections of formalin-fixed, paraffin-embedded (FFPE) tissues were obtained with a microtome, transferred onto silanized charged slides, dried for 10 minutes at room temperature, and incubated at 65°C for 20 minutes. The tissue sections were processed by heat-induced epitope retrieval method using Cell Conditioning 1 buffer for 64 minutes and incubated for 32 minutes with the anti-PRAME antibody in a BenchMark XT automatic immunostaining device (Ventana Medical Systems, Tucson, AZ) according to the manufacturer’s instructions. Antigen-antibody reactions were visualized using the ultraView Universal Alkaline Phosphatase Red Detection Kit (Ventana Medical Systems). Counterstaining was performed using Ventana Hematoxylin II for 12 minutes and Ventana Bluing Reagent for 4 minutes. Finally, all slides were removed from the stainer, dehydrated, and coverslipped for microscopic examination. Slides in which > 1% of cancer cells were immunostained for PRAME were considered as positive for PRAME.
5. Differential gene expression and pathway analyses
Total RNA was extracted from the FFPE tissues of each patient. Quality control (QC) of each sample was performed using a Denovix DS 11 AATI Fragment Analyzer (Wilmington, DE) to evaluate the quantity and condition of the isolated RNA before analysis. Total RNA of approximately 100 μg was used for gene expression analysis, and the input amount of total RNA was increased for samples with excess RNA strand fragmentation. Immune-related gene expression profiling was performed using the NanoString nCounter platform (NanoString Technologies, Seattle, WA) with a PanCancer Immune Profiling Panel composed of 730 immune-related genes and 40 internal reference genes. The prepared RNA was thawed just before analysis and mixed with the reporter code set and probe set in a hybridization buffer. The hybridization process was performed at 65°C for 16 to 24 hours and then moved to a NanoString nCounter preparation station for cleansing of inadequately hybridized probes, and the properly hybridized transcript-probe complexes were immobilized on the cartridge. Finally, the fixed samples on the cartridge were scanned and read by the NanoString nCounter Digital Analyzer (NCT-DIGT-120) and recorded as reporter code count files, which were analyzed in nSolver software (NanoString Technologies) for the QC process, including image QC, binding density QC, as well as positive and negative control QC. The expression levels of each gene in the samples with adequate QC data were normalized in the nSolver software using a positive control and housekeeping genes. The immune cell type was annotated based on the annotation file provided by NanoString Technologies for the nCounter PanCancer Immune Profiling Panel.
From the normalized gene expression levels from the NanoString nCounter assay using the PanCancer Immune Profiling Panel, differential gene expression analyses were performed in responders and non-responders by comparing the normalized expression levels of each gene by Wilcoxon rank-sum test. The nominal p-values were initially adjusted according to the false discovery rate (FDR); however, all genes had an FDR of > 0.05 due to the small sample size. Therefore, we considered using fold change (FC) and the genes with nominal p-values < 0.05 and log2-transformed fold change (log2FC) > 0.5 or < −0.5 were considered as candidate genes. To identify the functional ontology of the candidate genes, we performed unsupervised hierarchical clustering and gene set enrichment analysis.
6. Predictive modeling using machine learning and internal validation
Random forest (RF), a machine learning classification modeling approach, was utilized using the Python package sklearn v0.24.1 to generate a predictive model for classifying patients into PD-1/PD-L1 blockade response groups based on the genes with significant differential expression. Validation of the predictive model was performed according to the following steps: Step 1: For the ith sample (i = 1, …, n), divide the ith sample from whole data as the training set and the remaining (n-1) patients as the validation set; Step 2: Apply classification models to the training set to fit a prediction model; Step 3: Apply the fitted prediction model to the validation set and calculate the predicted probabilities; Step 4: Repeat steps 1–3 for all n samples; Step 5: After completing the cross-validation, combine the predicted probability values of all samples calculated using the leave-one-out cross-validation (LOOCV) method. The overall accuracy was evaluated, and a single receiver operating characteristic curve was drawn, and the area under the curve (AUC) value was calculated.
7. Statistical analysis
For descriptive analysis of categorical variables, the chi-squared test or Fisher exact test was performed in R ver. 4.0.3 (R Foundation for Statistical Computing, Vienna, Austria), as appropriate. The Wilcoxon rank-sum test was used to evaluate the significane of differences in continuous variables between groups. Survival was estimated with the Kaplan-Meier method and was compared by log-rank tests using GraphPad Prism 5.0 (GraphPad Software, San Diego, CA) or R ver. 4.0.3. PFS was defined from the initiation of the study treatment until objective disease progression according to Response Evaluation Criteria in Solid Tumor v1.1 or death due to any cause, whichever came first. Multivariate logistic regression analysis was performed in the response group using the logistf v1.24 package in R. Multivariate Cox regression analysis was performed for PFS using the survival v.3.2–7 package in R. Two-sided p-values < 0.05 were considered statistically significant.
Results
1. Patient screening and study design
A total of 50 patients who were enrolled and treated with PD-1/PD-L1 inhibitors between October 20, 2015, and February 27, 2020, at Asan Medical Center were screened. The median age was 59 years (range, 21 to 85 years), 40 patients (80%) were male, and all patients had Eastern Cooperative Oncology Group performance status of 0 or 1. Twenty-seven patients (54%) had initially metastatic disease at enrollment, while 23 patients (46%) had recurrence after surgical resection and adjuvant chemotherapy as needed. Nine patients (18%) received ICIs as the first-line regimen for palliative treatment, 18 patients (36%) as second-line therapy, and 23 patients (46%) as at least the third line. Among 33 patients with available tumor burden data, 17 (51.5%) had liver or lung metastases, and 26 patients (78.8%) had distant metastases elsewhere. Twenty-patients (40%) received pembrolizumab, while 13 (26%) and 17 patients (34%) received avelumab and durvalumab, respectively. The proportions of responders according to ICI were similar, although durvalumab was associated with the highest proportion of responders (9 patients, 52.9%) compared with pembrolizumab (8 patients, 40%) and avelumab (5 patients, 38.5%). At a median follow-up duration of 22.4 months, the median PFS was 3.7 months; 44% of patients (n=22) were categorized as responders (i.e., treated with ICIs for > 4 months without progression). The clinical characteristics of the 50 patients according to treatment response are summarized in S1 Table.
Among the 50 patients, 27 patients (15 responders vs. 12 non-responders), who were verified as having a dMMR/MSI-H tumor and adequate archival tissue, were included in this study (Fig. 1). At a median follow-up duration of 32.4 months, the median PFS of the 27 patients was 32.8 months, and the objective response rate was 44.4% (95% confidence interval [CI], 27.6 to 62.7). Immune-related gene expression analysis using NanoString was performed for 19 patients with dMMR/MSI-H (11 responders vs. 8 non-responders) after quality assurance of the tissue RNA.
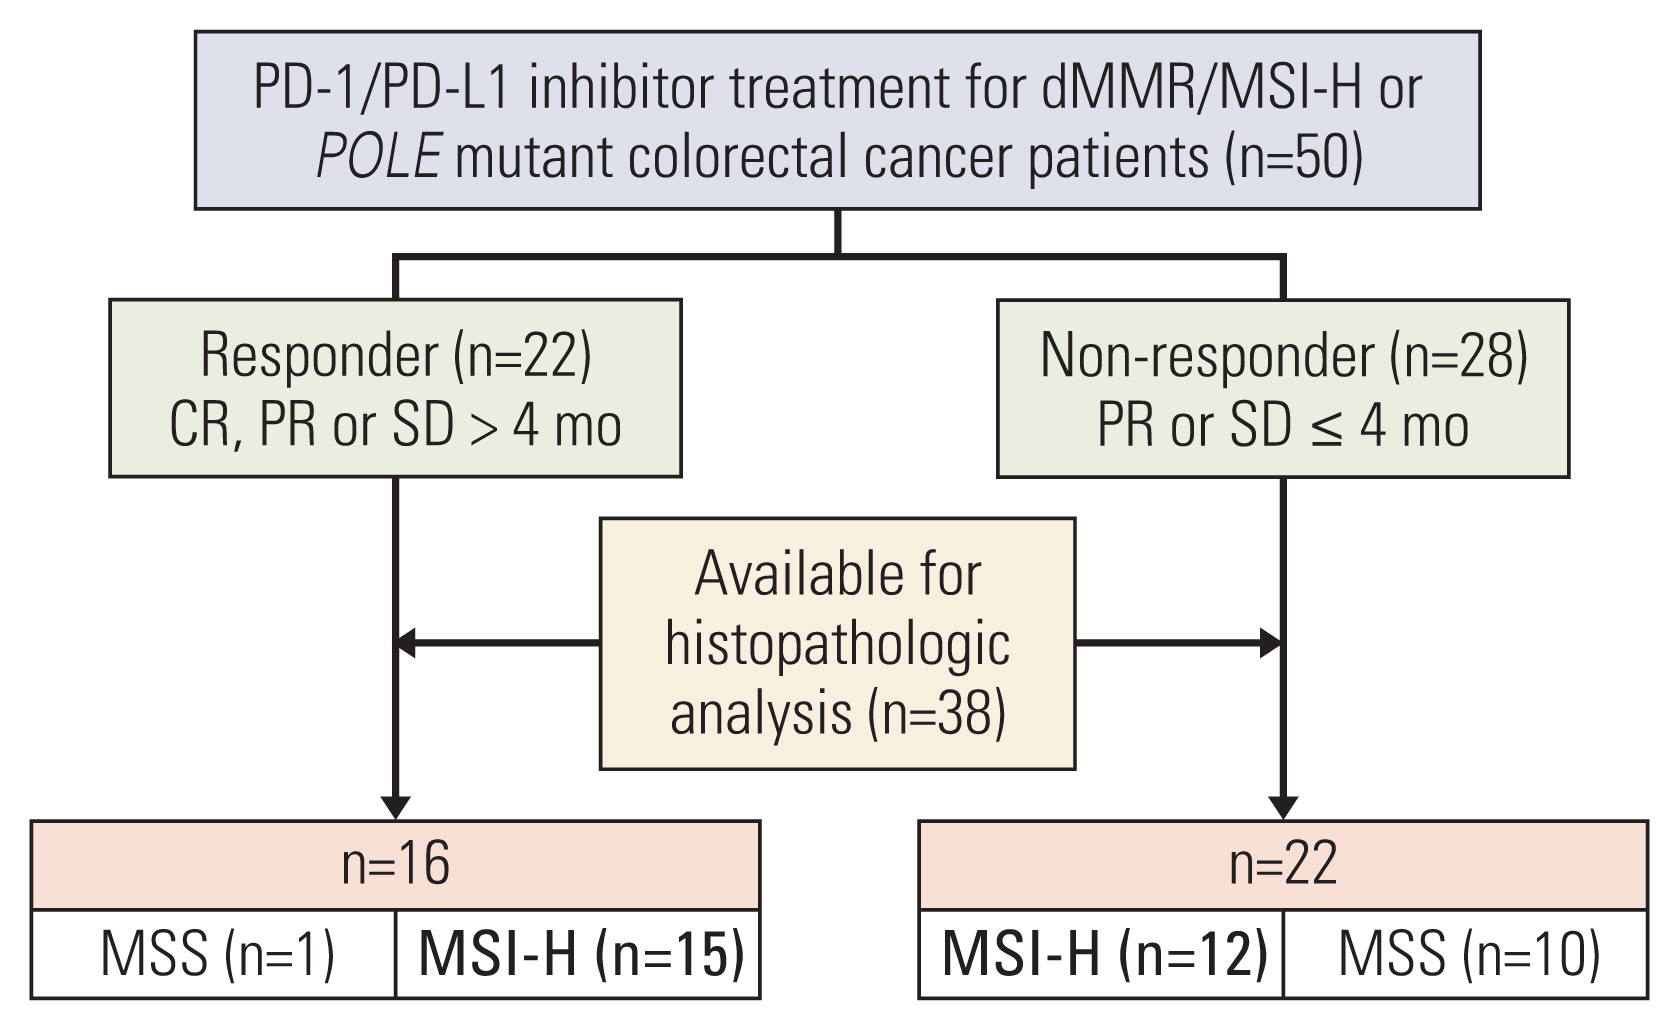
Case selection and study design according to the response to immune checkpoint inhibitor treatment among patients with deficient mismatch repair (dMMR)/microsatellite instability–high (MSI-H) metastatic colorectal cancers. CR, complete response; MSS, microsatellite stable; PD-1, programmed death-1; PD-L1, programmed death-ligand 1; PR, partial response; SD, stable disease.
2. Histopathologic determinants of PD-1/PD-L1 blockade response in dMMR/MSI-H CRCs
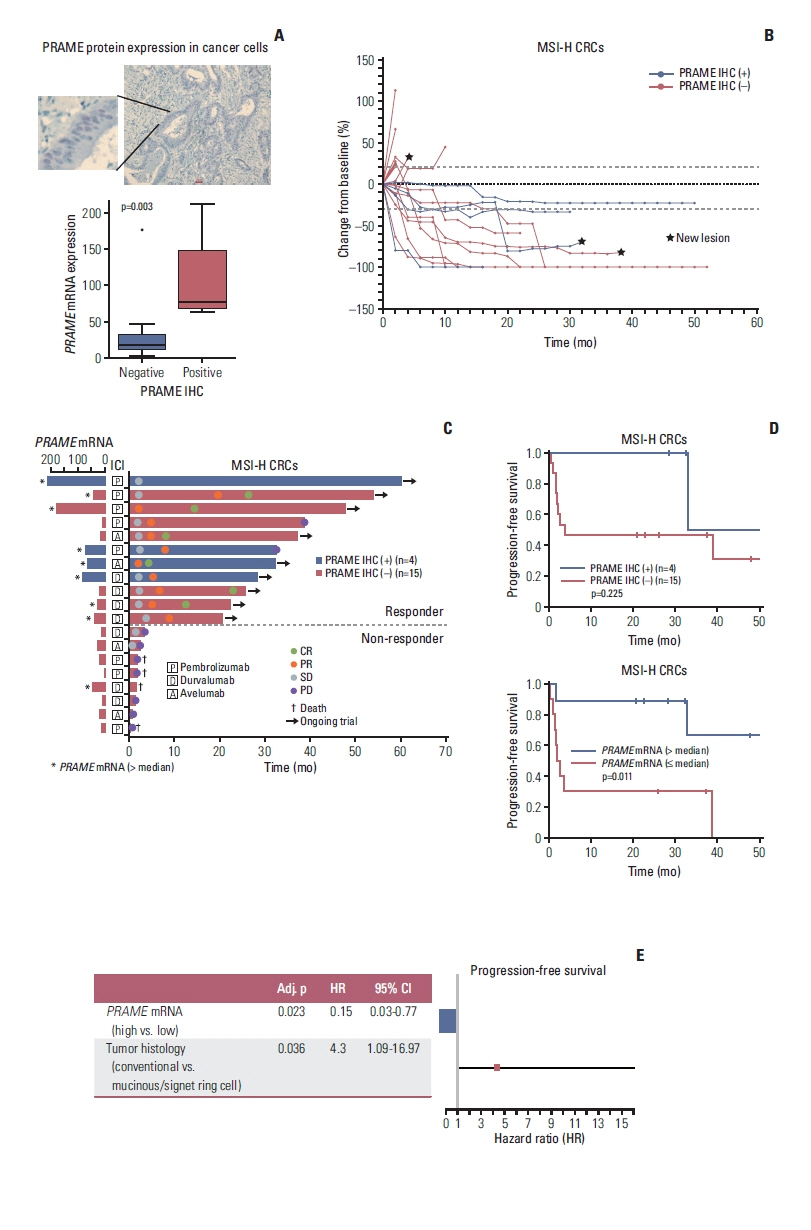
Histopathologic tumor features were compared among 27 patients with confirmed dMMR/MSI-H status according to treatment response (15 responders vs. 12 non-responders) (Table 1). The histologic CRC subtype distribution was significantly different between the two groups (p=0.003, Fisher exact test), with most of the patients with mucinous adenocarcinoma or signet-ring cell carcinoma (Fig. 2A) in the non-responder group. Compared with the non-responder group, patients in the responder group had abundant infiltration of immune cells, such as lymphocytes (p=0.001, Fisher exact test) and neutrophils (p=0.043, Fisher exact test) (Fig. 2A). We also found that the tumor border status was associated with treatment response, as an expansile tumor border (Fig. 2A) was significantly associated with treatment response (p=0.003, Fisher exact test); notably, none of the patients in the non-responder group had expansile borders. Interestingly, PD-L1 positivity and TMB were not significantly associated with the response to PD-1/PD-L1 blockade (Table 1). Also, there was no significant difference in the proportion of patients harboring RAS or RAF mutations between the two response groups (p=0.827, Fisher exact test). There were no significant differences in histopathologic features between dMMR/MSI-H tumors and microsatellite stable (MSS) tumors. TMB was significantly higher in dMMR/MSI-H tumors compared with MSS tumors, with median TMBs 104.7/Mb (range, 50.0/Mb to 176.0/Mb) and 12.5/Mb (range, 4.7/Mb to 17.2/Mb), respectively (p < 0.001, Wilcoxon rank-sum test) (S2 Table).
Comparison of histopathologic characteristics among patients with dMMR/MSI-H according to treatment response
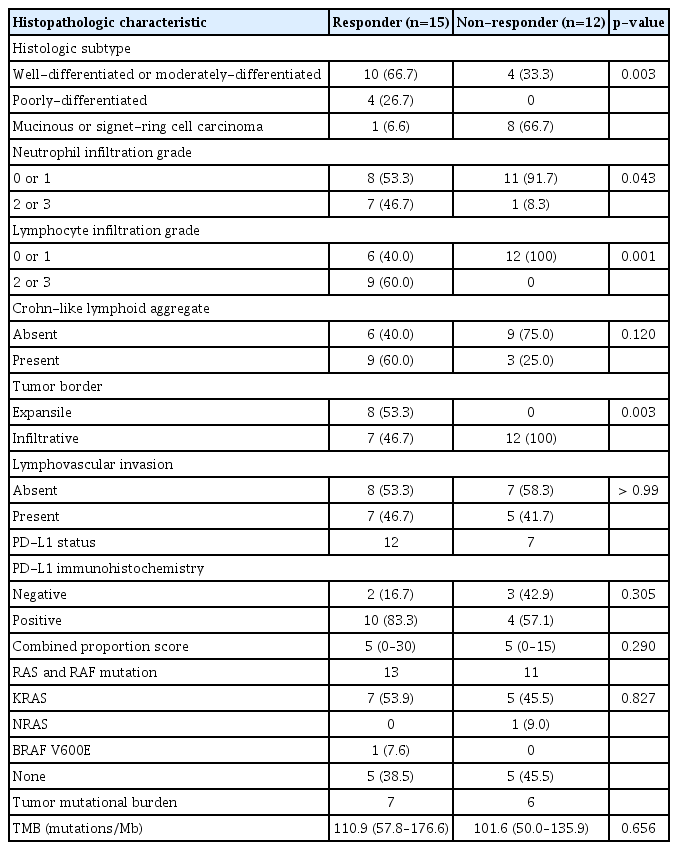
Histopathologic features associated with ICI response among patients with dMMR/MSI-H CRC. (A) Representative histologic features of MSI-H CRCs among responders and non-responders. High degree of lymphocytic infiltration along the tumor border in the responder group (upper left, ×200). High degree of neutrophil infiltration grade along the tumor-stroma interface in the responder group (middle left, ×200). Expansile tumor border and surrounding of tumor cells by inflammatory cell infiltrates in the responder group (lower left, ×40). Infiltrative tumor border in the non-responder group (upper right, ×40). Mucinous adenocarcinoma with abundant extracellular mucin separating tumor cells from adjacent stroma in the non-responder group (middle right, ×100). Signet-ring cell carcinoma without signs of inflammatory cell infiltration along the tumor-stroma interface in the non-responder group (lower right, ×200). (B) Response status after ICI during follow-up and histopathologic features in patients with MSI-H CRCs. (C) Progression-free survival (log-rank test) of patients with MSI-H CRCs after ICI according to tumor histology, lymphocyte infiltration, and tumor border. (D) Multivariable logistic regression analysis of treatment response with histopathologic variables. CR, complete response; CRC, colorectal cancer; dMMR, deficient mismatch repair; ICI, immune checkpoint inhibitor; LA, lymphoid aggregate; MSI-H, microsatellite instability–high; ND, not determined; PD, progressive disease; PR, partial response; SD, stable disease.
In accordance with the initial responsiveness to immunotherapy, PFS was significantly associated with specific histopathologic variables (Fig. 2C, S3 Fig.), as mucinous adenocarcinoma and signet-ring cell carcinoma were associated with a significantly shorter PFS compared with conventional adenocarcinoma (p=0.004, log-rank test). Higher neutrophil infiltration grade (grade 2 to 3 vs. grade 0 to 1, p=0.016, log-rank test) and lymphocyte infiltration grade (grade 2 to 3 vs. grade 0 to 1, p < 0.001, log-rank test), presence of Crohn-like lymphoid aggregates (p=0.013, log-rank test), and expansile tumor border (p < 0.001, log-rank test) were associated with longer PFS. The presence of lymphovascular invasion was not associated with significant differences in PFS. In the multivariate logistic regression analysis, cancer histologic subtype (p=0.008) was independently associated with treatment response (Fig. 2D).
3. Differential expression of immune genes according to blockade responsiveness
Expression levels of the 730 immune genes in the PanCancer Immune Profiling Panel (NanoString Technologies) were compared according to treatment response. Immune cell type profiles were not significantly different between the two groups (S4 Fig.). At the individual gene level, 25 differentially expressed immune genes (p < 0.05, Wilcoxon rank-sum test and absolute log2FC > 0.5) were identified (Fig. 3A, S5 Table). Using these genes, we performed pathway enrichment analyses to compare the activation of immune-related molecular pathways between the two groups. Responders had elevated activity in pathways, such as those yielding interferon-γ (IFN-γ) and regulation of immune effector process, whereas non-responders had elevated activity in pathways associated with phagocytosis, positive regulation of macrophage activation, and immunoglobulin/B-cell–mediated immune responses (Fig. 3B). When more stringent criteria were applied (p < 0.05, Wilcoxon rank-sum test and absolute log2FC > 1.0), eight genes remained as differentially expressed (Fig. 3C), among which six genes (PRAME, CCL18, CXCL1, BST2, CXCL11, and CCL28) were specifically expressed in the responder group, and two genes (CD99 and ABCB1) were specifically expressed in the non-responder group (Fig. 3D).

Differential expression analysis of immune genes between the two groups (11 responders vs. 8 non-responders). (A) Heatmap of differentially expressed immune genes (absolute log2FC > 0.5 and p < 0.05 by Wilcoxon rank-sum test) between the two groups. (B) Enriched pathways in gene ontology enrichment analysis of responders and non-responders. (C) Volcano plots highlighting genes with significantly higher expression in the responder group and non-responder group (absolute log2FC > 0.5 and p < 0.05 by Wilcoxon rank-sum test). (D) The comparative expression levels of genes with significantly higher expression in the responder group (BST2, CCL18, CCL28, CXCL1, CXCL11, and PRAME) and the non-responder group (ABCB1 and CD99). CRC, colorectal cancer; DEG, differentially expressed genes; MSI-H, microsatellite instability–high.
4. PRAME expression was associated with better response and prolonged survival
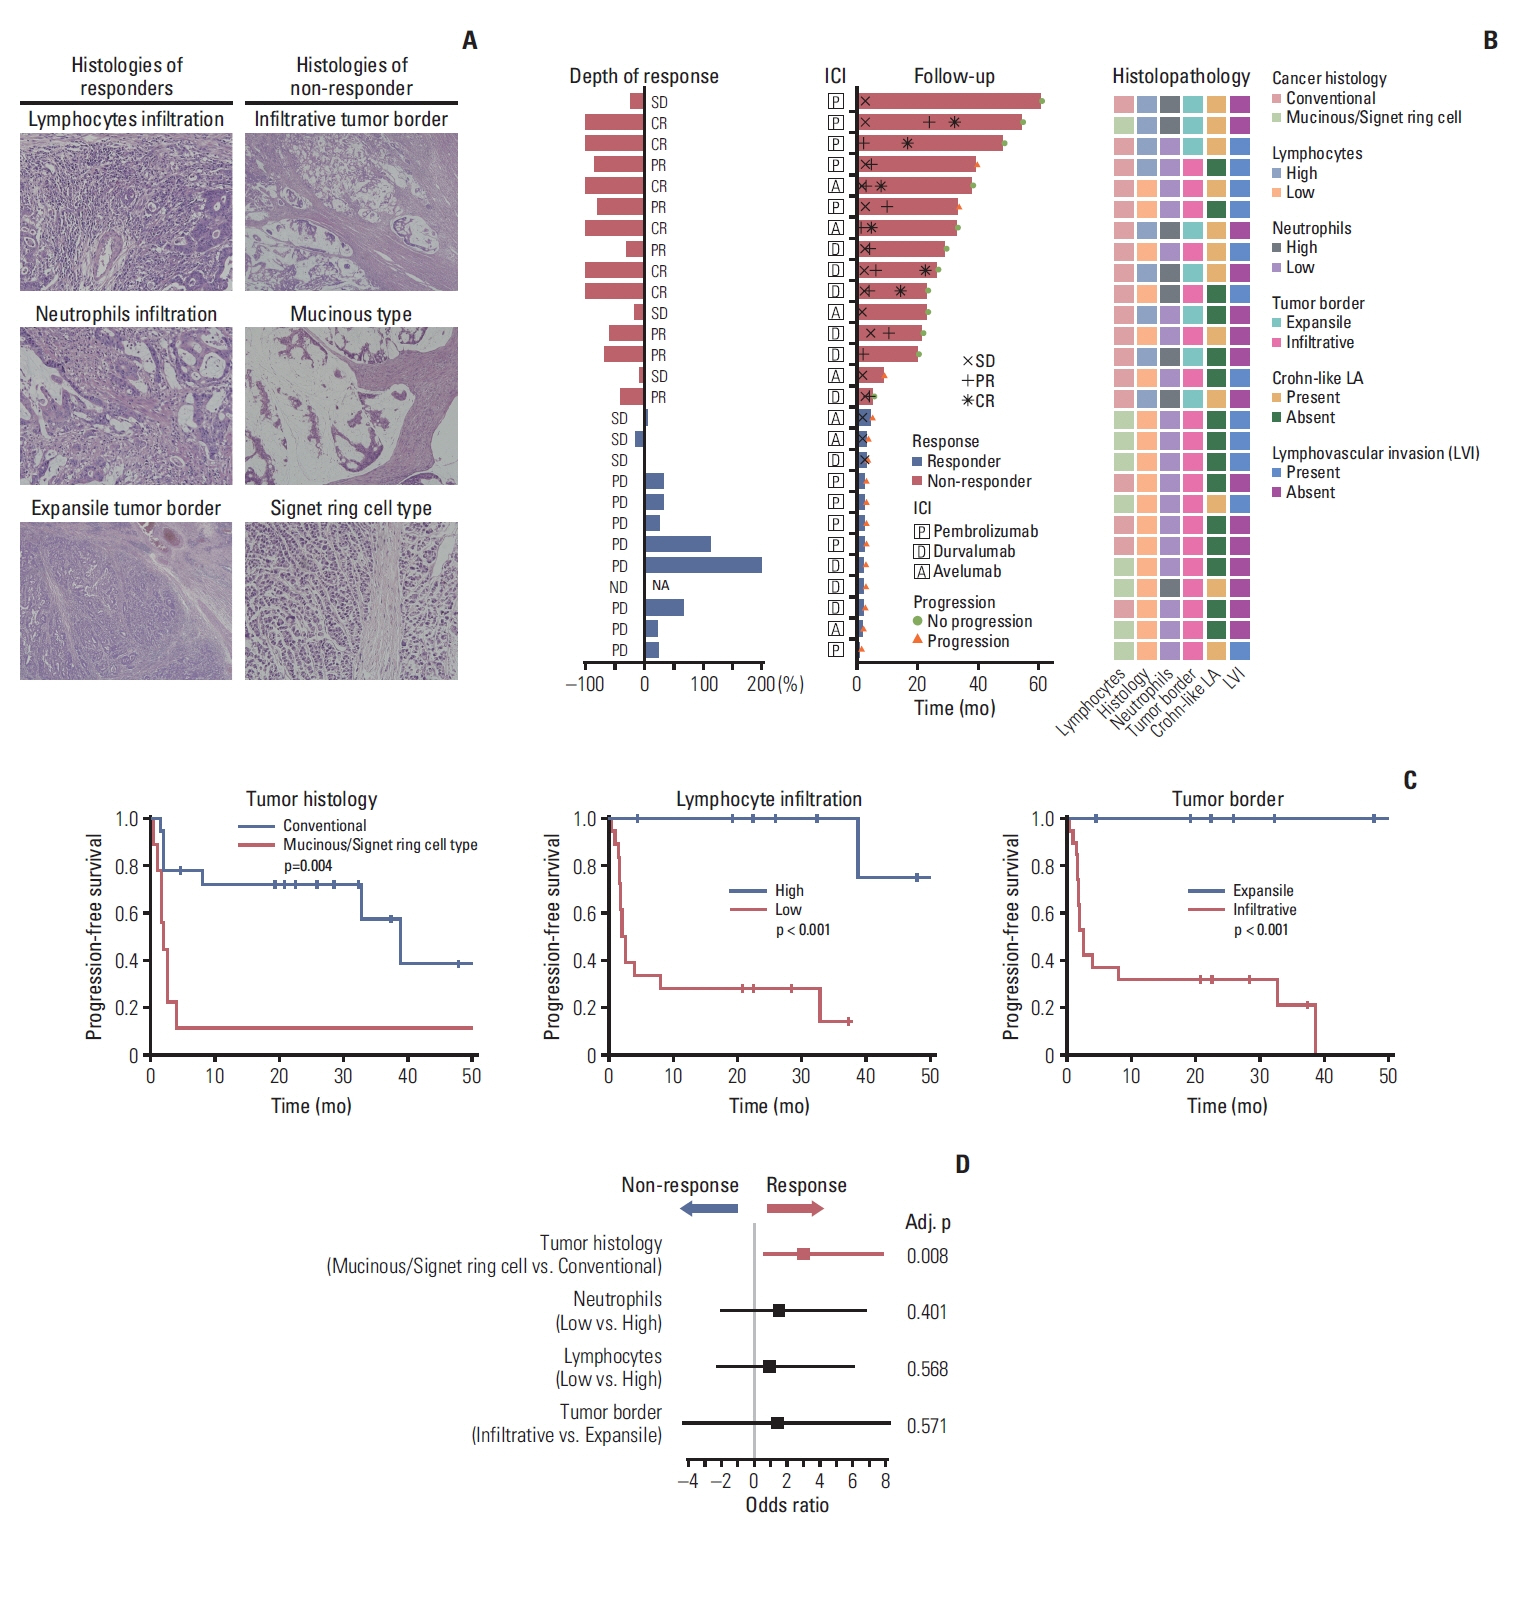
Of the six genes specifically expressed in the responder group, PRAME showed the highest FC (log2FC=1.95). To examine the differential expression of PRAME, we performed IHC staining of PRAME (S6 Table). The IHC level of PRAME correlated well with the mRNA expression level from the NanoString panel, with a median normalized PRAME expression level of 76.6 (interquartile range, 66.8 to 146.4) among the PRAME-positive patients and 17.8 (interquartile range, 10.6 to 31.7) among the PRAME-negative patients (p=0.003, Wilcoxon rank-sum test) (Fig. 4A). All four PRAME-positive patients were in the responder group, and none were in the non-responder group (Fig. 4B and C). Moreover, except for one patient, all patients with a high mRNA expression of PRAME (i.e., higher than the median value) were in the responder group (Fig. 4C). High PRAME expression was associated with prolonged PFS compared with low PRAME expression (p=0.011, log-rank test) (Fig. 4D). Additionally, the prognostic significance of PRAME mRNA expression was independent of cancer histology (p=0.023, multivariate Cox regression) (Fig. 4E), thus showing that cancer histology was independently associated with ICI treatment response.
Association between PRAME expression and response to ICIs. (A) Representative IHC results of PRAME with nuclear expression in CRC cells (×100) and significant correlation between protein expression and mRNA expression (p=0.0036, Wilcoxon rank-sum test). (B) Spider plot of the changes in the sum of target lesions from the baseline along ICI treatment with annotation of the PRAME IHC results. (C) Swimmer plot showing the clinical response and duration of ICI treatment with PRAME IHC results and PRAME mRNA expression levels. (D) Progression-free survival outcomes according to PRAME protein expression and PRAME mRNA expression among patients with MSI-H CRCs after ICI treatment (log-rank test). (E) Multivariable Cox regression analysis for progression-free survival. CI, confidence interval; CR, complete response; CRC, colorectal cancer; ICI, immune checkpoint inhibitor; IHC, immunohistochemistry; MSI-H, microsatellite instability–high; PD, progressive disease; PR, partial response; SD, stable disease.
5. Predictive modeling of PD-1/PD-L1 blockade response based on immune-related gene expression
The PD-1/PD-L1 inhibitor response prediction model using an RF algorithm was built based on the top eight immune-related genes with differential expression, and the prediction model was validated using the LOOCV method (Fig. 5A). In accordance with the aforementioned finding of the association between PRAME expression and treatment response, PRAME had a high rank in terms of feature importance among the eight genes (Fig. 5B). The accuracy of the response prediction model was 0.84 (95% CI, 0.60 to 0.96), with a cross-validated AUC of 0.93, sensitivity of 0.91, specificity of 0.75, a positive predictive value of 0.833, and a negative predictive value of 0.857 (Fig. 5C).

Prediction modeling for treatment response to ICIs among patients with MSI-H CRCs. (A) Overview of the processes of prediction model building using RF based on immune-related gene expression and internal validation of the model using the LOOCV method. (B) Feature importance of input genes in modeling by RF. (C) Performance of the prediction model. AUC, area under the curve; CRC, colorectal cancer; DEG, differentially expressed genes; ICI, immune checkpoint inhibitor; LOOCV, leave-one-out cross-validation; MSI-H, microsatellite instability–high; NPV, negative predictive value; PPV, positive predictive value; RF, random forest; ROC, receiver operating characteristic.
Discussion
We investigated the unique histologic and gene expression features associated with treatment response to ICIs among patients with dMMR/MSI-H metastatic CRC. Although a large proportion of patients with dMMR/MSI-H metastatic CRC exhibit durable clinical benefits from ICI treatment, the degree of benefit likely varies by differences in tumor characteristics.
Comparison of the histopathologic features of MSI-H CRC according to ICI response revealed several notable responder characteristics. Lymphocytes and neutrophil infiltration of the tumor stroma, Crohn-like lymphoid aggregates, and expansile tumor borders were associated with good ICI responses, while infiltrative tumor borders with scanty immune cell infiltration and mucinous or signet-ring cell carcinoma subtypes were predominant features of non-responders. Of note, pure mucinous adenocarcinoma was associated with separation of tumor cells from peritumoral immune cells, and signet-ring cell carcinoma was associated with poor immune cell infiltration, which may underlie the poor response to ICI therapy. Some of the features are also known as traits of the MSI-H tumor itself, as rich infiltration of T lymphocytes, Crohn-like lymphoid aggregates, expansile tumor borders have been more frequently observed in MSI-H CRC than in MSS CRC [16,17]. Mucinous and signet-ring cell histology, which were independently associated with poor survival outcomes in the multivariate analysis, were also more common in association with MSI-H CRC (33.3%) than with MSS or MSI-L tumors (18.2%) (S2 Table); these findings aligned with the proportions reported in previous studies (23.9% to 36%) [18,19]. Our study showed that careful histologic analyses focusing on the tumor-immune cell interaction could reveal useful histologic predictors of responsiveness to ICI therapy in MSI-H CRC.
A high density of tumor-infiltrating lymphocytes (TILs) is widely accepted as a prognostic factor in CRC and is also a strong predictor of immunotherapy response in many different types of cancers [20,21]. Generally, MSI-H tumors have higher TIL densities than MSS tumors; however, only 33% (9/27) of our study patients had grade 2 or 3 lymphocyte infiltration, none of whom were among the non-responders. In terms of Crohn-like lymphoid aggregates, a previous study showed that the formation of ectopic lymphoid tissues was correlated with better CRC survival outcomes, although none of the patients had received treatment with ICIs [22]. Although the association between neutrophil infiltration and response to immunotherapy or survival outcome is controversial, we found that a higher abundance of neutrophils in the tumor microenvironment was associated with the response to PD-1/PD-L1 blockade, which may imply that neutrophils can themselves be the target of PD-1/PD-L1 blockade, or they may play a role as anti-tumor inflammatory cells in CRC [23]. PD-L1 expression was not significantly associated with survival outcomes or response to PD-1/PD-L1 inhibitors, which is in line with the results from the CheckMate-142 study [7].
Although histopathologic analysis identified some distinct features of immunotherapy responders among MSI-H CRC patients, histopathologic features are difficult to standardize and quantify to apply as clinical biomarkers; rather, differentially expressed genes between responders and non-responders could be more useful as reliable biomarkers. We found that PRAME and several chemokine genes (CXCL11, CCL18, CXCL1, and CCL28) had significantly higher expression levels in the responder group. The accuracy of the response prediction model, which mainly consisted of PRAME and chemokine genes, was 0.842 (95% CI, 0.60 to 0.96), which is a favorable result that warrants further validation with a larger study sample. Several chemokines were also known to be upregulated in MSI-H tumors compared with MSS tumors. In a previous analysis using RNA sequencing data from the Total Cancer Genome Atlas data, CXCL11 and CCL18 showed significantly higher expression in MSI-H CRC compared with MSS CRC, and CXCL1 was also highly expressed in a study using a multiplex cytokine assay [24,25]. Nonetheless, the association between chemokine gene expression and response to ICI therapy in MSI-H CRC had not been well established.
In a previous analysis of gene expression signatures for predicting the response of head and neck squamous cell carcinomas to ICI therapy, CXCL11 was included in the signature as a predictor of response to ICIs [26]. CXCL11 was also correlated with tumor-infiltrating T-cells and natural killer cells in a meta-analysis of gene expression studies that included 5953 solid tumor specimens [27]. From gene ontology enrichment analysis, one of the enriched pathways in the responder group was the IFN-γ response pathway. IFN-γ is thought to be related to inflammatory gene signatures and could be one of the biomarkers for immunotherapy response [20]. IFN-γ, with several chemokine gene expression signatures, has been shown to be predictive of the response to immunotherapy in patients with head and neck squamous cell carcinoma [26].
In this study, the PRAME gene yielded the largest log2FC between responders and non-responders and was thus subjected to validation at the protein level. PRAME was one of the first cancer/testis antigens identified in a melanoma cell line and is known to be expressed in many different solid tumors, including CRC and leukemia, with minimal expression in normal organs except the testes and endometrium [28]. In our study, IHC analysis identified PRAME expression in only 21% (4/19) of MSI-H patients—who were all responders—and correlated well with the level of PRAME gene expression.
Currently, there are only a few biomarkers associated with ICI response in dMMR/MSI-H CRC. In an analysis of 22 patients with metastatic dMMR/MSI-H CRC treated at five centers, high TMB was strongly associated with response to immunotherapy and better survival outcomes [29]. However, the predictive value of TMB for immunotherapy response should be further investigated and correlated with other molecular and immunologic aspects. In a study on the correlation of gene expression profiles and TMB with response to pembrolizumab in solid tumors, both high TMB and T-cell inflamed gene expression profiles were independently correlated with better pembrolizumab treatment outcomes (objective response rates of TMBhigh/GEPhigh vs. TMBhigh/ GEPlow, 37% to 57% vs. 11% to 42%) [30]; in that study, most of the MSI-H CRC patients had high TMBs, while only about a half of the patients had T-cell inflamed gene expression profiles [30].
There were several limitations to this study. This study was conducted at a single center with a relatively small number of patients who received different types of PD-1/PD-L1 inhibitors. One of the major limitations was that none of the differentially expressed genes identified in this study were significant when multiple testing correction using FDR was performed, although we considered FC as well as nominal p-values. Therefore, we acknowledge that there is a risk of false positivity in terms of the association between treatment response and the expression of any single gene. However, we were able to show that the combinatory gene set, including PRAME, could predict the response to immunotherapy; we also observed high accuracy in the internal validation. However, the number of genes included in the differential expression analysis was also small, and none of the differentially expressed genes had a robust significance in terms of FDR. External validation of the differentially expressed genes and an RF classifier predictive model are needed, along with preclinical studies, to elucidate the molecular mechanisms underlying the results of the differential expression analysis. Moreover, there should be more efforts to utilize immunotherapy for patients with MSS CRC, who constitute the majority of the patients with metastatic CRC.
In conclusion, our study revealed the histopathologic characteristics and immunologic gene expression profiles associated with the response to PD-1/PD-L1 blockade among patients with dMMR/MSI-H metastatic CRC. We identified eight immune-related genes that could predict the response to PD-1/PD-L1 blockade, among which PRAME was differentially expressed in the responder group, with the highest absolute log2FC, and showed a good correlation with the IHC results. These results suggest the potential role of PRAME as a predictive biomarker of ICI response as well as histologic characteristics. Our study results may contribute to a better selection of candidates for immunotherapy and provide promising directions for further investigation on PD-1/PD-L1 blockade for MSI-H CRC.
Electronic Supplementary Material
Supplementary materials are available at Cancer Research and Treatment website (https://www.e-crt.org).
Notes
Ethics Statement
All procedures performed in studies involving human participants were performed in accordance with the ethical standards of the institutional review board of Asan Medical Center (#2019-0065) and with the 1964 Helsinki Declaration and its later amendments or comparable ethical standards. The participants provided informed consents for the use of their clinical information and the analysis of their tumor samples through our translational study program (#2011-0511).
Author Contributions
Conceived and designed the analysis: Hyung J, Cho EJ, Sung CO, Kim SY.
Collected the data: Kim J, Sung CO, Kim SY.
Contributed data or analysis tools: Cho EJ, Kim JH, Sung CO, Kim SY.
Performed the analysis: Hyung J, Cho EJ, Kim J, Sung CO, Kim SY.
Wrote the paper: Hyung J, Kim J, Kim JH, Kim JE, Hong YS, Kim TW, Sung CO, Kim SY.
Conflicts of Interest
This research was supported by HK inno.N Corp.
Acknowledgments
This research was also supported by a grant from the Korea Health Technology R&D Project through the Korea Health Industry Development Institute (KHIDI), funded by the Ministry of Health & Welfare, Republic of Korea (grant number: HI18C2383).