Validation of the Korean Version of the Patient-Reported Outcomes Measurement Information System 29 Profile V2.1 among Cancer Survivors
Article information
Abstract
Purpose
The purpose of the study was to validate the Korean version of Patient-Reported Outcomes Measurement Information System 29 Profile v2.1 (K-PROMIS-29 V2.1) among cancer survivors.
Materials and Methods
Participants were recruited from outpatient clinics of the Comprehensive Cancer Center at the Samsung Medical Center in Seoul, South Korea, from September to October 2018. Participants completed a survey questionnaire that included the K-PROMIS-29 V2.1 and the European Organisation for Research and Treatment of Cancer Quality of Life Core Questionnaire (EORTC QLQ-C30). Principal component analysis and confirmatory factor analysis (CFA) and Pearson’s correlations were used to evaluate the reliability and validity of the K-PROMIS-29 V2.1.
Results
The mean age of the study participants was 54.4 years, the mean time since diagnosis was 1.2 (±2.4) years, and 349 (87.3%) completed the entire questionnaire. The Cronbach’s alpha coefficients of the seven domains in the K-PROMIS-29 V2.1 ranged from 0.81 to 0.96, indicating satisfactory internal consistency. In the CFA, the goodness-of-fit indices for the K-PROMIS-29 V2.1 were high (comparative fit index, 0.91 and standardized root-mean-squared residual, 0.06). High to moderate correlations were found between comparable subscales of the K-PROMIS-29 V2.1 and subscales of the EORTC QLQ-C30 (r=0.52–0.73).
Conclusion
The K-PROMIS-29 V2.1 is a reliable and valid measure for assessing the health-related quality of life domains in a cancer population, thus supporting their use in studies and oncology trials.
Introduction
Measurement of patient-reported outcome (PRO) enables a holistic assessment of treatment benefit, and the use of PRO measures is emphasized in many treatment guidelines [1]. Moreover, both the U.S. Food and Drug Administration (FDA) and the European Medicines Agency (EMA) encourage the assessment of PROs in anticancer drug development [2]. In cancer patients, the European Organisation for Research and Treatment of Cancer Quality of Life Core Questionnaire (EORTC QLQ-C30) [3], and the Functional Assessment of Cancer Therapy-General (FACT-G) [4] are most widely used to measure health-related quality of life (HRQoL). However, the purpose of cancer-specific measurements is to identify cancer treatment-related symptoms and functions that could make it difficult to compare with other diseases [5]. Therefore, a generic measurement score for PROs could also be needed to evaluate cancer’s relative burden compared with other diseases [6]. In addition, since long-term survival rates for many types of cancer have substantially improved over the past decades [7], there is also a need to measure HRQoL in patients’ different settings beyond cancer treatment itself. Therefore, comprehensive generic measures may add more predictive value for HRQoL of cancer patients than cancer-specific measures, which focus more on symptoms [8].
Generic measurements, such as the 36-item short-form health survey (SF-36) [9], and the EuroQoL-5D (EQ-5D) [10], were frequently used to assess the HRQoL of cancer patients [11]. Both measurements had reported limitations in measuring the HRQoL of patients with cancer. SF-36 does not include important symptoms for patients with cancer, such as fatigue, pain, anxiety, depression, and sleep [9], and it has been reported that the EQ-5D does not capture all aspects of health state that matter to patients, specifically in cancer [12]. Inevitably, unmeasured health-related aspects perceived to impact an individual’s quality of life (QoL) significantly generate inaccuracies in HRQoL measurements [12]. In the face of these challenges and limitations, the Patient-Reported Outcomes Measurement Information System 29 Profile v2.1 (PROMIS-29 V2.1), a multi-item measure for assessing generic profile HRQoL developed by the National Institutes of Health (NIH), has been suggested [13]. While cancer patients were included in the validation of PROMIS measures [13–15], studies were limited to specific cancer patients. Moreover, there is no psychometric evaluation of the PROMIS-29 V2.1 among cancer survivors.
Materials and Methods
1. Study participants and procedure
This was a cross-sectional study. Study participants were recruited from outpatient clinics of the Comprehensive Cancer Center at the Samsung Medical Center in Seoul, South Korea, from September to October 2018. Patients were eligible if they were aged 18 or older, diagnosed with cancer, receiving cancer treatment or completing active cancer treatment within 6 months, and able to speak and read Korean. We excluded patients who had any physical or psychiatric conditions that would interfere with completing the questionnaire. Trained researchers explained the purpose and procedures of the study to the participants.
2. Measurement
We used the Korean version of the PROMIS-29 Profile v2.1 (K-PROMIS-29 V2.1) obtained from the PROMIS Health Organization (https://www.promishealth.org). The PROMIS-29 V2.1 consists of 29 items across seven domains: physical function (four items), anxiety (four items), depression (four items), fatigue (four items), sleep disturbance (four items), ability to participate in social roles and activities (four items), pain interference (four items), and pain intensity (one item). We used a five-point Likert scale (range, 1 to 5) to measure the severity or frequency of the symptoms. The single pain intensity item is measured separately, and the response scale ranges from 0 (no pain) to 10 (worst pain imaginable). Items to evaluate the physical function and ability to participate in social roles and activities domains do not specify a time frame. For the other five domains, items pertain to the past seven days. Domain scores were obtained by summing the item scores for each domain. The PROMIS-29 V2.1 scale is scored using a T-score metric via the Assessment Center. The T-score rescales the raw score into a standardized T-score with a mean of 50 and a standard deviation (SD) of 10. When we calculated the T-score, we included all participants, even those with missing values, using the Assessment Center algorithm.
To examine convergent and discriminant validity, we used the EORTC QLQ-C30, a 30-item cancer-specific questionnaire. The EORTC QLQ-C30 includes five functional domains—physical (five items), role (two items), cognitive (two items), emotional (four items), and social (two items); one global health status scale (two items); three symptom scales—fatigue (three items), pain (two items), and nausea and vomiting (two items); and six single items—dyspnea, appetite loss, sleep disturbance, constipation, diarrhea, and financial difficulty that assess symptoms commonly reported by patients with cancer [3]. Participants rated each item on a Likert scale ranging from 1 (not at all) to 4 (very much), excluding the global health status items, which were rated from 1 (very poor) to 7 (excellent). Items to evaluate all domains pertain to the previous week, except for the physical function domain. Items to evaluate physical function do not specify a timeframe. We used the scoring procedures outlined in the manual to score the EORTC QLQ-C30 items [16] and linearly transformed the data to yield scores from 0 to 100; a higher score represented a better level of functioning. The EORTC QLQ-C30 has been validated, translated to Korean [17], and widely used to measure the QoL of cancer survivors in Korea.
We also asked study participants about their socio-demographic characteristics, including marital status, education level, monthly family income, and employment status. Clinical characteristics were obtained from electronic medical records.
3. Statistical analysis
The analysis was conducted using the raw score. To assess the reliability of the K-PROMIS-29 V2.1, we calculated the internal consistency of each domain using Cronbach’s α and the item-rest correlation for each item. It is generally accepted that an α of 0.6–0.7 indicates an acceptable level, and 0.8 or greater indicates a very good level of reliability [18].
To confirm the construct validity, we performed a principal component analysis (PCA) to determine the underlying structure of the K-PROMIS-29 V2.1. After extracting factors that had an eigenvalue > 1 using scree plot, we performed a principle axis factor procedure with a varimax rotation to extract latent constructs to simplify the loadings of items by removing the middle ground and more specifically identifying the factor upon which data load. Furthermore, we carried out a confirmatory factor analysis (CFA) using the maximum likelihood to test whether our factor structure fits the data. Several goodness-of-fit indices were used to evaluate the model fit, including the goodness-of-fit index, comparative fit index (CFI), standardized root-mean-squared residual (SRMR), non-normed fit index (NNFI), and Akaike’s information criterion (AIC). A CFI > 0.9, SRMR < 0.08, and NNFI ≥ 0.95 indicate a good fit to the data [19].
To examine convergent and discriminant validity, first hypotheses on the direction and magnitude were formulated [20] and summed item scores for each domain of the K-PROMIS-29 V2.1 (physical function, anxiety, depression, fatigue, sleep disturbance, ability to participate in social roles and activities, pain interference, and pain intensity) and linearly transformed domain score of EORTC QLQ-C30 (global health status, physical, role, cognitive, emotional, social, fatigue, pain, nausea, vomiting, dyspnea, appetite loss, sleep disturbance, constipation, diarrhea, and financial difficulty) were calculated. Then, we calculated Pearson’s correlation coefficients between the K-PROMIS-29 V2.1 and EORTC QLQ-C30. Moderate (0.5 < |r| < 0.7) or large correlations (|r| ≥ 0.7) were considered to indicate construct validity [21]. We completed a pairwise deletion in the analysis.
All significance tests were two-tailed, and p < 0.05 was considered significant. All data analyses were performed using STATA ver. 15 (StataCorp LLC, College Station, TX).
Results
1. Study participants
A total of 400 patients were enrolled in the study, and 349 (87.3%) completed the study questionnaire. Among the 51 patients who were excluded from the study due to missing responses, eight (15.7%), nine (17.6%), and 34 (66.7%) did not answer 1, 2, and more than three items, respectively. Of these missing responses, the item on sleep quality was not answered the most (9.8%).
Of the 349 patients, 170 (48.7%) were female and had a mean age (SD) of 54.4 (10.2) years. Among the participants, 11.3% had completed less than a middle school education (Table 1). The types of cancer that participants had included breast cancer (n=73, 20.9%), lung cancer (n=59, 16.9%), colorectal cancer (n=55, 15.8%), head and neck or esophageal (n=41, 11.8%), gastric cancer (n=17, 4.9%), and others. In the T-scores, the study sample reported higher depression (mean±SD, 51.0±8.5), anxiety (51.5±9.1), and sleep disturbance (52.1±7.7) scores compared to the general population (Table 2) [13].
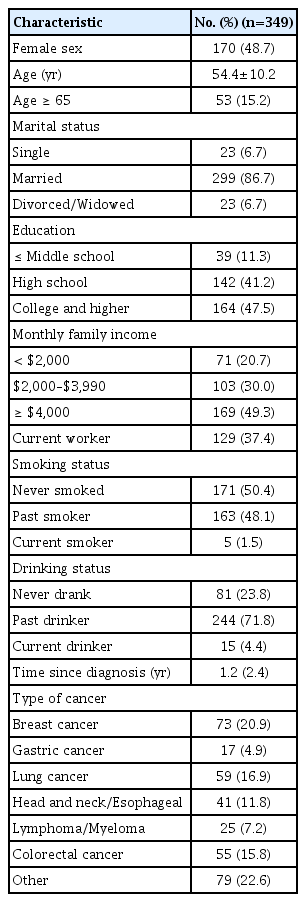
Characteristics of study population

Percentage of variance explained by each domain (item numbers represent the order in the instrument)
2. Construct validity
The Cronbach’s alpha coefficients of the seven domains in the K-PROMIS-29 V2.1 ranged from 0.81 to 0.96, indicating satisfactory internal consistency. Pain interference had the highest Cronbach’s α (0.96). Item-rest correlations, when any one of the items was removed, varied from 0.56 to 0.94. While all the items had generally acceptable levels of item-rest correlation (≥ 0.60), the item “In the past 7 days, my sleep was refreshing” had a relatively low correlation (r=0.56) with other items in the sleep disturbance domain (Table 2).
In the PCA, the factor loadings for the varimax rotated factors were obtained (Table 3, S1 Fig.). The variance explained by the seven-factor solution was 79.8%. The percentage of variance explained of F5, F1, F3, F7, F6, F4, and F2 were 9.3%, 18.2%, 11.8%, 6.3%, 6.8%, 11.6%, and 15.8% (Table 3), respectively. While other domains confirmed our hypothesis regarding the original constructs of the K-PROMIS-29 V2.1, “depression and anxiety” were combined as one domain, and sleep disturbance items were separated by “sleep quality” and “sleep was refreshing,” among others (S2 Table).
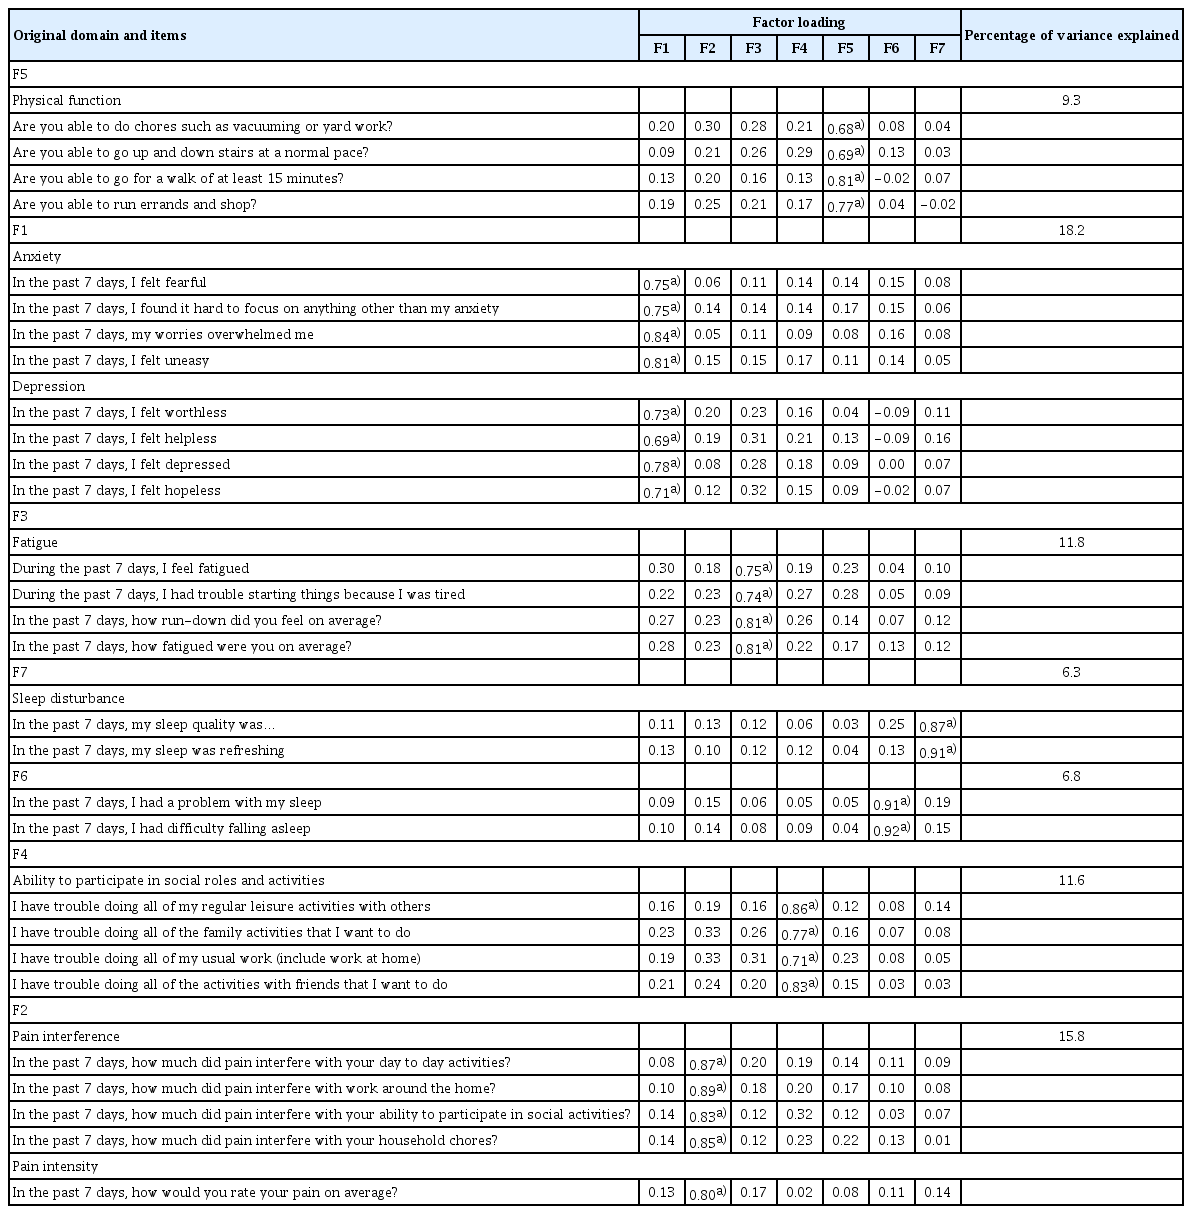
Exploratory factor analysis of the K-PROMIS-29 items
In the CFA, the goodness-of-fit indices for the K-PROMIS-29 V2.1 (Fig. 1) were high (CFI, 0.91; SRMR, 0.06; NNFI, 0.90 and AIC, 20114.171). However, “problem with my sleep” and “difficulty falling asleep” in the sleep domain had relatively large errors. Regarding the correlation between the domains in the K-PROMIS-29 V2.1, depression had a high correlation with anxiety (r=0.80).

Confirmatory factor analysis of the items in the Korean version of the Patient-Reported Outcomes Measurement Information System 29 Profile v2.1.
3. Convergent validity
In the convergent and discriminant validity of the K-PROMIS-29 V2.1, pain interference and physical function in the K-PROMIS-29 V2.1 and pain and physical functioning in the EORTC QLQ-C30 observed a large correlation (r=0.73 and r=0.71, respectively). In addition, the correlations between ability to participate in social role activities in the K-PROMIS-29 V2.1 and role functioning (r=0.65) and social functioning (r=0.52) in the EORTC QLQ-C30 were moderate. Regarding anxiety (r=−0.66) and depression (r=−0.55) in the K-PROMIS-29 V2.1, there were moderate correlations observed with emotional functioning in the EORTC QLQ-C30. Fatigue (r=0.66) and sleep disturbance (r=0.64) in the K-PROMIS-29 V2.1 were also moderately correlated with fatigue and insomnia in the EORTC QLQ-C30, respectively (Table 4).
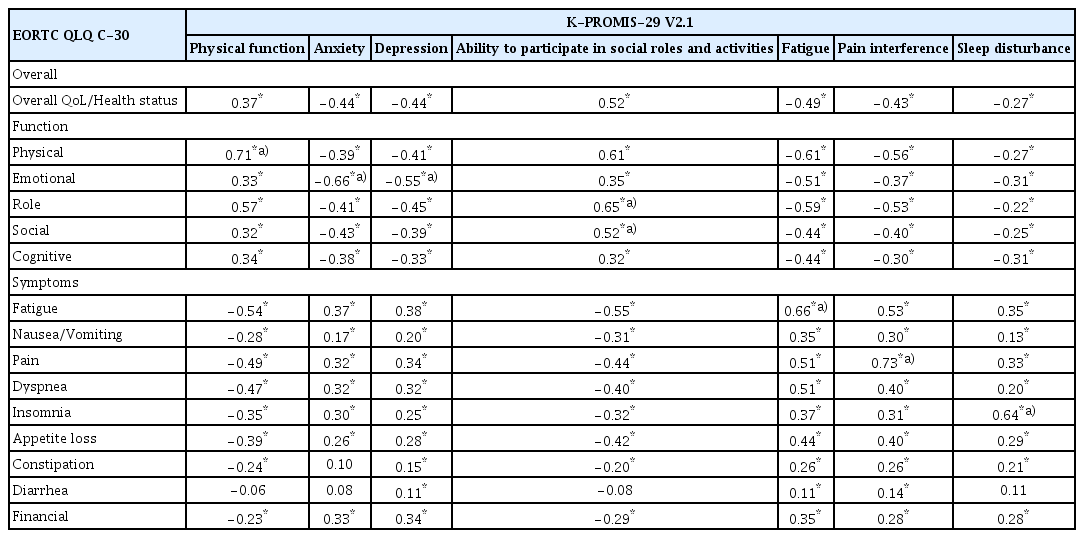
Pearson’s correlation coefficients comparing the K-PROMIS-29 V2.1 with EORTC QLQ-C30 (n=349)
Discussion
In this study, the Korean version of the PROMIS-29 V2.1 was found to be a reliable and valid measure of HRQoL among cancer patients. The goodness-of-fit indices of the K-PROMIS-29 V2.1 were also high. Moderate or higher correlations also demonstrated the convergent validity of the K-PROMIS-29 V2.1 with relevant EORTC QLQ-C30 questionnaires.
In total, 88% of participants completed all the questions without any missing items, which is a higher completion rate than those of other studies. Considering that over 15.2% and 11.3% of the study participants were older than 65 years and less than middle school graduates, the K-PROMIS-29 V2.1 seems to be a feasible instrument to evaluate HRQoL regardless of age and literacy level. In our study, the most commonly unanswered question by study participants was “My sleep was refreshing.” In previous studies conducted in Dutch [22], responders also felt that it was difficult to understand it. The researcher who conducted the previous study suggested alternatives items, such as “My sleep gave me new energy” which could improve understanding [22]. Our study participants might have difficulties in understanding the sentence because the word “refreshing” is not commonly used to describe sleep quality.
The results indicate that the internal consistency and reliability of the measure are high. All subdomains showed an acceptable Cronbach’s alpha level, which is considered acceptable for internal consistency [23]. Interestingly, in our study, items for anxiety and depression were loaded to one factor in PCA, and there was also a strong correlation between depression and anxiety in the CFA. This might be because these are the two most common symptoms experienced by cancer survivors. In a previous study, anxiety and depressive disorder was commonly cited at a 25%–40% overlap [24]. In other words, because many cancer patients experience depression and anxiety simultaneously, items loaded to one factor reflect a high level of negative affect, which might be common to both depression and anxiety [25]. Given the large correlations among the two constructs, further study is needed to investigate hierarchical and multidimensional models of depression and anxiety that will allow us to “borrow” information between these constructs and create an even more efficient computer adaptive tests for their assessment.
Although other domains and items had strong to moderate correlations with each other, items asking about sleep quality had relatively low item-rest correlations with the other two items of the sleep disturbance domain: “In the past 7 days, I had a problem with my sleep” and “In the past 7 days, I had difficulty falling asleep,” and they also had large errors in the CFA. In fact, they were loaded to a different factor in the PCA. In a previous study, sleep initiation and sleep continuity appeared as separate constructs, and people perceived feeling refreshed in the morning and good sleep continuity as good sleep [26].
The convergent validity of the K-PROMIS-29 V2.1 was demonstrated by its varying degrees of correlation with the EORTC QLQ-C30. The K-PROMIS-29 V2.1 domain correlated with the comparable EORTC QLQ-C30 subdomain. Moreover, symptoms that have been reported frequently in cancer patients, such as anxiety, depression, fatigue, and sleep disturbance, might be more sensitive to the K-PROMIS-29 V2.1 than the EORTC QLQ-C30, as the K-PROMIS-29 V2.1 includes multiple items to assess those conditions [13]. For example, while the EORTC QLQ-C30 uses one item (Did you feel depressed?) to assess depression, the K-PROMIS-29 V2.1 evaluates depression symptoms using multiple items, including “worthless, helpless, depressed, or hopeless.” Similarly, sleep quality is also assessed by a single item with the EORTC QLQ-C30, and it might not capture the construct, have fewer points of discrimination, and lack a measure of internal consistency reliability compared to the sleep domain of the K-PROMIS-29 V2.1, which includes multiple items.
This study has several limitations. First, we recruited only individuals visiting the outpatient clinic at one institution in Korea. These findings may not be generalizable to patients in other settings. However, this study included patients with multiple types of cancer, and it could cover many areas of cancer. In addition, we included patients with very low educational attainment, suggesting that the K-PROMIS-29 V2.1 has acceptable measurement properties for use in diverse patients with cancer. Second, we did not conduct a test-retest. Therefore, additional research is needed to evaluate reliability. However, since many studies have already proven the reliability of the PROMIS-29, we expected the results to be similar to those in previous studies. Finally, we did not include other general measurements, such as the SF-36 or EQ-5D. However, previous studies have already confirmed that the PROMIS-29 is highly correlated with the SF-36 and EQ-5D [27,28]. In addition, the PROMIS-29 produced more sensitivity to function changes than the SF-36 [29], and had a higher correlation with self-reported health, more sensitive, and required fewer respondents than the EQ-5D [27].
In conclusion, this study adds to the evidence base supporting the reliability and validity of K-PROMIS-29 V2.1 in assessing QoL among Korean speakers being treated for cancer. The PROMIS-29 is quickly becoming a standard PRO research and practice measure and is recommended for initial outcome assessment [30]. In addition, PROMIS integrates item response theory and computer adaptive testing to create individualized questionnaires [13]. Therefore, this study provides psychometric evidence for the reliability and construct validity of the K-PROMIS-29 V2.1 measures in a cancer population, supporting their use in studies and oncology trials.
Electronic Supplementary Material
Supplementary materials are available at Cancer Research and Treatment website (https://www.e-crt.org).
Notes
Ethical Statement
After providing informed consent, participants were asked to complete the paper questionnaire. This study was approved by the Institutional Review Board (IRB) of the Samsung Medical Center (IRB number: SMC-2017-03-103-012).
Author Contributions
Conceived and designed the analysis: Kang D, Kim Y, Lim J, Yoon J, Kim S, Kang E, Nam H, Shim S, Lee M, Bok H, Lee SW, Shin SY, Ahn JS, Oh D, Cho J.
Collected the data: Kim Y, Yoon J, Shim S, Lee M, Oh D, Cho J.
Contributed data or analysis tools: Kang D, Kim Y, Lim J, Bok H, Ahn JS, Oh D, Cho J.
Performed the analysis: Kang D, Kim Y, Lim J, Cho J.
Wrote the paper: Kang D, Kim Y, Lim J, Yoon J, Kim S, Kang E, Nam H, Shim S, Lee M, Bok H, Lee SW, Shin SY, Ahn JS, Oh D, Cho J.
Conflicts of Interest
Conflict of interest relevant to this article was not reported.
Acknowledgments
This research was supported by a grant (18182MFDS407) from the Ministry of Food and Drug Safety in 2018 and the Basic Science Research Program through the National Research Foundation of Korea (NRF) funded by the Ministry of Education (2020R1I1A20-74210).