Correlation of NUF2 Overexpression with Poorer Patient Survival in Multiple Cancers
Article information
Abstract
Purpose
NUF2 has been implicated in multiple cancers recently, suggesting NUF2 may play a role in the common tumorigenesis process. In this study, we aim to perform comprehensive meta-analysis of NUF2 expression in the cancer types included in the Cancer Genome Atlas (TCGA).
Materials and Methods
RNA-sequencing data in 31 cancer types in the TCGA data and 11 independent datasets were used to examine NUF2 expression. Silencing NUF2 using targeting shRNAs in hepatocellular carcinoma (HCC) cell lines was used to evaluate NUF2’s role in HCC in vitro and in vivo.
Results
NUF2 up-regulation is significantly observed in 23 out of the 31 cancer types in the TCGA datasets and validated in 13 major cancer types using 11 independent datasets. NUF2 overexpression was clinically important as high NUF2 was significantly associated with tumor stages in eight different cancers. High NUF2 was also associated with significantly poorer patient overall survival and disease-free survival in eight and six cancers, respectively. We proceeded to validate NUF2 overexpression and its negative association with overall survival at the protein level in an independent cohort of 40 HCC patients. Compared to the non-targeting controls, NUF2 knockdown cells showed significantly reduced ability to grow, migrate into a scratch wound and invade the 8 μm porous membrane in vitro. Moreover, NUF2 knockdown cells also formed significantly smaller tumors than control cells in mouse xenograft assays in vivo.
Conclusion
NUF2 up-regulation is a common feature of many cancers. The prognostic potential and functional impact of NUF2 up-regulation warrant further studies.
Introduction
Cancer incidence and mortality increase rapidly worldwide, making cancer the leading cause of death in many countries. The International Agency for Research on Cancer predicts that new cancer cases and cancer deaths in 2018 will be 18.1 million and 9.6 million, respectively [1]. One in five persons will develop cancer before the age of 75 years and on average half of the cancer patient will not survival beyond five years from diagnosis [2]. Thus, the finding novel targets to improve current cancer treatment is an urgent global need.
Among the six hallmarks of cancers expertly summarized by Douglas Hanahan and Robert Weinberg in 2011, it is arguably the ability to proliferate in an uncontrolled manner as the most fundamental trait of all cancer cells [3]. Targeting a specific crucial component of the cell cycle pathway is a strategy that may potentially benefit the treatment of many cancers. NUF2 component of NDC80 kinetochore complex (NUF2) is a component of a conserved protein complex associated with the centromere [4]. Our group has recently demonstrated that high NUF2 transcript expression is a good prognostic biomarker to predict early tumor recurrence post-surgical resection in hepatocellular carcinoma (HCC) [5]. Similarly, Xu et al. [6] reported NUF2 transcript as a prognostic biomarker of breast cancer. NUF2 inhibition has been reported to result in reduced tumor cell growth in cancers of the brain [7], colon [8], liver [9], and pancreas [10,11]. The fact that NUF2 has been implicated in multiple cancers suggests NUF2 plays an important role in cell proliferation. However, NUF2 has not been comprehensively analyzed in a pan-cancer context to reveal its expression patterns and correlation with clinical parameters in various cancers.
Large collaborative projects such as the Cancer Genome Atlas (TCGA) and the International Cancer Genome Consortium (ICGC) provide a standardized platform to analyze a large number of cancer samples across various cancer types [12–14]. In this study, we primarily employed TCGA pan-cancer data to examine the NUF2 transcript expression in a total of 31 cancer types and correlate NUF2 transcript status with clinical parameters such as tumor stage and patient survival data. We found NUF2 overexpression is a common feature of 23 cancer types which are largely confirmed by independent datasets from various independent single cancer studies. High NUF2 transcript level is significantly associated with poorer patient overall survival (OS) and disease-free survival (DFS) in a subset of cancer types. We proceeded to further validate NUF2 overexpression at the protein level in human HCC and revealed the functional impact of silencing NUF2 in HCC cells.
Materials and Methods
1. Patient samples and cell lines
Formalin-fixed paraffin-embedded (FFPE) tissue sections of 40 HCC patients were collected from Zhejiang Shangyu People’s Hospital, Shaoxing, PR China. All samples were clinically confirmed HCC by histopathology.
The HepG2 cells were purchased from ATCC (HB-8065) with proof of authenticity. Huh7 cells were bought from The Japanese Collection of Research Bioresources (JCRB) Cell Bank (Osaka, Tokyo, Japan) and has been validated by Genetica DNA Laboratories (Cincinnati, OH). All cells were grown in Dulbecco’s modified Eagle’s medium (DMEM) with 4.5 g/L high glucose, 15 mM HEPES buffer and 10% fetal calf serum in a humidified incubator at 37°C with 5% CO2. HepG2 cells were grown on collagen-coated surfaces to enable monolayer growth.
2. NUF2 analysis in TCGA, ICGC, and Gene Expression Omnibus datasets
Normalized NUF2 transcript expression in 9,498 tumor samples and 5,540 non-tumor samples from 31 distinct tumor types from TCGA and the Genotype-Tissue Expression (GTEx) datasets were extracted using the GEPIA2 web resource [15]. Normalized NUF2 transcript expression were manually extracted from GSE40355, GSE42568, GSE27678, GSE26566, GSE110225, GSE107591, GSE16011, GSE30219, GSE28735, and GSE15605 datasets from Gene Expression Omnibus (GEO) database. Normalized NUF2 transcript expression was manually extracted from LINC-JP dataset from the ICGC data portal. Normalized NUF2 transcript expression was extracted from 48 cell lines representing 24 cancer types from the Broad Institute Cancer Cell Line Encyclopedia (CCLE).
3. Reverse transcription quantitative polymerase chain reaction
Reverse transcription quantitative polymerase chain reaction was performed as previously described [16]. Briefly, cDNA was synthesized from 200 ng of total RNA using a high capacity cDNA archive kit (Applied Biosystems, Foster City, CA) according to the manufacturer’s instructions. Real-time PCR was performed in an Applied Biosystems 9700 real-time PCR system using the KAPA SYBR FAST Universal kit (Kapa Biosystems, Boston, MA). Amplification reactions included cDNA template (25 ng), gene-specific primers (0.25 pmol/μL), and 2× PCR Master Mix (5 μL; Kapa Biosystems) in a total volume of 10 μL. Amplification conditions include an initial denaturation at 95°C for 15 minutes, followed by 40 cycles at 95°C for 30 seconds, 55°C for 30 seconds, and 72°C for 30 seconds. SYBR Green fluorescence was measured after each extension step. The primers used in this study were NUF2-F-TATCCAAATCCAAAGCCTGAAGTC; NUF2-R-GCAGTCTCAAAGTCATTCACCC; NCAPG-F-AAGAAAGAACTCAAGATGGCTG; NCAPG-R-AGCATCATTCTTCTCTATGTGG; GAPDH-F-CATTTCCTGGTATGACAACGA; GAPDH-R-CTTCCTCTTGTGCTCTTGCT.
4. Immunohistochemistry
Reagents used for immunohistochemistry (IHC) staining were obtained from Dako A/S (Glostrup, Denmark) and were used according to the manufacturer’s instructions. Paraffin sections (5 μm) were dewaxed with xylene and rehydrated through ethanol/water dilutions. Antigen retrieval was performed with heat-induced epitope retrieval using 10 mM citrate buffer, pH 6. Endogenous peroxidase activity in the sections was quenched by immersion in 3% hydrogen peroxide (Dako #S2023) for 5 minutes. Sections were incubated with rabbit polyclonal primary antibody against NUF2 (HPA076604, Sigma, St. Louis, MO) and diluted in antibody diluent (Dako #S3022) for 30 minutes at room temperature. MAbs were detected with mouse/rabbit Envision+ (Dako #K5007), and the reactions were visualized by incubating the sections with DAB+ (Dako #K5007) for two periods of 3 minutes. Washes between incubations were carried out with TBS containing 0.05% Tween 20, pH 7.6 (Dako #S3006). Sections were counterstained with hematoxylin. Evaluation of NUF2 protein expression was performed using a 0 to 3+ scale according to the intensity of staining from two IHC slides per patient.
5. Measurement of cell growth, migration, and invasion in vitro
Cell growth in vitro was measured between HCC cells stably expressing shRNA against NUF2 or non-targeting control, using the IncuCyte Zoom Continuous Live-cell Imaging & Analysis System (Essen BioScience, Ann Arbor, MI). Five thousand cells were seeded in one well of a 96-well plate and cell growth measurements were recorded as relative confluence over time. Relative cell growth was normalized ratio against cell confluence at the start of the assay.
Cell migration in vitro was measured using the scratch wound assay. HCC cells were seeded into 96 well image lock plates. A fixed width wound was made to 100% confluent cells using the semi-manual WoundMaker tool (Essen Bioscience). The plates were imaged hourly for 48 hours. The wound healing was measured as relative cell confluency inside the wound region over time using the Incucyte software.
Cell invasion in vitro was measured using trans-well chambers coated with 1:30 diluted Matrigel Basement Membrane Matrix (Corning Life Sciences, Corning, NY). 1×10⁵ cells were seeded into upper chambers (8 μm pore size, Corning Life Sciences) in serum-free DMEM media while the lower chamber was filled with DMEM supplemented with 20% FBS. After incubation for 48 hours at 37°C, the cells in the upper chamber that did not invade through the pores were wiped out with cotton wool. The cells in the lower chamber were fixed with methanol and stained with 0.5% crystal violet. Cells are then counted and imaged at ×40 magnification.
6. Xenograft tumor growth in vivo
All mice experiments were performed in accordance to ARRIVE standards and approved by the SingHealth Institutional Animal Care and Use Committee (IACUC). NCr-Foxn1nu nude mice were purchased from InVivos. Huh7 cells stably expressing shRNA against NUF2 (shNUF2-1 & -2) or non-targeting controls (shControl-1 & -2) were transplanted subcutaneously with 3 million cells in 10% Matrigel per mouse, bilaterally, four mice per group. Tumor weight was measured when mice were euthanized 50 days after tumor cell implantation.
7. Bioinformatic analysis
Students’ t test was used for comparing means between two groups. One-way ANOVA was used for comparing means between three groups. Fisher exact test in examining associations between categorical variables. Ingenuity Pathway Analysis (IPA) software was used to construct interaction networks among the top 100 NUF2-correlated genes (S1 Table). The gene expression data were divided into NUF2 high and low expression using median cut-off and gene set enrichment analysis (GSEA) was performed using GSEA software ver. 4.0.1 with MsigDB database using c2.cp.kegg.v7.0 gene sets [17,18]. Significantly enriched gene sets were chosen with the cutoff of false discovery rate < 0.05. Kaplan-Meier survival analysis was used to analyze the association of NUF2 status with patient OS and DFS. Kaplan-Meier survival analysis on TCGA dataset was performed on GEPIA2 [15]. Kaplan-Meier survival analysis on independent datasets from GEO, ICGC, and local IHC datasets were performed on SPSS Inc. (Chicago, IL). Multivariate analyses of prognostic factors, Cox proportional hazards regression was applied. Statistical significance is attained when p < 0.05.
Results
1. NUF2 overexpression in many cancers
We examined NUF2 transcript expression in 9,498 tumor samples and 5,540 non-tumor samples from 31 distinct tumor types from the TCGA and the GTEx datasets. NUF2 transcript variants 1 and 2, both encoding the same protein, are the most predominant forms seen in all cancers (S2 Fig.). NUF2 transcript was found to be significantly overexpressed in tumor versus non-tumor samples in 23 cancer types (p < 0.05) (Fig. 1A). In contrast, NUF2 was significantly under-expressed in tumor versus non-tumor samples in two cancers, acute myeloid leukemia (LAML) and testicular germ cell tumors (TGCT) (p < 0.05) (Fig. 1B). In the remaining six cancer types, NUF2 expression was comparable between tumor and non-tumor samples in kidney chromophobe (KICH) (Fig. 1C). NUF2 expression was observed to be generally higher in tumor versus non-tumor samples in kidney renal clear cell carcinoma (KIRC), kidney renal papillary cell carcinoma (KIRP), pheochromocytoma and paraganglioma (PCPG), prostate adenocarcinoma (PRAD), and thyroid carcinoma (THCA), although the differences were not statistically significant (Fig. 1C). In 11 independent datasets from the GEO and ICGA databases, we successfully validated significant NUF2 transcript overexpression in 13 cancer types (Fig. 2A). NUF2 transcript expression was the highest in normal testis tissue, followed by the fetal liver and bone marrow tissue. In contrast, NUF2 expression was very low for most adult tissues such as the brain, liver, kidney, and colon (Fig. 2B, left panel). Furthermore, NUF2 transcript expression in 48 cancer cell lines representing 24 cancer types was found to be significantly higher than the respective normal tissues except testis (Fig. 2B, right panel). This is consistent with the previous observation that NUF2 expression was lower in TGCT compared to normal testis tissues. In summary, NUF2 expression is up-regulated in tumor samples compared to non-tumor samples in the majority of cancer types, suggesting NUF2 may play an important role in the generic tumorigenesis process which is common among multiple cancers.
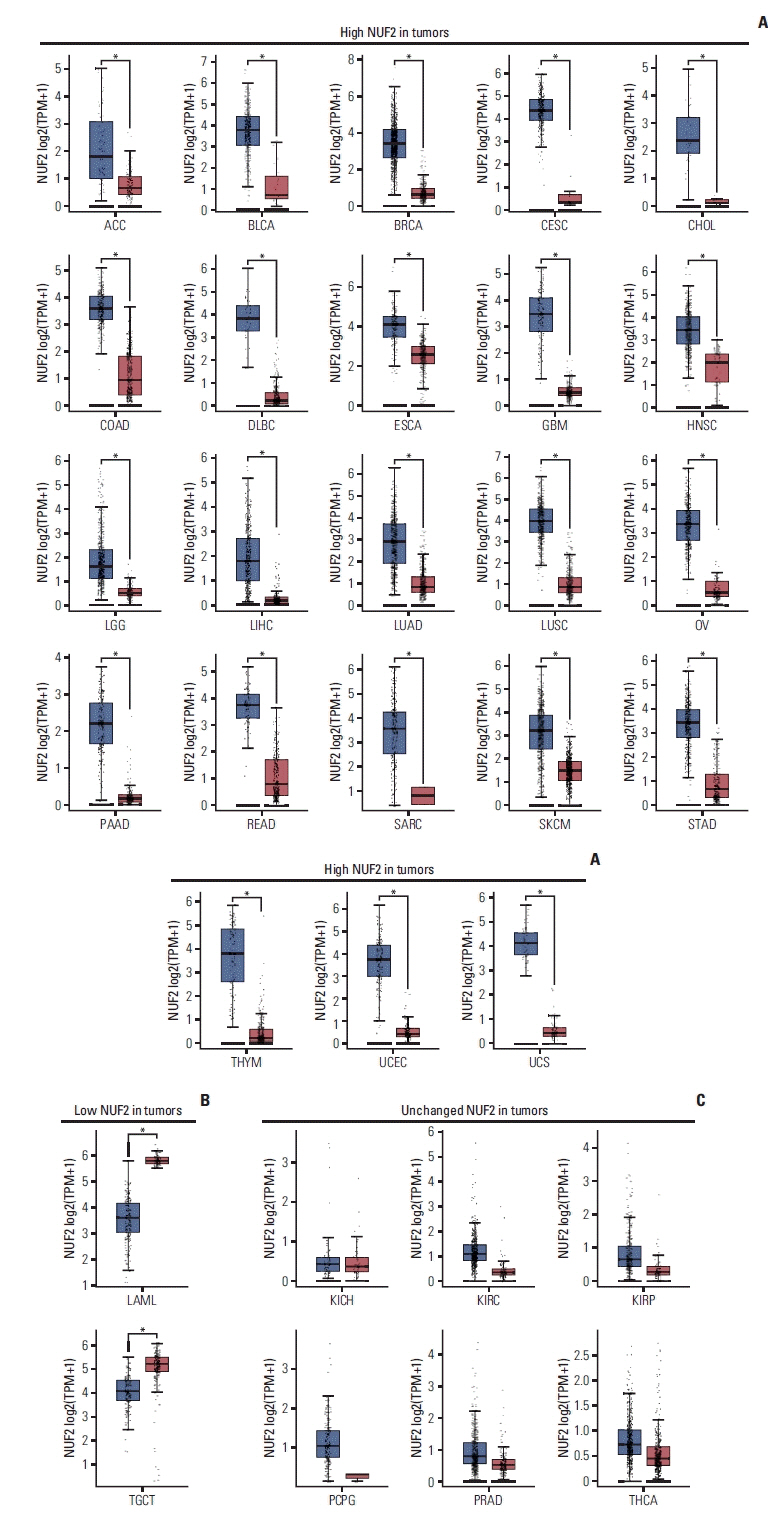
NUF2 expression in tumor versus non-tumor samples in 31 cancer types. (A) Boxplots showing significant overexpression of NUF2 in tumor samples compared to non-tumor samples in 23 cancer types. (B) Boxplots showing significant under-expression of NUF2 in tumor samples compared to non-tumor samples in LAML and TGCT. (C) Boxplots showing NUF2 expression is not statistically significantly different between tumor samples and non-tumor samples in six cancer types. Each dot indicates a sample. The red box on the left represents tumor samples (T) while the grey box on the right represents non-tumor (N) samples. The asterisks indicate statistically significant NUF2 differential expression between T and N samples with unpaired Student’s t test p < 0.05. ACC, adrenocortical carcinoma; BLCA, bladder urothelial carcinoma; BRCA, breast invasive carcinoma; CESC, cervical squamous cell carcinoma and endocervical adenocarcinoma; CHOL, cholangiocarcinoma; COAD, colon adenocarcinoma; DLBC, lymphoid neoplasm diffuse large B-cell lymphoma; ESCA, esophageal carcinoma; GBM, glioblastoma multiforme; HNSC, head and neck squamous cell carcinoma; KICH, kidney chromophobe; KIRC, kidney renal clear cell carcinoma; KIRP, kidney renal papillary cell carcinoma; LAML, acute myeloid leukemia; LGG, brain lower grade glioma; LIHC, liver hepatocellular carcinoma; LUAD, lung adenocarcinoma; LUSC, lung squamous cell carcinoma; OV, ovarian serous cystadenocarcinoma; PAAD, pancreatic adenocarcinoma; PCPG, pheochromocytoma and paraganglioma; PRAD, prostate adenocarcinoma; READ, rectum adenocarcinoma; SARC, sarcoma; SKCM, skin cutaneous melanoma; STAD, stomach adenocarcinoma; TGCT, testicular germ cell tumors; THCA, thyroid carcinoma; THYM, thymoma; TPM, transcripts per milion; UCEC, uterine corpus endometrial carcinoma; UCS, uterine carcinosarcoma.
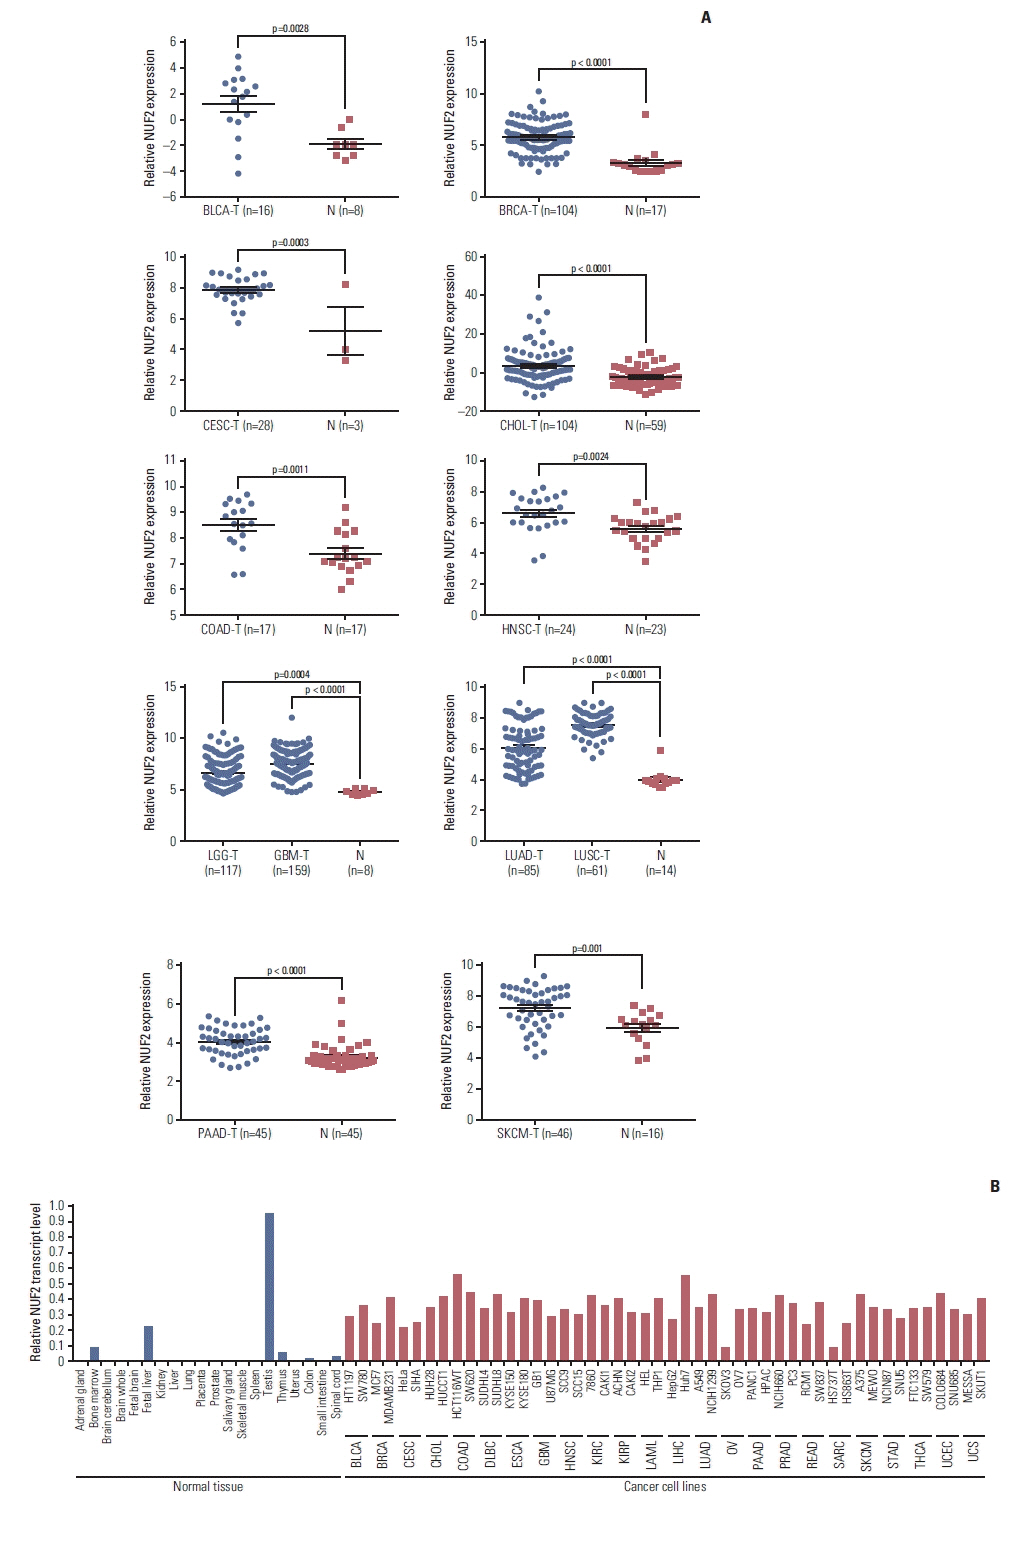
High NUF2 level is consistently observed in multiple cancer patient datasets and cell lines. (A) Overexpression of NUF2 transcript in tumors versus non-tumor tissues is validated in BLCA (GSE40355), BRCA (GSE42568), CESC (GSE27678), CHOL (GSE26566), COAD (GSE110225), HNSC (GSE107591), LGG & GBM (GSE16011), LUAD & LUSC (GSE30219), PAAD (GSE28735), and SKCM (GSE15605). Relative NUF2 expression is expressed as normalized probe intensity in Log2 scale for microarray data or RPKM for RNA-sequencing data. (B) Normalized NUF2 transcript expression in 20 normal tissues (left panel) and 48 cancer cell lines from 24 cancer types. NUF2 transcript expression is measured using RT-qPCR normalized against GAPDH in 20 normal tissues and MCF7, HepG2, HCT116WT, Huh7, and THP1 cell lines. NUF2 transcript expression of 48 cancer cell lines is retrieved from Cancer Cell Line Encyclopedia (CCLE) and normalized against the average factor according to the five common cell lines. BLCA, bladder urothelial carcinoma; BRCA, breast invasive carcinoma; CESC, cervical squamous cell carcinoma and endocervical adenocarcinoma; CHOL, cholangiocarcinoma; COAD, colon adenocarcinoma; DLBC, lymphoid neoplasm diffuse large B-cell lymphoma; ESCA, esophageal carcinoma; GBM, glioblastoma multiforme; HNSC, head and neck squamous cell carcinoma; KIRC, kidney renal clear cell carcinoma; KIRP, kidney renal papillary cell carcinoma; LAML, acute myeloid leukemia; LGG, brain lower grade glioma; LIHC, liver hepatocellular carcinoma; LUAD, lung adenocarcinoma; LUSC, lung squamous cell carcinoma; N, non-tumor; OV, ovarian serous cystadenocarcinoma; PAAD, pancreatic adenocarcinoma; PRAD, prostate adenocarcinoma; READ, rectum adenocarcinoma; RPKM, reads per kilo base per million mapped reads; RT-qPCR, reverse transcription quantitative polymerase chain reaction; SARC, sarcoma; SKCM, skin cutaneous melanoma; STAD, stomach adenocarcinoma; T, tumor; THCA, thyroid carcinoma; UCEC, uterine corpus endometrial carcinoma; UCS, uterine carcinosarcoma.
2. Association of NUF2 with tumor stage and patient survival
To evaluate the clinical significance of NUF2 overexpression in multiple cancers, we correlated NUF2 expression with tumor stages as classified according to the American Joint Committee on Cancer staging system. As shown in Fig. 3, high NUF2 transcript expression was significantly correlated with advanced tumor stages (stage III or IV) in cancers of the adrenal gland (ACC), kidney (KICH, KIRC, and KIRP), liver (LIHC), lung (LUAD and LUSC), and thyroid (THCA).
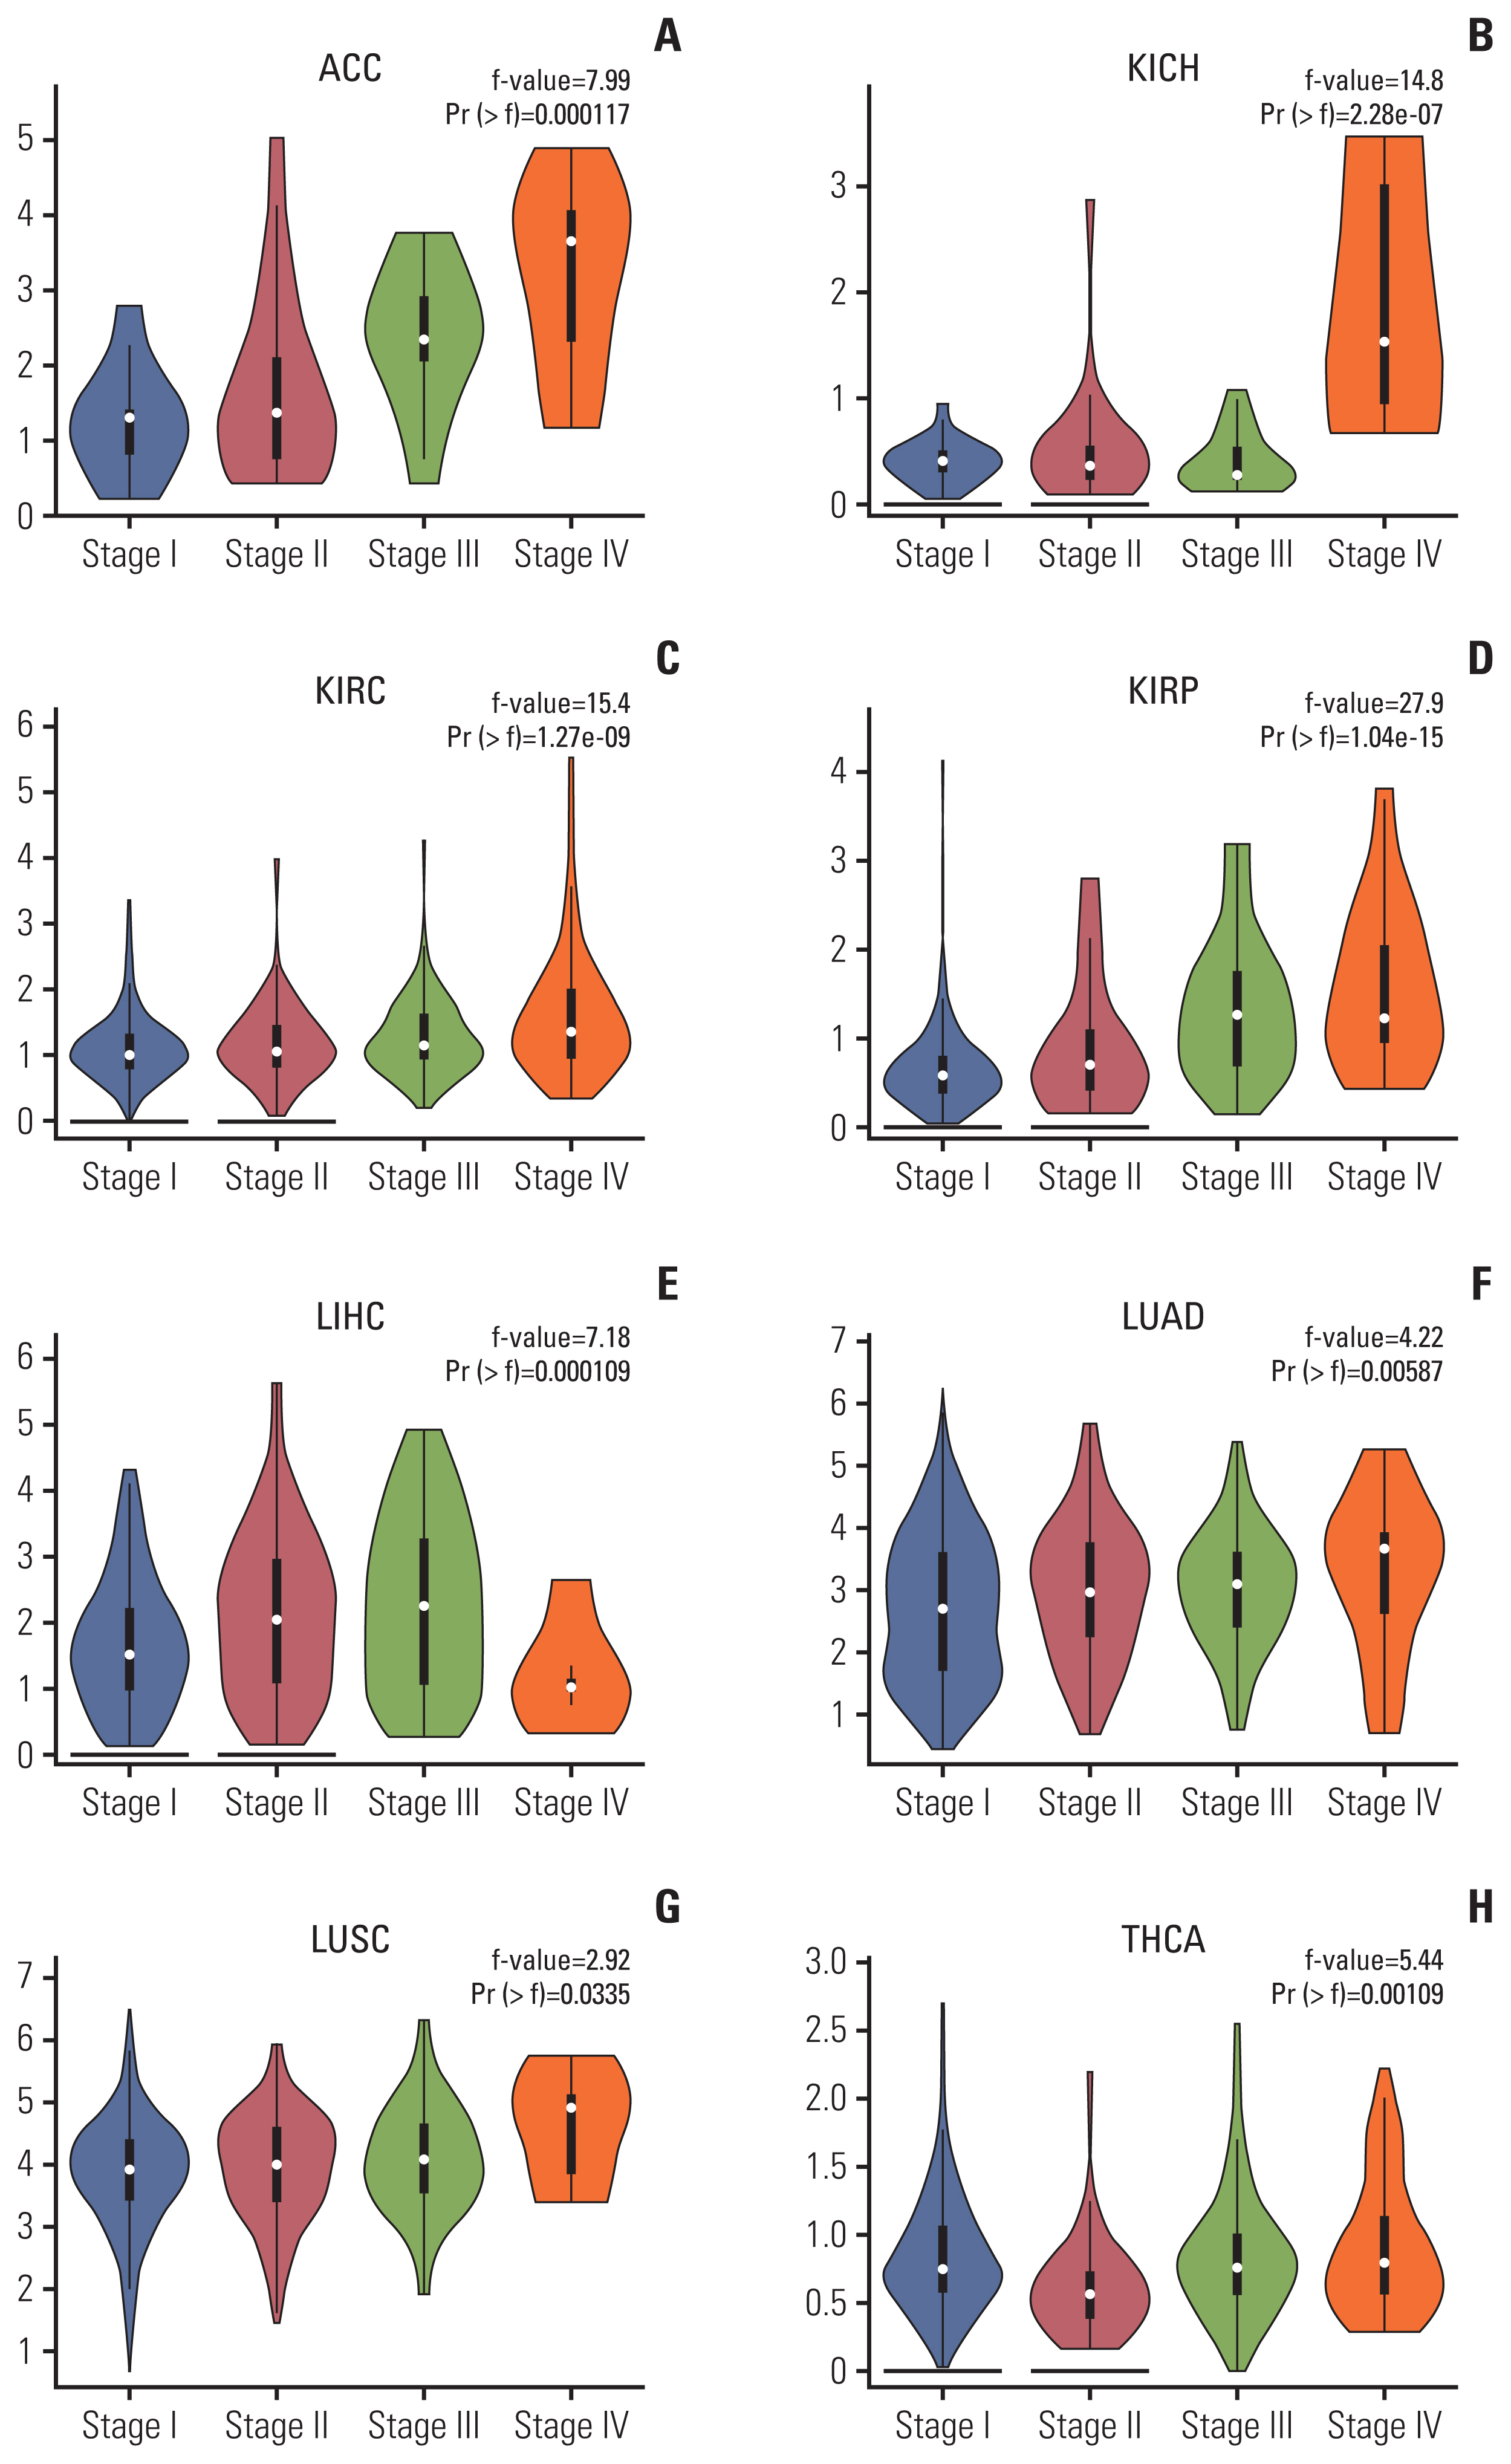
NUF2 expression is associated with tumor stages in eight cancer types. Violin plots showing higher NUF2 expression in more advanced stages (III and IV) in adrenocortical carcinoma (ACC) (A), kidney chromophobe (KICH) (B), kidney renal clear cell carcinoma (KIRC) (C), kidney renal papillary cell carcinoma (KIRP) (D), liver hepatocellular carcinoma (LIHC) (E), lung adenocarcinoma (LUAD) (F), lung squamous cell carcinoma (LUSC) (G), and thyroid carcinoma (THCA) (H).
Moreover, high tumor NUF2 level was significantly associated poorer patient OS in ACC, KIRC, KIRP, LGG, LIHC, LUAD, PAAD, and SARC with hazard ratios ranging from 1.6 in LUAD to 8.9 in ACC (Fig. 4A). High NUF2 level was also significantly associated with poorer patient DFS in ACC, KIRP, LGG, LIHC, PRAD, and SARC with hazard ratios ranging from 1.6 in LIHC to 4.3 in ACC (Fig. 4B). The most significant difference was observed in ACC dataset. ACC patients with high NUF2 transcript expression had a median OS of approximately 40 months and a median DFS of approximately 20 months while ACC patients with low NUF2 had median OS and DFS of more than 150 months (Fig. 4A and B).
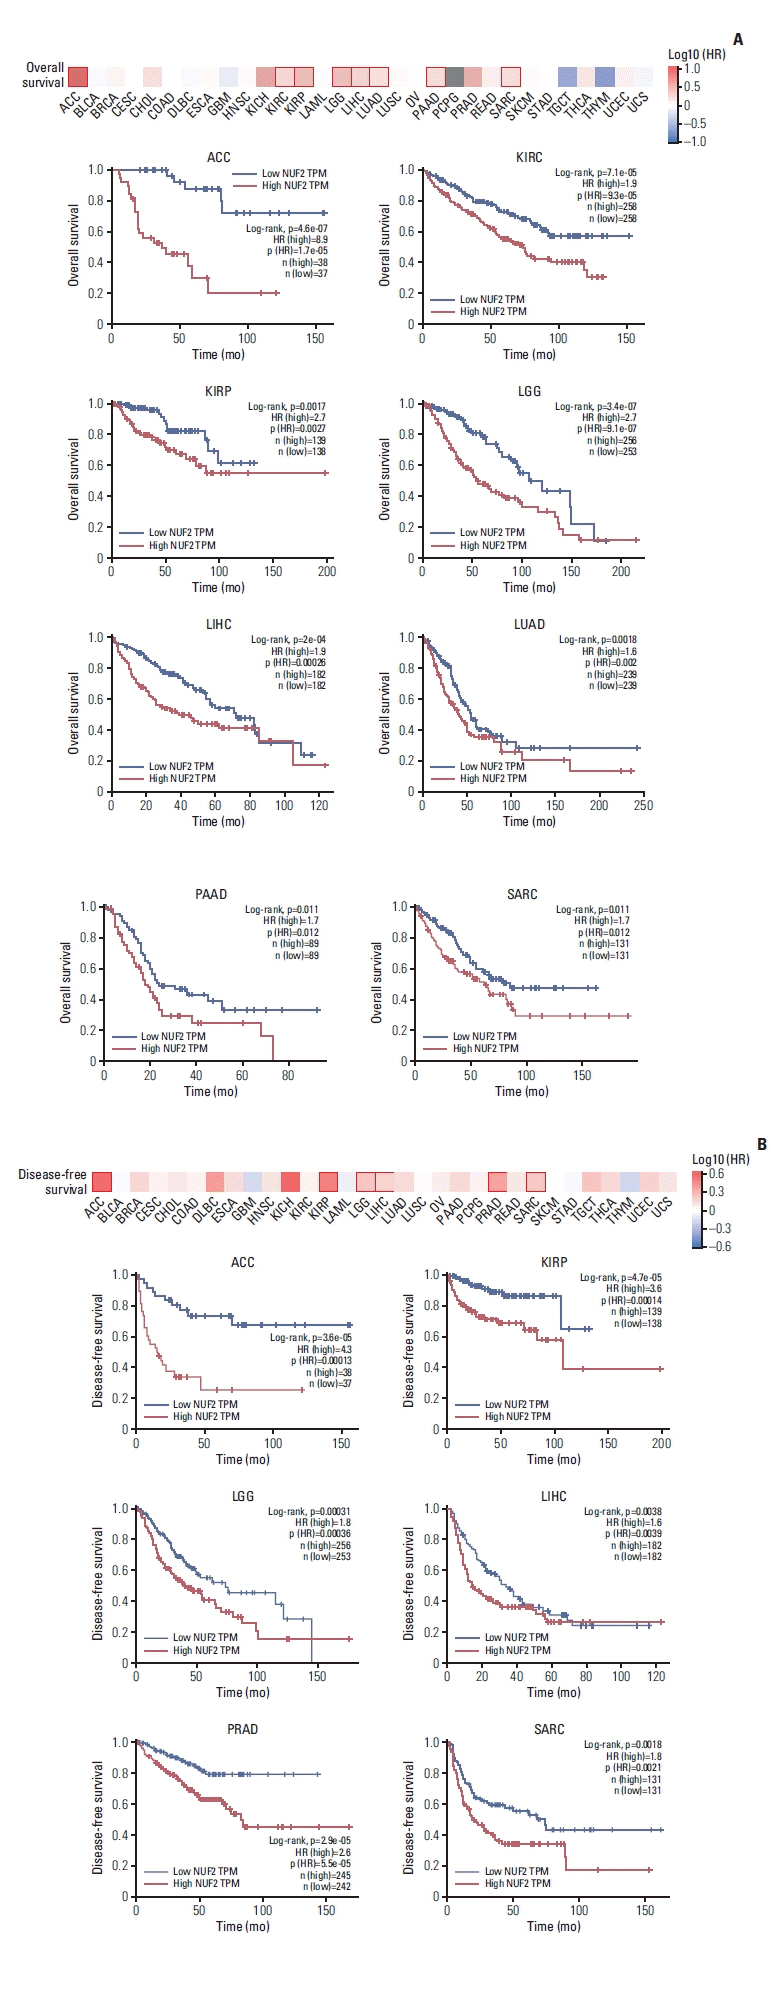
High NUF2 level is significantly associated with poorer patient survival in multiple cancer types. (A) Top: Overall survival map showing log10 (HR) between NUF2 high and NUF2 low tumors based on median NUF2 expression in 31 cancer types. The red box indicates a significant difference at p < 0.05. Bottom: Kaplan-Meier survival curve analysis showing high NUF2 level is significantly associated with poorer overall survival in nine cancer types including adrenocortical carcinoma (ACC), kidney renal clear cell carcinoma (KIRC), kidney renal papillary cell carcinoma (KIRP), brain lower grade glioma (LGG), liver hepatocellular carcinoma (LIHC), lung adenocarcinoma (LUAD), pancreatic adenocarcinoma (PAAD), sarcoma (SARC), skin cutaneous melanoma (SKCM), stomach adenocarcinoma (STAD), testicular germ cell tumors (TGCT), thyroid carcinoma (THCA), thymoma (THYM), uterine corpus endometrial carcinoma (UCEC), and uterine carcinosarcoma (UCS). HR, hazard ratio; TPM, transcripts per milion. (B) Top: Disease-free survival map showing log10 (HR) between NUF2 high and NUF2 low tumors based on median NUF2 expression in 31 cancer types. The red box indicates a significant difference at p < 0.05. Bottom: Kaplan-Meier survival curve analysis showing high NUF2 level is significantly associated with poorer disease-free survival in six caner types including ACC, KIRP, LGG, LIHC, PRAD, and SARC.
3. High NUF2 expression in human HCC
We proceeded to examine NUF2 overexpression in human HCC further. In an independent 337 Japanese patient cohort in the ICGC LINC-JP dataset, NUF2 transcript expression was significantly higher in tumor compared to non-tumor samples (Fig. 5A). High NUF2 transcript level was also associated with significantly poorer patient OS in this LINC-JP cohort (Fig. 5B), consistent with our previous observation in the TCGA-LIHC dataset (Figs. 1A and 4A). As both HCC datasets only examined NUF2 transcript expression, we performed IHC staining to quantitate NUF2 protein expression in FFPE samples from 40 HCC patients. As shown in Fig 5C, NUF2 protein expression was consistently found to be higher in tumor versus paired adjacent non-tumor of HCC patients. High NUF2 protein was associated with significantly poorer patient OS (Fig. 5D). We subsequently correlated NUF2 protein levels with clinic-pathological parameters of these 40 HCC patients (Table 1). High NUF2 protein level was significantly associated with tumor recurrence (p < 0.01). NUF2 and tumor size are independent prognostic predictors of HCC patient OS (Table 2).

NUF2 overexpression in HCC. (A) Box dot plot showing significant higher NUF2 transcript in tumor versus non-tumor tissues from LINC-JP dataset in ICGC. (B) Kaplan-Meier survival curve analysis showing high NUF2 transcript level is associated with significantly poorer overall survival in the same LINC-JP dataset. (C) Immunohistochemistry staining using NUF2 specific antibody in a representative HCC patient section from a local cohort of 40 patients. NUF2 protein is found to be significantly higher expressed, compared to the paired adjacent non-tumor section. Scale bars=100 μm. (D) Kaplan-Meier survival curve analysis showing high NUF2 transcript level is associated with significantly poorer overall survival in this cohort of 40 HCC patients. HCC, hepatocellular carcinoma; ICGC, International Cancer Genome Consortium.
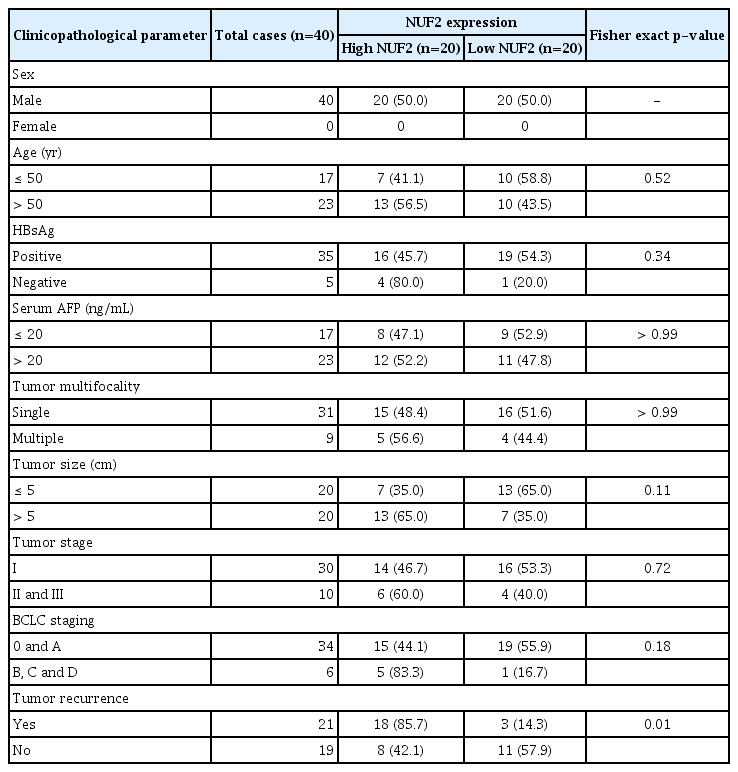
Correlation of NUF2 expression with clinicopathologic parameters of HCC patients
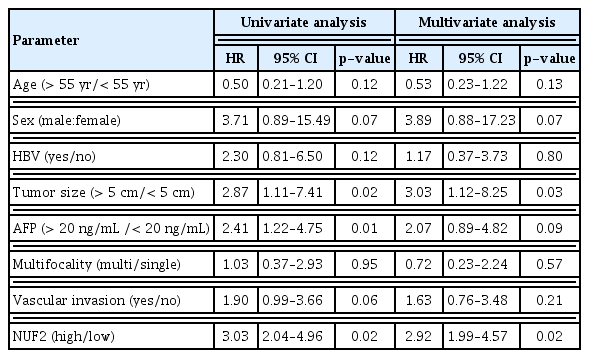
Univariate and multivariate analysis on overall survival of independent prognostic factors in HCC patients using Cox regression
4. NUF2 on HCC growth in vitro and in vivo
To understand the molecular function of NUF2 overexpression in HCC, we generated modified HCC cells with stable inhibition of NUF2 via NUF2-targeting shRNAs (shNUF2-1 & -2) in two HCC cell lines (HepG2 and Huh7) and compared NUF2 expression, cell growth, migration/invasion and in vivo tumor formation between NUF2 knockdown cells and mock knockdown cells (shControl-1 & -2). NUF2 expression was significantly inhibited in HCC cells stably expressing shRNAs targeting NUF2 (shNUF2-1 & -2) compared to non-targeting controls (shControl-1 & -2). We also examined the expression of NCAPG (non-SMC condensin I complex subunit G) which is a gene reported to be related to cell cycle but not related to NUF2, to demonstrate the specificity of the shRNAs against NUF2. NUF2-targeting shRNAs did not significantly perturb the expression of a non-targeting gene NCAPG (Fig. 6A). Compared to the non-targeting controls, NUF2 knockdown cells showed significantly reduced ability to grow, migrate into a scratch wound and invade the 8 μm porous membrane in vitro (Fig. 6B–D). Moreover, NUF2 knockdown cells also formed significantly smaller tumors than control cells in mouse xenograft assays in vivo (Fig. 6E). To gain some insights into the molecular pathways associated with NUF2, we performed IPA on the top 100 most correlated genes with NUF2 in the TCGA-LIHC datasets. As shown in Fig. 6F, NUF2 correlated genes formed a tightly interconnected network containing multiple centromere proteins and were predicted to be regulated by FOXM1. NUF2 associated genes were highly enriched in the cell cycle, DNA replication, and p53 signaling pathways (Fig. 6G).
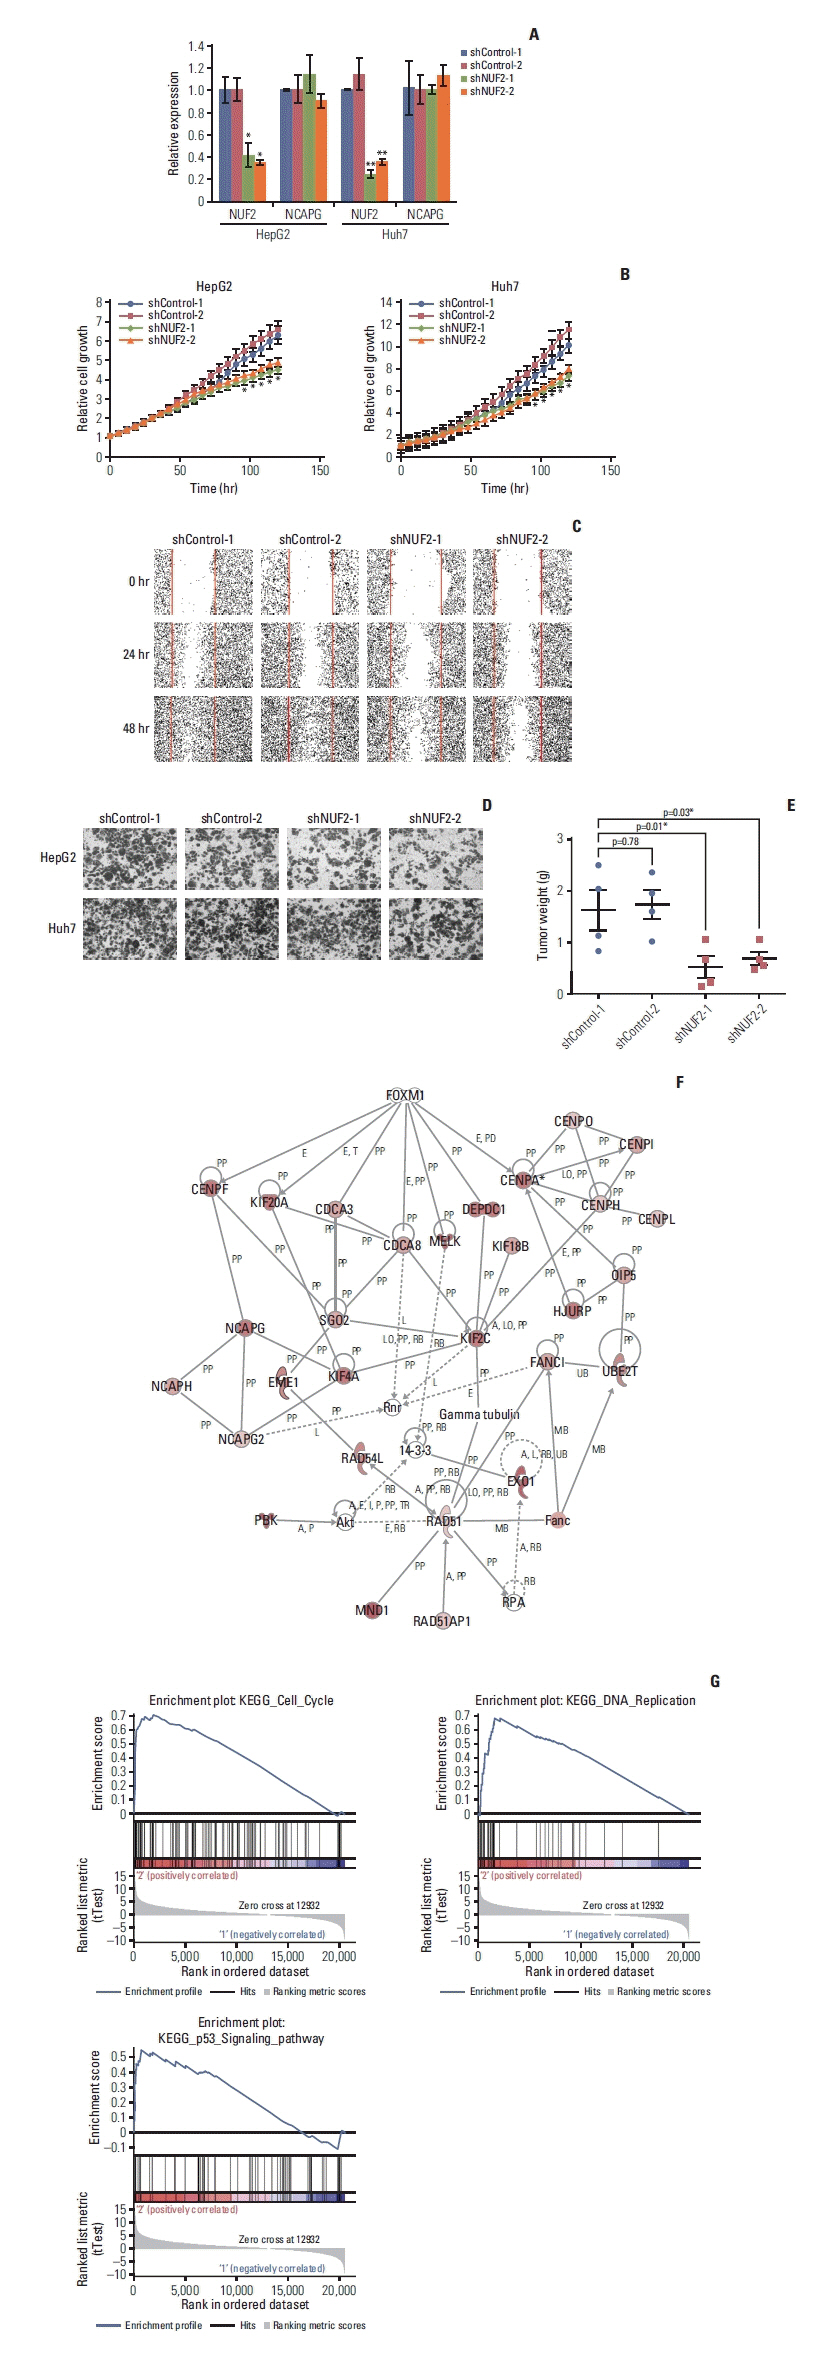
NUF2 inhibition significantly reduced HCC cell growth in vitro and in vivo. (A) Significant inhibition of NUF2 transcript level in HepG2 (left) and Huh7 (right) cells stably expressing shRNAs against NUF2 (shNUF2-1 & -2) compared with that of shRNA controls (shControl-1 & -2), measured using quantitative reverse transcription polymerase chain reaction and normalized against endogenous GAPDH. (B) Significant inhibition of in vitro cell growth in HepG2 (left) and Huh7 (right) cells stably expressing shRNAs against NUF2 (shNUF2-1 & -2) compared with that of shRNA controls (shControl-1 & -2), measured using live-cell imaging with Incucyte Zoom. (C) Significant inhibition of in vitro cell migration in Huh7 cells stably expressing shRNAs against NUF2 (shNUF2-1 & -2) compared with that of shRNA controls (shControl-1 & -2), measured using scratch wound healing assay. (D) Significant inhibition of in vitro cell invasion in HepG2 (top) and Huh7 (bottom) cells stably expressing shRNAs against NUF2 (shNUF2-1 & -2) compared with that of shRNA controls (shControl-1 & -2), measured using invasion chamber assay. (E) Significant inhibition of in vivo xenograft tumor growth in Huh7 cells stably expressing shRNAs against NUF2 (shNUF2-1 & -2) compared with that of shRNA controls (shControl-1 & -2), measured using mouse xenograft assay. Data were expressed as wet tumor weight. *p < 0.05. (F) Ingenuity pathway analysis showing the interconnected network formed by the top 100 NUF2-correlated genes in TCGA-LIHC dataset. (G) Gene set enrichment analysis showing cell cycle, DNA replication and p53 signaling pathways as the most enriched pathways associated with NUF2. GAPDH, glyceraldehyde 3-phosphate dehydrogenase; HCC, hepatocellular carcinoma; TCGA, The Cancer Genome Atlas.
Discussion
The completion of the TCGA project and the availability of analysis tools such as GEPIA2 provide a platform for the rapid examination of genetic and epigenetic aberrations across many cancer types [13–15,19]. Here we reported statistically significant NUF2 transcript overexpression in 23 out of the 31 cancer types in the TCGA datasets while NUF2 overexpression was observable but not reaching statistical significance in an additional five cancer types. A closer examination of these five datasets revealed a high proportion of early-stage tumors in the overall cohort, e.g., stage I and II samples accounts for over 70% of KICH cases, contributing to a cohort-specific bias to the observation of NUF2 expression. We successfully validated NUF2 transcript overexpression in 13 cancer types from 11 datasets of primary tumor samples and 24 cancer types represented by 48 cell lines from CCLE database [20,21]. Taken together, NUF2 overexpression is a common feature for the majority of cancers. Our data were consistent with the previously reported NUF2 transcript overexpression in cancers of the brain [7], breast [6], colon [8], liver [5,9], and pancreas [10,11]. More importantly, this is the first study to report NUF2 transcript was also up-regulated in cancers of the bladder, cervix, esophagus, head and neck, lung, ovary, stomach, and skin, as well as some rare cancers such as ACC, DLBC, THYM, and UCS (Figs. 1A and 2A), warranting further characterization of NUF2 in these cancer types.
NUF2 overexpression is clinically important as high NUF2 correlated with clinical features of many cancers. We recently reported that high NUF2 transcript level could accurately predict early tumor recurrence post-surgical resection in HCC [5]. High NUF2 transcript level was shown to be a prognostic biomarker for breast cancer in certain datasets in a systematic meta-analysis [6]. In this study, we further demonstrated that high NUF2 at the protein level was also significantly associated with tumor recurrence and negatively associated with patient OS in an independent cohort of 40 HCC patient samples (Table 1, Fig. 5C and D). Also we reported the novel findings that high NUF2 transcript expression was associated with tumor stages in cancers of the kidney (KICH, KIRC, and KIRP), liver (LIHC), lung (LUAD and LUSC), ACC, and THCA. More importantly, high NUF2 transcript expression was shown to be significantly associated with poorer patient survival (both OS and DFS) in ACC, KIRP, LGG, and SARC, in addition to LIHC (Fig. 4). It is of particular interest to further evaluate the prognostic potential of NUF2 in rare cancers such as ACC. NUF2 up-regulation correlated closely with each tumor stage in ACC (Fig. 3A). ACC patients with high NUF2 transcript expression had a median OS of approximately 40 months and a median DFS of approximately 20 months, compared to the median OS and DFS of more than 150 months in ACC patients with low NUF2 (Fig. 4A and B). Importantly, inhibition of NUF2 in HAC15 cells, an ACC cell line, significantly reduced cell proliferation (S3 Fig.), demonstrating that NUF2 overexpression is functionally important in ACC too. Unfortunately, we could not find suitable datasets to validate these associations at the moment. This very significant observation in the relatively small cohort of 75 patients in the TCGA datasets should be validated using a larger cohort to provide important prognostic biomarkers for ACC which is under-studied.
NUF2 overexpression is functionally important in many cancers. Silencing of NUF2 in vitro has been reported to inhibit tumor cell growths in cell lines of osteosarcoma and pancreatic cancers. In this study, we demonstrated that constitutive inhibition of NUF2 via shRNAs reduced the ability of HCC cells to proliferate, migrate, and invade in vitro. NUF2 inhibition also resulted in smaller tumor formation in vivo. NUF2 correlated genes include many centromere proteins such as CENP-A, CENPF, and CENPH which are enriched in the cell cycle, DNA replication, and p53 signaling pathways (Fig. 6). This is consistent with NUF2’s reported role to mediate kinetochore-microtubule attachment during cell division [22–24]. NUF2 expression correlates with the number of cell divisions in the tissues. In most adult tissues, there are few cell divisions and NUF2 expression is low. In tumors arising from these tissues, there is an increase in cell divisions and NUF2 expression is found to be significantly higher in tumors versus non-tumor samples for most of these cancers. In contrast, NUF2 expression is extremely high in normal testis tissues where cell divisions are high too while NUF2 expression was lower in TGCT where seminomas are the most predominant form of testicular cancers and very slow-growing tumors [25].
In summary, we reported significant NUF2 transcript overexpression in 23 TCGA cancer types. High NUF2 was significantly associated with poorer patient OS and DFS in selected cancer types. We further validated the prognostic potential and functional impact of NUF2 overexpression in HCC. More international efforts are needed to evaluate NUF2 overexpression in other relevant cancers such as ACC.
Electronic Supplementary Material
Supplementary materials are available at Cancer Research and Treatment website (https://www.e-crt.org).
Notes
Ethical Statement
All samples were collected following the protocols approved by the respective Institutional Review Boards, and informed consent was obtained from all subjects before sample collection.
Conflicts of Interest
Conflict of interest relevant to this article was not reported.
Author Contributions
Conceived and designed the analysis: Wang Y, Hui KM.
Collected the data: Jiang X, Jiang Y, Luo S, Koh CKT, Deivasigamain A, Dong Q, Wang Y.
Contributed data or analysis tools: Jiang X, Jiang Y, Luo S, Zhang N, Li S, Hao F, Goh BKP, Ooi LL, Wang Y.
Performed the analysis: Sekar K, Wang Y.
Wrote the paper: Wang Y.
Funding: Wang Y, Hui KM.
Acknowledgements
We thank the staff of the National Cancer Centre Singapore, Singapore General Hospital and the Zhejiang Shangyu People’s Hospital for their assistance in this study. The results shown here are in part based upon data generated by the TCGA Research Network: https://www.cancer.gov/tcga. This work was supported by grants from the National Medical Research Council of Singapore and NCC Research Foundation to KMH. Specifically, a CBRG-NIG grant (NMRC/BNIG/2037/2015) and OF-YIRG (NMRC/OFYIRG/0076/2018) from the National Medical Research Council of Singapore and SingHealth ONCO-ACP grant to YW (NCCRF-OACPCCS-YR2015-Aug-1).