External Validation of the Long Short-Term Memory Artificial Neural Network-Based SCaP Survival Calculator for Prediction of Prostate Cancer Survival
Article information
Abstract
Purpose
Decision-making for treatment of newly diagnosed prostate cancer (PCa) is complex due to the multiple initial treatment modalities available. We aimed to externally validate the SCaP (Severance Study Group of Prostate Cancer) Survival Calculator that incorporates a long short-term memory artificial neural network (ANN) model to estimate survival outcomes of PCa according to initial treatment modality.
Materials and Methods
The validation cohort consisted of clinicopathological data of 4,415 patients diagnosed with biopsy-proven PCa between April 2005 and November 2018 at three institutions. Area under the curves (AUCs) and time-to-event calibration plots were utilized to determine the predictive accuracies of the SCaP Survival Calculator in terms of progression to castration-resistant PCa (CRPC)–free survival, cancer-specific survival (CSS), and overall survival (OS).
Results
Excellent discrimination was observed for CRPC-free survival, CSS, and OS outcomes, with AUCs of 0.962, 0.944, and 0.884 for 5-year outcomes and 0.959, 0.928, and 0.854 for 10-year outcomes, respectively. The AUC values were higher for all survival endpoints compared to those of the development cohort. Calibration plots showed that predicted probabilities of 5-year survival endpoints had concordance comparable to those of the observed frequencies. However, calibration performances declined for 10-year predictions with an overall underestimation.
Conclusion
The SCaP Survival Calculator is a reliable and useful tool for determining the optimal initial treatment modality and for guiding survival predictions for patients with newly diagnosed PCa. Further modifications in the ANN model incorporating cases with more extended follow-up periods are warranted to improve the ANN model for long-term predictions.
Introduction
Selection of an initial treatment modality for patients with biopsy-proven prostate cancer (PCa) is based on prognostic indicators of the tumor that affect cancer-specific survival (CSS) and performance status and comorbidities of the patient that affect overall survival (OS) [1]. Treatment modalities recommended by contemporary guidelines include active surveillance, radical prostatectomy, radiation therapy with or without androgen deprivation therapy (ADT), and ADT alone [2,3]. Multiple treatment options may be equally effective regarding survival for some patients, in which a specific treatment modality can be selected based upon personal preferences and baseline function. On the other hand, a preference-sensitive selection of a specific treatment may compromise survival benefit owing to the existence of any unidentified adverse patient or tumor characteristics [4].
With biopsy-proven PCa, patients and health-care providers face the challenge of selecting a specific treatment modality among multiple initial options [5]. In general, individual patients are stratified according to risk stratification tools that were developed based on conventional linear models and are recommended treatments that are concordant with the preferences of the physician and patient [3,6]. However, such stratification tools provide guidance according to an estimated survival outcome based on the average risk for a patient and are unable to provide individual survival outcomes. Moreover, these tools cannot offer differential survival outcomes for each feasible treatment option of a specific patient. Given the long natural history of PCa and the nonlinear and multidimensional relationship of prognosticators involved in disease progression, it is considered impractical to estimate survival using conventional linear analyses without accounting for individual risk factors that may affect survival.
A growing body of evidence indicates that artificial neural network (ANN) models may improve the accuracy of prediction for cancer diagnosis and survival outcomes compared to conventional discriminant analyses [7–9]. For estimation of survival outcomes of patients with biopsy-proven PCa, the SCaP (Severance Study Group of Prostate Cancer) Survival Calculator was utilized and incorporated 19 patient and tumor characteristics of 7,267 Korean patients with newly diagnosed PCa. This calculator utilized several ANN models to estimate castration-resistant PCa (CRPC)–free survival, CSS, and OS outcomes of an individual patient according to each initial treatment modality [10]. The long short-term memory (LSTM) ANN model outperformed the conventional Cox-proportional hazards regression model, with area under the curves (AUCs) of 0.936, 0.893, and 0.856 for 5-year CRPC-free survival, CSS, and OS, respectively, and AUCs of 0.920, 0.860, and 0.830 for 10-year CRPC-free survival, CSS, and OS. Consequently, the LSTM ANN model was incorporated into the SCaP Survival Calculator. However, the model-development cohort consisted of patients from a single institution, precluding its validity and clinical usefulness.
In advance of utilizing the SCaP Survival Calculator in clinical practice, we aimed to externally validate its predictive accuracies for estimations of 5- and 10-year CRPC-free survival, CSS, and OS outcomes using a validation cohort that consisted of patients from three high-volume institutions.
Materials and Methods
1. Study cohort and data collection/model development population
Clinical, pathological, and radiographical data were retrospectively collected from 4,695 consecutive patients diagnosed with biopsy-confirmed PCa between April 2005 and November 2018 at three institutions: Asan Medical Center, Ajou University Hospital, and Hallym University Hospital. Patients were excluded if they had incomplete data, received subsequent treatments beyond recommended guidelines, were lost to follow-up, or if the cause of death was unknown. In total, 4,415 cases (94.0%) were included in the validation cohort.
Pretreatment data were determined and assessed according to the developmental cohort of the SCaP Survival Calculator and comprised patient age, body mass index, Charlson comorbidity index, hypertension, diabetes mellitus, tuberculosis, liver cirrhosis, cerebrovascular disease, Eastern Cooperative Oncology Group performance score, prostate-specific antigen (PSA) level, prostate volume, PSA density, positive biopsy core number, maximum biopsy core involvement, clinical stage, biopsy Gleason score, presence of second primary malignancies, and type of initial treatment modality. Pathologic outcomes were based on previous reports without re-analysis.
2. Study endpoints
Co-primary endpoints were discrimination performance and calibration of the predictive accuracies of progression to CRPC-free survival, CSS, and OS, as analyzed by the previously developed LSTM ANN model-based SCaP Survival Calculator.
3. Statistical analyses
Comparisons of baseline clinicopathological characteristics between the development and external validation cohorts were performed using the two-sided Mann-Whitney U test for analysis of continuous variables and the chi-square test for analysis of categorical variables. Statistical performance of the SCaP Survival Calculator was externally validated by discrimination and calibration for 5- and 10-year progression to CRPC-free survival, CSS, and OS outcomes. The predictive performance was evaluated by predefined cut-off values of the development cohort that were determined using Harrell’s C-index [10]. The five-fold cross-validation was implemented in the developmental LSTM ANN model, and the accuracy of the model was assessed using the average values of the five groups. Therefore, the discrimination performances of the external validation set were quantified using the average AUC and confidence interval. As a next step, graphical assessments for predicted outcome probabilities against observed outcome probabilities were performed using time-to-event calibration plots. The predicted probabilities of each quintile were compared with the observed frequencies. Agreement between the observed and predicted outcomes was confirmed if the scatter plots for the two values were within a diagonal line and inside the 5% margin of error [11].
Statistical analysis was performed using IBM SPSS Statistics software ver. 21.0 (IBM Corp., Armonk, NY) and R Statistical Package ver. 3.1.3. (Institute for Statistics and Mathematics, Vienna, Austria). All tests were two-tailed, with statistical significance set at a p < 0.05.
Results
1. Clinicopathological characteristics and survival estimates
Clinicopathological data of the external validation cohort in relation to the development cohort are presented in Table 1. Overall, the external validation cohort exhibited significantly more favorable features in regard to tumor characteristics and patient health status compared to the development cohort. The distribution of patients regarding treatment modality was comparable to that of the development cohort. A longer median follow-up period was observed in the development cohort compared to the external validation cohort (76.0 months vs. 62.0 months, p < 0.001). The 5- and 10-year CSS and OS outcomes were consistent with contemporary survival estimates (Table 2).

Clinicopathological characteristics of the development and external validation cohorts

Causes of death and 5- and 10-year survival outcomes of the external validation cohort
2. Discrimination performance
Table 3 shows the discrimination accuracies of the development and external validation models. Predictive performances of the SCaP Survival Calculator for CRPC-free survival, CSS, and OS revealed AUCs of 0.962 (95% confidence interval [CI], 0.954 to 0.962), 0.944 (95% CI, 0.931 to 0.944), and 0.884 (95% CI, 0.868 to 0.884) for a 5-year outcome and 0.959 (95% CI, 0.952 to 0.959), 0.928 (95% CI, 0.915 to 0.928), and 0.854 (95% CI, 0.838 to 0.854) for a 10-year outcome, respectively. The AUC values and C-indices of the external validation cohort were higher for all survival endpoints compared to those of the development cohort. Overall, the discrimination performances declined for the 10-year predictions compared to the 5-year predictions, which was a similar trend to that observed in the development cohort. The sensitivities, specificities, and negative predictive values were comparable between the cohorts. However, the negative predictive values tended to be inferior in the external validation cohort compared to the development cohort.
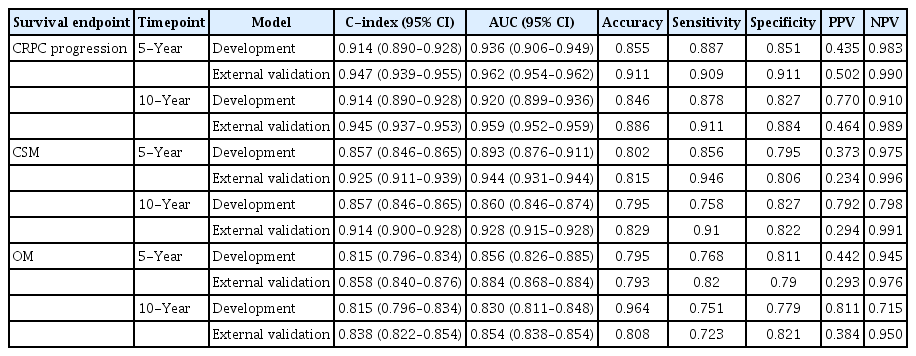
Comparison of discrimination accuracies of the SCaP Survival Calculator between the development and external validation cohorts
3. Calibration curves
Fig. 1 shows calibration plots for 5- and 10-year survival endpoints. Due to an unequal distribution in the number of samples in each quantile, an additional set of calibration plots was assessed by evenly distributing the number of samples. Calibration plots for 5-year survival showed that predicted probabilities had acceptable concordance that was comparable to those of the observed probabilities (Fig. 1A–C). However, calibration performances for 10-year survival exhibited overall overestimation, showing several values outside of the 5% margin error (Fig. 1D–F). As a result, these data coincided with lower AUCs compared to those of 5-year survival.
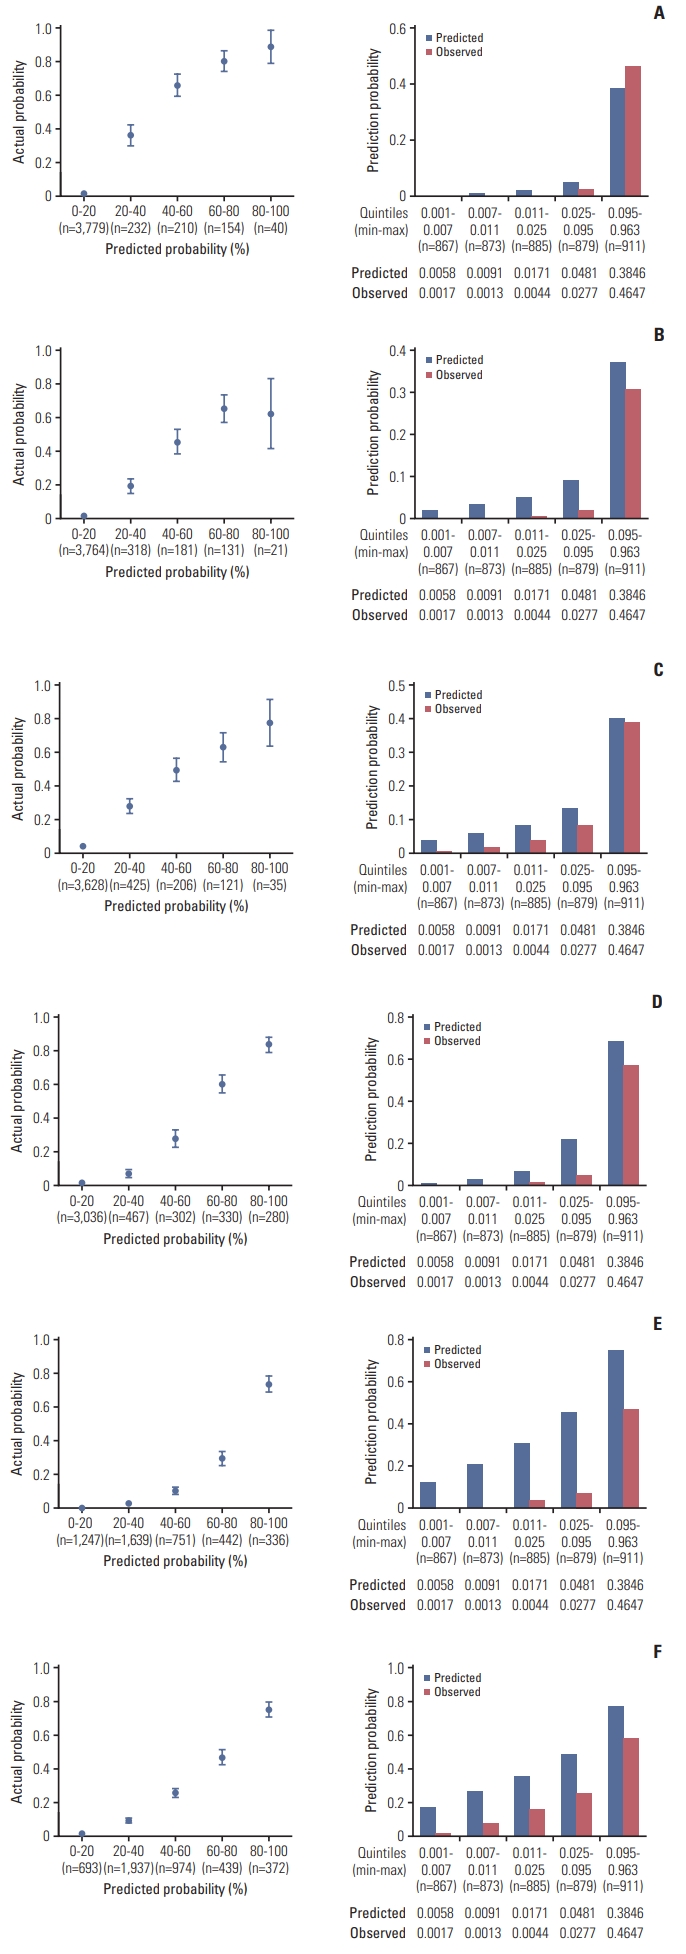
Time-to-event calibration plots for 5-year castration-resistant prostate cancer (CRPC)–free survival (A), cancer-specific survival (CSS) (B), and overall survival (OS) outcomes (C), and 10-year CRPC-free survival (D), CSS (E), and OS outcomes (F). Calibration plots were assessed by predicted probabilities according to quintiles (left column) and by evenly distributing the number of samples (right column).
Discussion
It is essential to externally validate prediction models prior to their use in clinical practice [12]. Since validation samples should be obtained from different but plausibly relevant cohorts, we assessed a comprehensive dataset of patients initially diagnosed with biopsy-proven PCa from three high-volume institutions and incorporated the data into the pre-established SCaP Survival Calculator. In this study, we showed that the SCaP Survival Calculator has good discrimination and calibration in a large independent cohort and outperforms previous risk stratification tools in prediction of CRPC-free survival, CSS, and OS outcomes. However, calibration performances declined for 10-year survival endpoints, indicating uncertainty of clinical usefulness in regard to predicting long-term survival.
The survival outcomes of PCa according to the type of initial treatment modality remain largely unknown due to the availability of various efficacious treatments for a certain stage of PCa. The selection of a specific treatment is determined according to patient life expectancy and stage of the disease. Contemporary recommendations have been formulated based on survival outcomes of an average risk patient and cannot provide a single superior treatment option [2,3,6]. Accordingly, the selection of a specific treatment modality is complex and varies depending on patient range of values, preferences, and baseline health status. In this respect, the high predictive performance of the SCaP Survival Calculator regarding OS lends support to the notion that it can be useful for determining the individual risk of survival during the decision-making process for a specific treatment modality.
Several risk stratification tools have been developed to predict PCa survival with acceptable discrimination [13,14]. However, these tools cannot estimate survival outcomes according to treatment modality and do not account for prognostic indicators that affect survival, namely, performance status or comorbidities of an individual patient. Moreover, the calculations are based on conventional linear analysis, which cannot account for the multidimensional relationship of potential risk factors associated with disease progression. Therefore, it would be arduous to determine survival outcomes using conventional analyses alone. The SCaP Survival Calculator was developed based on the LSTM ANN model, which is considered suitable for complex, nonlinear survival data since it can provide high predictive performance irrespective of reliability, accuracy of data, or measurement errors [10,15–18]. Although the SCaP Survival Calculator showed superior predictive accuracies for PCa survival outcomes to those of previous prediction tools, its performance called for external validation in an independent cohort.
Discrimination performance is usually observed to be inferior in the validation cohort compared to the development cohort [19]. Nevertheless, the AUC values of our validation cohort in this study were generally higher for all survival endpoints compared to those of the development cohort, indicating the validity and feasibility of the SCaP Survival Calculator. However, discrimination performances declined for 10-year endpoints. The likely explanation for this observation is the limited size of samples at the 10-year follow-up. Of note, the median follow-up period of the development cohort was 76.0 months. The limited number of samples incorporated in the training set of the development cohort may have deterred a meaningful ANN learning capability. This presumption is justifiable, considering that 65% of the development cohort consisted of patients who received radical prostatectomy; whereas, the sum of patients who received active surveillance, radiation therapy, or ADT alone constituted 45% of the cohort. Calibration performance also declined for 10-year endpoints. We presumed that the relatively shorter median follow-up period of 62.0 months in the validation cohort limited calibration performance.
Several strengths of our study are worth mentioning for implementation of the SCaP Survival Calculator in actual clinical practice. First, the validation cohort was comprised of patients from multiple high-volume institutions, which represents the generalizability of the data. Second, the sample size of the validation cohort consisted of 60.8% of that of the development cohort. For a meaningful external validation, acceptable coverage of the C-index at the nominal level of 95% is achieved as the number of events approaches and exceeds 200 [20]. Considering that the numbers of patients who progressed to CRPC, cancer-specific mortality, and overall mortality all exceeded 300, the validity of our validation study is conceivable. Third, the dataset was considered of high-quality, in which all prognostic indicators of the development cohort were manually reviewed and incorporated without any missing data. Conclusively, we suggest that the SCaP Survival Calculator outperforms previous risk stratification tools predicting survival outcomes, such as those published by D’Amico et al. [13] and Cooperberg et al. [14].
This study is not without limitations. First, the development and validation cohorts consisted of Asian patients. Since the biological features of PCa in this population may not be representative of those in Western men, caution is required when using the calculator in other ethnicities. Likewise, there is potential that the calculator may not deliver optimal accuracy of survival prediction if used in clinical settings where there is a vast difference in clinicopathological features between the clinical and development cohorts. Therefore, we suggest that the calculator should be updated and recalibrated when considered for use in non-Asian patients. A notable finding in our study was that differences existed in the distributions of Gleason score, biopsy features, clinical T and M categories, presence of a second primary malignancy, and patient health status between the development and validation cohorts. Notwithstanding these differences, discrimination performances obtained in our external validation were generally higher for all survival endpoints compared to those of the development cohort, indicating the feasibility and generalizability of the SCaP Survival Calculator and its clinical applicability to be implemented in clinical practice. Second, there was lack of central evaluation, and the variables of our cohort were based on previous pathologic, radiographic, and laboratory reports without re-analyses. However, from a clinical viewpoint, the potential existence of interobserver variability, which is common in clinical practice, would add value to our study findings. Third, the multi-institutional nature of the study precludes the uniformity of data. However, to assess the accuracy and generalizability of a prognostic model, the heterogeneity of data, rather than homogeneity, would be desirable.
The SCaP Survival Calculator outperforms the performances of previous risk stratification tools in the prediction of 5-year progression to CRPC-free survival, CSS, and OS outcomes. We suggest that the LSTM ANN model used in the calculator is reliable for determining the optimal initial treatment modality and for guiding survival predictions. Further modifications in the ANN model incorporating cases with longer follow-up periods are warranted to improve the ANN model for long-term predictions.
Notes
Ethical Statement
This study was approved by the Institutional Ethics Committees after review of the protocol and procedures employed, which waived the requirement for informed consent of patients (3-2017-0330). All study procedures complied with the principles of the 1946 Declaration of Helsinki and its 2008 update.
Author Contributions
Conceived and designed the analysis: Koo KC.
Collected the data: Cho JS, Kim SI, Chung BH, Kim CS.
Contributed data or analysis tools: Lee YH, Lee KS.
Performed the analysis: Kim S, Min C, Park JY, Lee HS.
Wrote the paper: Lim B, Koo KC.
Conflicts of Interest
Conflicts of interest relevant to this article was not reported.
Acknowledgements
This study was supported by the Research Grant of the National Research Foundation of Korea (2020R1F1A1073833) and the Research Grant of Gangnam Severance Hospital Prostate Cancer Center Research Committee (7523110).