Genetic Alterations in Preinvasive Lung Synchronous Lesions
Article information
Abstract
Purpose
Despite advances in treatment, lung cancer remains the leading cause of cancer mortality. This study aimed to characterise genome-wide tumorigenesis events and to understand the hypothesis of the multistep carcinogenesis of lung adenocarcinoma (LUAD).
Materials and Methods
We conducted multiregion whole-exome sequencing of LUAD with synchronous atypical adenomatous hyperplasia (AAH), adenocarcinoma in situ, or minimally invasive adenocarcinoma of 19 samples from three patients to characterize genome-wide tumorigenesis events and validate the hypothesis of the multistep carcinogenesis of LUAD. We identified potential pathogenic mutations preserved in preinvasive lesions and supplemented the finding by allelic variant level from RNA sequencing.
Results
Overall, independent mutational profiles were observed per patient and between patients. Some shared mutations including epidermal growth factor receptor (EGFR, p.L858R) were present across synchronous lesions.
Conclusion
Here, we show that there are driver gene mutations in AAH, and they may exacerbate as a sequence in a histological continuum, supporting the Darwinian evolution model of cancer genome. The intertumoral and intratumoral heterogeneity of synchronous LUAD implies that multi-biomarker strategies might be necessary for appropriate treatment.
Introduction
Although molecular targeted therapies and immune checkpoint inhibitors have markedly improved treatment outcomes in lung cancer, it remains the leading cause of cancer deaths [1]. Lung adenocarcinoma (LUAD) is the most common subtype of lung cancer, accounting for approximately 28%-50% of all cases [2,3], and its incidence is continuously increasing. LUAD is often diagnosed at an advanced stage, leading to a poor prognosis. Multiregional sequencing in lung cancer showed high degree of intratumoral heterogeneity [4], highlighting that understanding the processes of LUAD genome evolution by accumulating somatic mutations over time is important for the early diagnosis and prevention of LUAD.
LUAD with ground-glass/lepidic feature is hypothesised to follow a multistep tumorigenesis starting from atypical adenomatous hyperplasia (AAH), to adenocarcinoma in situ (AIS), to minimally invasive adenocarcinoma (MIA), and finally to invasive or lepidic-predominant adenocarcinoma (ADC) as a histologic stepwise continuum [5,6]. AAH is the only reported precursor lesion to LUAD and is occasionally discovered in the surgically resected lung tissue harboring lung cancer [6]. However, studies on AAH are limited due to its rarity and small lesion size.
The first targeted sequencing study on AAH and paired ADC lesions reported increasing mutational abundance of synchronous epidermal growth factor receptor (EGFR), KRAS, and TP53 mutations in the tumor [7]. Another targeted sequencing study combined with transcriptome analysis suggested that exclusive pathways in the driver gene BRAF or KRAS mutate and initiate the progression of precursor lesions to malignancy [8]. Recently, we reported targeted deep sequencing in sequential lesions [9]. The increased proportions of overall mutated lesions in advanced lesions and shared mutations of EGFR between synchronous lesions implied a linear stepwise progression of LUAD [10]. However, the interlesional and intralesional heterogeneity reported in previous AAH studies and the analysis being limited to the focused gene list make it difficult to understand the overall genetic alteration events.
This study aimed to characterize genome-wide tumorigenesis events and to elucidate the hypothesis of the multistep carcinogenesis of LUAD. Towards this goal, we conducted multiregion whole-exome sequencing (WES) of LUAD and preinvasive lesions and paired normal tissue samples.
Materials and Methods
1. Sample selection
We used patients’ specimens collected in the previous targeted sequencing study [9]. Histologic slides from patients who underwent wedge resection or lobectomy were stained with haematoxylin and eosin for routine pathologic diagnosis. From each formalin-fixed, paraffin-embedded (FFPE) tissue, 10 µm-thick sections were cut for DNA extraction after minimum trimming, and pathologists reviewed cases and microdissected the area containing > 60% neoplastic cells. Three patients (P1, P5, and P8) with complete AAH-AISMIA-ADC sequences of synchronous lesions were chosen. For WES, the remaining extracted DNA from the FFPE tissues were prepared. The characteristics of the entire paired samples for WES, targeted sequencing, and RNA sequencing are summarized in S1 Table.
Information regarding patient characteristics and sample collections was detailed in the previously reported paired targeted sequencing study [9].
2. DNA and total RNA preparation
For RNA sequencing (RNA-seq), total RNAs were extracted from additional FFPE tissue sections from the same patients, and cDNA were synthesized according to the manufacturer’s protocol. Non-tumorous samples were used as controls for RNA-seq. Genomic DNA was extracted using the Maxwell (R) 16 FFPE Plus LEV DNA Purification Kit (Promega, Mannheim, Germany) and quantified with PicoGreen dsDNA quantitation assay (Molecular Probes, Eugene, OR). All samples passed the in-house quality control criteria of next-generation sequencing library. The library preparation was performed through Agilent SureSect V5 (Agilent Technologies, Santa Clara, CA) and TruSeqProtocol with TruSeq Exome Enrichment (Illumina, San Diego, CA). DNA sequencing and RNA-seq was performed using an Illumina HiSeq 2500 with 100 bp×2 paired-end reads.
3. Somatic DNA variant calling
WES variants were called with three different caller strategies: Genomon2 pipeline, Mutect (ver. 1.1.4), and MuTect2 (S2 Fig.). Genomon2 pipeline with default parameters identified any potential somatic mutation if Fisher exact test resulted in a p-value < 0.05. For Mutect and MuTect2, raw reads were aligned using BWA (ver. 0.7.12) and then preprocessed using GATK (ver. 32.6) per the best practices recommended by the Broad Institute. To maximize sensitivity, MuTect2 was run with a low cut-off (--max_alt_alleles_in_normal_count 10000000 --max_alt_allele_in_normal_fraction 0.10). Single-nucleotide variants (SNVs) were filtered with a minimum read depth of 20 in the lesions and the matched control, and variant allele frequency (VAF) of being greater than 4% in any lesions and less than 1% in the matched control was set as cut-off values. The 4% cut-off was decided based on the paired comparison between the WES samples and the targeted sequencing samples (S2 Fig.). Variants were annotated via ANNOVAR (ver. 2016-02-01) or Cancer Genome Interpreter [11], and only exonic variants were further filtered. Read depth was obtained via bam-readcount (ver. 0.8.0). Insertions and deletions (indels) were identified with the same read-depth and VAF filter criteria and manually reviewed using the Integrative Genomics Viewer.
4. Copy number analysis
Copy number analysis was performed using Sequenza (ver. 2.1.2) and Excavator2. Segmental somatic copy number alterations (CNAs) were defined according to the intersection between Sequenza (filtered by Bayes factor > 0.3) and Excavator2 (filtered by call probability > 0.9).
5. Inferred clonal tree construction
An individual inferred clonal tree was constructed based on the VAF matrix with SNV as rows and samples as columns. Clonal sequences rather than multiregion trees were used to avoid biased inference of the underlying subcolonal structures [12]. For each patient, two VAF and read-depth matrices (size of [no. of SNVs]×number of lesions) were decomposed into a genotype matrix (size of [no. of SNVs]× no. of clones) and a clone frequency matrix (size of [no. of clone]×no. of lesions) using an Expectation-Maximization algorithm. The algorithm required a fixed clone number, which we set as four. As a result, the genotype matrix determined the clonal membership of each variant, and each clone was linked to lesions according to the estimated clone frequencies. An unrooted phylogenetic tree was drawn from the inferred clones based on the minimum evolution algorithm. The Clomial and ape R packages were used. LUAD driver genes taken from Bailey et al. [13] were depicted in the trees.
6. Pathway analysis/functional annotation
The mutated genes were investigated further via pathway enrichment analysis using REACTOME (ver. 66, https://reactome.org). The pathogenic status of mutations of driver genes were reviewed via the NCBI ClinVar (https://www.ncbi.nlm.nih.gov/clinvar/, accessed on November 18, 2018).
7. Mutational signature analysis
Somatic mutational signatures were generated and compared to the 30 known mutational signatures in the Catalogue of Somatic Mutations in Cancer database (http://cancer.sanger.ac.uk/cosmic/signatures) using deconstructSigs R package. It quantified the linear combination of well-annotated Catalogue of Somatic Mutations in Cancer (COSMIC) signatures from a single sample input. SNVs were annotated with one of 96 trinucleotide-context substitutions, and the prevalent mutation signatures were illustrated as lego plots.
8. Somatic allelic imbalance
Mutational abundance between the genome and the transcriptome was generally consistent, showing that the mutated allele was expressed according to its mutational frequency in the genome. By contrast, somatic allelic imbalance is a deviation of a consistent expression of somatic alleles, and several studies reported that preferentially allelic selections may be associated with the functionality of cancer genomes [14]. We first included genes with a minimum RNA read depth of 20 and fitted a regression model between RNA VAF versus WES VAF. We then defined somatic allelic imbalance using a data-driven binomial model. For each SNV found in WES, unlikely observation of the read number of RNA was calculated given the WES VAF as the expected probability of binomial distribution. Either SOM-L or SOM-E was defined if the adjusted p-value of Hochberg method is < 0.05. The protein-protein interaction graph was drawn using Cytoscape (ver. 3.7.0) with a STRING database (ver. 10.5) plugin.
9. Ethical statement
This study was approved by the Institutional Review Board of Seoul National University Bundang Hospital and all the patients provided written informed consent (IRB No. B-1607/355-301), and all methods were performed in accordance with the relevant guidelines and regulations.
Results
1. Mutational landscape of synchronous LUAD
Initially, 26 samples from three patients were prepared for WES. Of these, four AAH samples that did not pass the quality control and three non-tumorous normal samples were excluded in the analysis. In total, 19 samples (5 AAH, 3 AIS, 4 MIA, 4 ADC, and 3 matched lymph node controls) were included. WES was conducted with an on-target average depth of 217× (range, 185 to 268) per sample. We found an average of 205 exonic mutations (range, 45 to 682) per sample, and 63% (range, 51% to 70%) of these were nonsynonymous somatic mutations (S2 and S3 Figs.). On average, we identified 251 mutations in smokers (P1 and P8) and 66 mutations in a nonsmoker (P5), consistent with previous studies showing that smoking contributed to higher mutational burden [15]. There was no increasing pattern in tumor mutational burden across sequential lesions (75, 341, 196, and 275 variants in AAH, AIS, MIA, and ADC, respectively), but the VAF tended to increase from preinvasive to invasive lesions (6.1%, 9.7%, 9.2%, and 15.2%) (S4 Fig.). A total of 2,198 genes were affected in all patients, and 172 genes were mutated in more than one patient. Mutations were largely private (82%), that is, mutations were observed in a single sample. Among the driver genes in LUAD, EGFR had mutated across two patients (P1 and P5). Moreover, other frequently mutated genes in LUAD had recurrently mutated within one patient (TP53 for P1 and KRAS and BRAF for P8) (Table 1). Our data also showed that mutations in KRAS and EGFR genes are mutually exclusive [16], while TP53 and EGFR genes are commutated [17]. However, we observed concomitant KRAS and BRAF mutations, which were in contrast to previous studies [8,18]. On average, 62%, 61%, and 65% of the mutations were annotated as passenger mutations in P1, P5, and P8, respectively. Similarly, the proportion of passenger mutations or not protein-affecting mutations were 92%, 89%, and 94%, respectively, which implies that most of mutations in smokers were non-driver mutations.

Variant allele frequencies of driver gene mutations
2. Interlesional heterogeneity
To characterize interlesional heterogeneity, multiregional VAF distributions were mapped (Fig. 1). We found some shared mutations that existed in multiple samples, including EGFR mutation (encoding p.L858R) in P5 with increasing mutational abundance throughout the sequential histological continuum. MUC4 in P1 (p.P1952S) and P8 (p.N2437D), and HLA-DQB2 in P8 (p.G250S and p.R247H) also showed increase VAF in advanced lesions (Table 1). However, the multiregional heatmaps in the overall population indicated few overlapping mutations (S5 Fig.). Indels of DNAH7, NDUFA10, and WDR88 recurrently occurred in more than one patient, and 129 detected indels were mutated within one patient.

Multiregional variant allele frequency. Blue and red colours denote the heatmap of variant allele frequency (VAF) of the genome and the transcriptome, respectively. The upper panel shows the private mutations, while the lower panel shows gene mutations found in at least two patients. (A) Atypical adenomatous hyperplasia (AAH). (B) Adenocarcinoma in situ (AIS). (D) Adenocarcinoma (ADC). ADC-N, non-invasive portion of ADC.
3. Intrapatient heterogeneity
To explore intrapatient heterogeneity, a clone relationship was inferred by estimating the hidden clonal status using observed VAFs (Fig. 2). Associated driver genes were portrayed on the inferred clonal trees. In P1, one clone containing TP53 mutation (c.240_240delinsT-) was detected in AIS, and an EGFR mutation (p.G719D) was detected in ADC. Another clone in P1 lacked TP53 (p.Q60X) in ADC. In P5, EGFR mutation (p.L858R) appeared pre-dominant at the root, and other clones were divergent from each other. Only one clone included NF1 mutation (p.N1388K) in AAH. In P8, however, multiple clones simultaneously had pathogenic or likely pathogenic mutations. One clone had KRAS mutation (p.G12V) coupled with BRAF mutation (p.G464R) in MIA, and another clone had KRAS (p.G13C) and BRAF (p.G466V) in ADC.
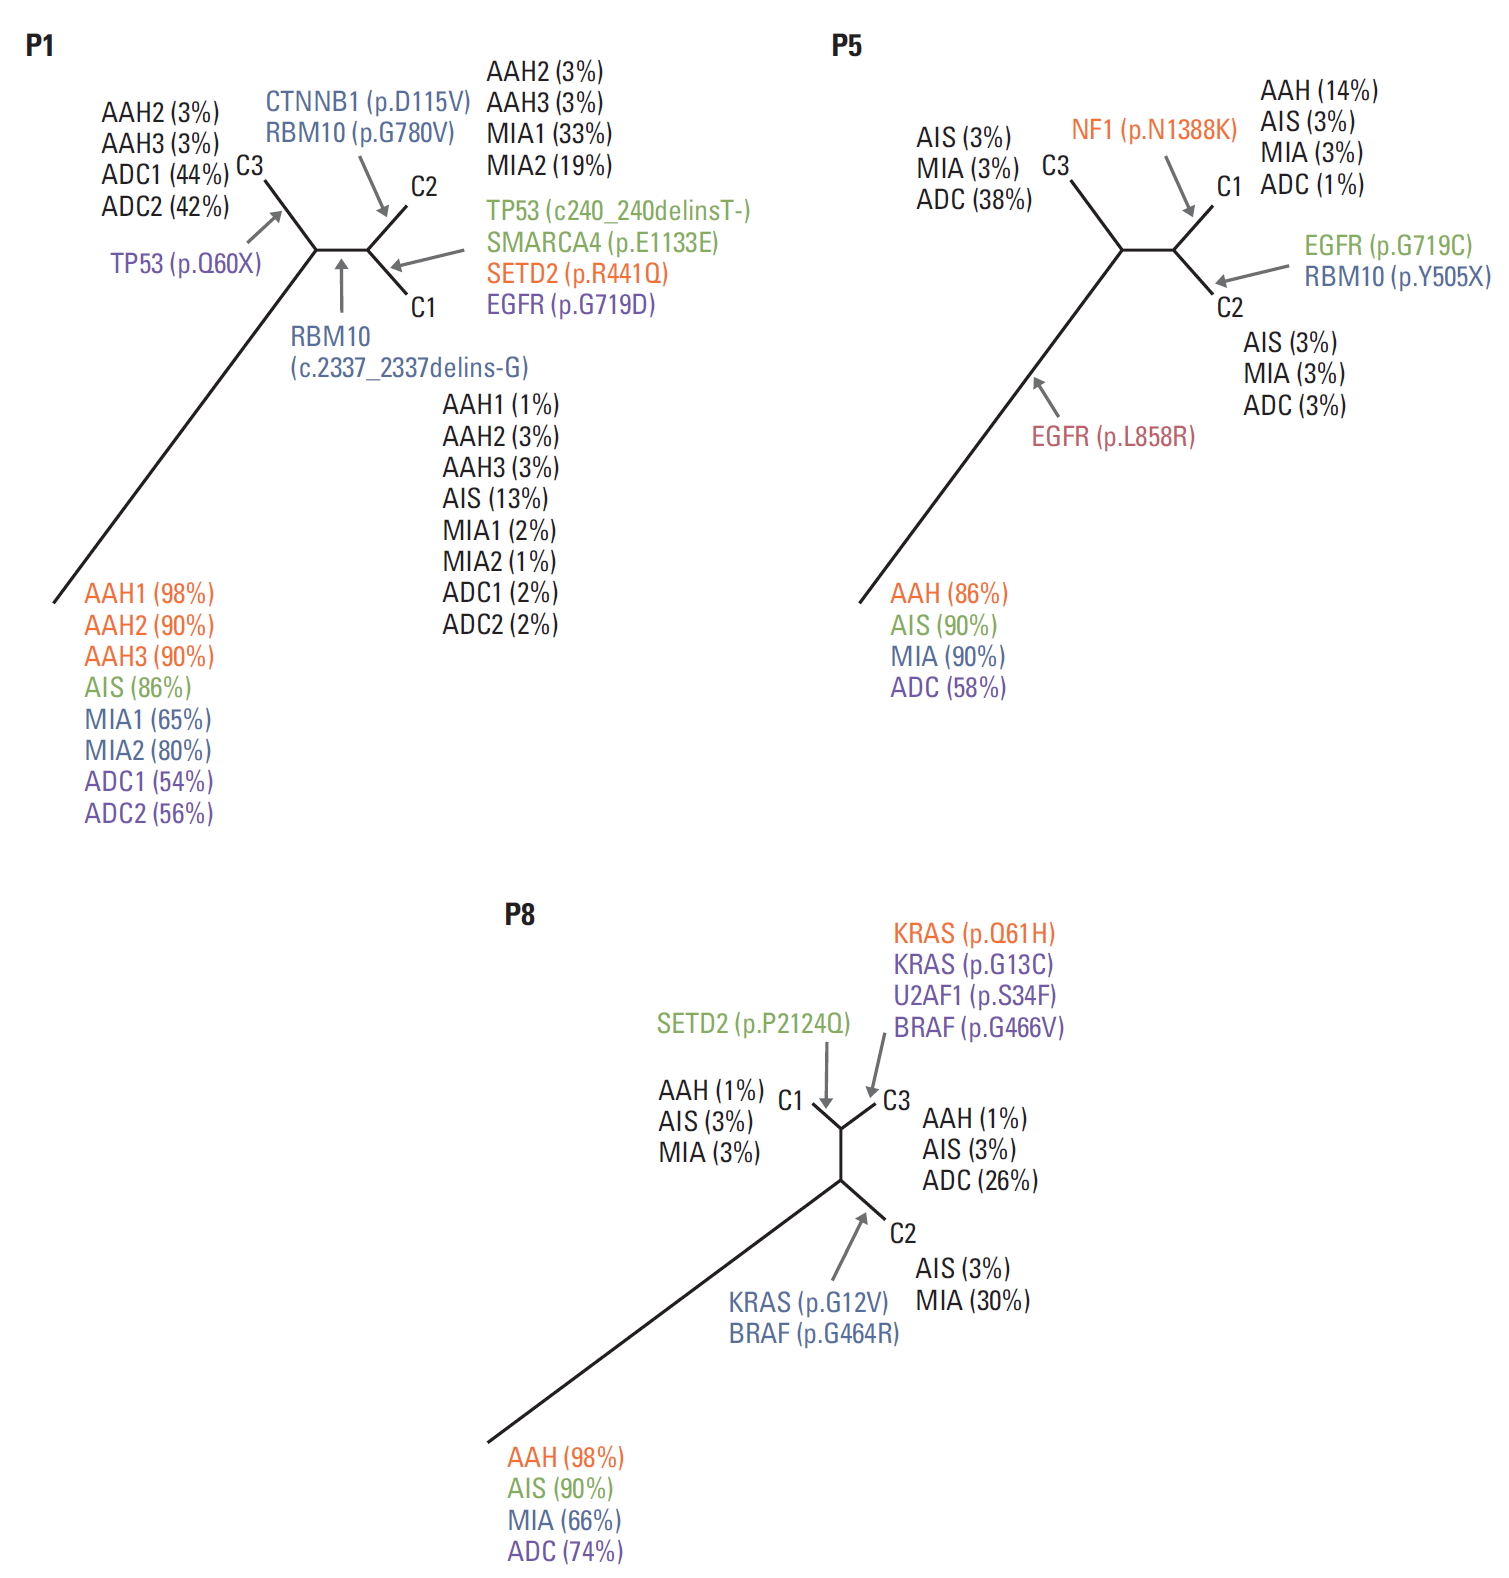
Inferred clone status. For each patient, two variant allele frequency (VAF) and read-depth matrices [(no. of mutations)×(no. lesions)] were decomposed into a genotype matrix [(no. of mutations)×(no. of clones)] and a clone frequency matrix [(no. of clone)×(no. lesions)]. C1-C3 represents inferred clones. Clone frequencies (i.e., the proportion of a clone in each lesion) are shown in parenthesis. Colours matched to the legions where the mutation occurred (orange, atypical adenomatous hyperplasia [AAH]; green, adenocarcinoma in situ [AIS]; blue, minimally invasive adenocarcinoma [MIA]; purple, adenocarcinoma [ADC]; red, all lesions). For example, C3 clone in P1 occupied 3% of AAH2 and AAH3, 44% of ADC1, and 42% of ADC2.
CNAs were recurrently observed in 1p13.3, 3q13.33, 4q13.2, 5q35.1, 5q35.3, 8q23.1, 10q21.3, 11p15.5, 14q11.2, 14q13.2, 16p13.3, 19q13.42, 20p13, and 22q11.23 (S6 Fig.).
4. Mutation signature analysis
We observed that C:G>A:T transitions were more dominant types in smokers (41% in P1, 51% in P8) than in nonsmokers (30% in P5). Meanwhile, C:G>T:A transitions were more frequent in nonsmokers (38% in P5, 32% in P1, and 27% in P8) [15]. We then further performed the mutation base-substitution signatures (Fig. 3, S7 Fig.) [19]. Overall, signatures associated with smoking (signature 4 [smoking] and 29 [tobacco] chewing]) and aging (signature 1) were highly enriched. Signature 1, composed of C:G>T:A single-base substitutions at CpG sites, was frequently observed in all cancer types. Signatures 4 and 29 were characterized mainly by C:G>A:T mutations with transcriptional strand bias. P1 was a 20 pack-year male current smoker who showed smoking-related signatures, whereas P5 was a never-smoker female and showed abnormalities in DNA maintenance across all lesions (signatures 6 and 15 [DNA mismatch repair (MMR)] and 3 and 20 [defective DNA repair]). P8, a previous smoker male patient with a 30 pack-year history, showed a combination of smoking-related and DNA MMR-related signatures. Exposure to ultraviolet light, which is a mutagenic agent, was common in the AAHs of P1 and P5. The TRACERx study reported a significant relationship between pack-years and smoking-related signature in late clonal mutations, consistent with the enrichment of signature 4 or 29 in our data [20]. Interestingly, differential signature patterns were observed in P1, where signature 4 was dominant in AAH1 and signature 1 was common in AAH2 and AAH3. This suggested that clonal compositions even in preneoplasia lesions could be different, which was also implied in the clonal status analysis (Fig. 2).

Mutation signature analysis. Somatic mutational signatures were generated and compared to the 30 known mutational signatures in the Catalogue of Somatic Mutations in Cancer (COSMIC) database. AAH, atypical adenomatous hyperplasia; AIS, adenocarcinoma in situ; MIA, minimally invasive adenocarcinoma; ADC, adenocarcinoma.
5. RNA-seq for allele-specific expression
A total of 14 RNA samples were used in this study. We determined allele-specific expression to compare RNA VAF and WES VAF. A linear regression model showed that RNA VAF was concordant with WES VAF (RNA VAF-1.1×WES VAF; Pearson correlation coefficient, 0.46) (S8 Fig.). Although we did not find similar findings that missense or silent variants in the genome implicated overexpression of certain alleles (S9 Fig.), somatic variant lost in the transcriptome (SOM-L) and somatic variant overexpressed in the transcriptome (SOM-E) variants were discovered in P1, and protein interaction graphs within each lesion type in P1 were derived (S10 Fig.). In AIS, oncogene Yes-associated protein 1 and enzyme ubiquitin-specific peptidase 9, X-linked were found, indicating that preinvasive lesion is related to loss of function in suppressed tumor growth related to the Hippo signaling pathway [21]. In MIA, genes related to mitochondrial outer member, including voltage-dependent anion channel 1 and inner mitochondrial membrane 22, were overexpressed. In ADC, loss alleles of integrin alpha 1 (ITGA1) and Versican core protein precursor (VCAN) interacted with overexpressed allele of EGFR [22]. ITGA1 and EGFR are well-documented prognostic markers, whereas VCAN enhances tumor recurrence [23].
In genes in which mutant allelic expression levels were maintained at least 4%, REACTOME analysis revealed that the biological processes of P1, P5, and P8 were regulation of TP53 expression (TP53), fibroblast growth factor receptor 2 (FGFR2) mutant receptor activation, PI3K cascade (FGFR2), and RAS signaling downstream of NF1 loss-of-function variants and RAF activation (KRAS and BRAF), respectively (S11 Table).
Discussion
In this study, we identified the genomic alterations in the precursor lesions of LUAD and inferred clonal evolution in LUAD development through WES supplemented with transcriptome analysis. Shared EGFR pathogenic mutation was observed across synchronous lesions, indicating that identical mutations occurred in the early tumorigenesis. Overall increase in VAF but not in tumor burden (mutation number) in invasive lesions indicated that accumulated mutation of certain driver genes is functionally important in cancer development [24]. Furthermore, heterogeneous mutation profiles strongly implied that each lesion underwent largely independent genetic alteration events. Although mutation signature analyses beyond single-gene mutations helped in understanding the combinatory base change mechanism associated with smoking and aging, the individual pathway was evitable.
The receptor tyrosine kinase/RAS/RAF pathway was frequently mutated and crucial in the development of LUAD [6]. Our results are consistent with those of previous studies on AAH showing the exclusive nature of EGFR mutation and KRAS mutations, and they were frequently observed in nonsmokers and smokers, respectively. EGFR is a receptor tyrosine kinase belonging to the ERBB family, and its mutations are more widespread in the Asian population and more common in women and nonsmokers. P5, a nonsmoker female Asian patient, harbored the most common pathogenic mutations in EGFR (p.L858R) across all lesions, which exemplified the role of EGFR-L858R mutation in tumor invasiveness during the early stage of lung cancer. Meanwhile, KRAS oncogenes encoding guanosine-5’-triphosphate-binding proteins contribute to invasive lesions when supplementary genomic alternations occur. P8, a male current smoker patient with a 30 pack-year history, had KRAS mutation in preinvasive and invasive lesions and UTAF1 and BRAF mutations in invasive lesions. We can further postulate the interaction between KRAS and human leukocyte antigen (HLA) genes in this patient because HLA-DQB2 mutations were prevalent. The specific role of HLA-DQB2 in cancer genomics was not reported, but immunological function may be affected by mutant neoantigen peptides of hotspot mutations [25].
P1, a 20 pack-year previous smoking male patient, showed combination pathways related to chromatin remodeling (SETD2 and RBM10) and clinical prognosis (co-mutation of TP53 and EGFR) [26]. We found that recurrent mutations of tubulin tyrosine ligase-like protein 5 (TTLL5) appeared in preinvasive lesions among known co-mutated genes with SET domain containing 2 (SETD2), a histone methyltransferase (S12 Table). SETD2 has been reported to be co-mutated with polybromo 1 (PBRM1), particularly in renal cell cancer [27] and in lung cancer [28]. Although WES did not show PBRM1 mutation in this patient, a previous study using paired targeted sequencing indicated that the patient harbored PBRM1 mutation (p.K135X) in ADC1 with low frequency (S12 Table, S13 Fig.). We also noted enriched mutations in chromaticmodifying genes (SMARCA4 [p.E1133E]) and RNA-splicing genes (RBM10 [c.2337_2337delins-G, and p.G780V]). These findings indicate that accumulated SETD2 tumor suppressor mutations along with TTLL5 enzyme mutations in preinvasive lesions exacerbated methylation and chromatic remodeling dysfunction through SMARCA4, RBM10, and PBRM1 mutations [29] (S14 Table). The copy number analysis indicated that P1 had aberrant copy number status in invasive lesions (S15 Fig., S16 Table). In a large cohort of 100 early stage lung cancer patients, DNA instability was found to possibly play a key role in cancer malignancy as it can have invasive capacity induced by environmental diversity and can thus be a predictor of clinical outcome [20].
The cancer evolution models are primarily divided into the neutral evolution (‘a big bang model’) [30] and the Darwinian evolution, depending on the differential clonal selection modes and rates [31]. Darwinian evolution selecting the fittest subclone was further divided into branched, linear, convergent, and parallel evolution. In our study, a linear evolutionary pattern can explain the EGFR-driven selective sweeps. Our data showed that genes related to epithelial cell proliferation and differentiation (MUC4) may be a part of the selective subclonal mechanism. We also conjectured that not only drive specific genomic changes, but also environmental factors contribute to clonal compositions.
The study has limitations. First, because our samples were cross-sectionally obtained at a single time point, the lesions may not be in chronological orders. Second, the patient number was small. Third, our adjusted cut-off value of VAF was extremely lower compared to that in conventional next-generation sequencing studies, although variants with low VAF values are frequently observed in clinical cancer samples [32]. Meanwhile, the major strengths of this study include the series of multiple continuum lesions within a patient and the reproducibility of results through multiple sequencing platforms (WES, targeted, and RNA-seq). We also observed that the mutation signature patterns were consistent to those reported in large-scale studies of early lung cancer patients. Collectively, the variants repeatedly confirmed in our studies may have potential utility for studying neoplastic progression (S17 Table, S18 Fig.).
In summary, we performed a comprehensive analysis of somatic alterations across synchronous lesion mutations and identified the multiple evolutionary trajectories of LUAD rooted in preinvasive lesions toward advanced lesions. We observed few shared somatic mutations and cellular heterogeneity in lung cancer, which implied the independent tumorigenic event within certain genes. The intertumoral and intratumoral heterogeneity of synchronous LUAD implies that multi-biomarker strategies might be necessary for appropriate treatment decisions. The distinct genetic origin implicates that individualized screening strategies are needed. Our finding implied that genomic variant in EGFR, TP53, KRAS, and BRAF could occur early in the process of tumor evolution, and different pathways may involve between a smoker and a non-smoker. The multi-modality tests such as imaging with diagnostic test like cell free DNA testing may lead to identifying certain clonal expansions.
Electronic Supplementary Material
Supplementary materials are available at Cancer Research and Treatment website (https://www.e-crt.org).
Flow diagram of mutation selection process. WES, whole exome sequencing; AAH, atypical adenomatous hyperplasia; ADC, adenocarcinoma; AIS, adenocarcinoma in situ; MIA, minimally invasive adenocarcinoma; LN, (non-tumorous) lymph node; VAF, variant allele frequency.
Distribution of mutation according to the exonic function frequency (A) and proportion (B). AAH, atypical adenomatous hyperplasia; ADC, adenocarcinoma; AIS, adenocarcinoma in situ; MIA, minimally invasive adenocarcinoma; VAF, variant allele frequency.
Distribution of tumour variant allele frequency (VAF). AAH, atypical adenomatous hyperplasia; ADC, adenocarcinoma; AIS, adenocarcinoma in situ; MIA, minimally invasive adenocarcinoma; VAF, variant allele frequency.
(A) Intralesional recurrent genes that occurred within the same type of lesion in more than one patient. (B) Intrapatient recurrent mutations that occurred in more than three lesions in P1 and in one lesion in P5 and P8. (C) Interpatient recurrent genes that occurred in more than one patient. (D) Insertion and deletion (indel). AAH, atypical adenomatous hyperplasia; ADC, adenocarcinoma; AIS, adenocarcinoma in situ; MIA, minimally invasive adenocarcinoma; VAF, variant allele frequency.
Copy number alteration. Heatmap (A) and distribution across samples (B). AAH, atypical adenomatous hyperplasia; ADC, adenocarcinoma; AIS, adenocarcinoma in situ; MIA, minimally invasive adenocarcinoma.
Lego plots showing the average frequency of base substitutions within specific trinucleotide mutational contexts. AAH, atypical adenomatous hyperplasia; ADC, adenocarcinoma; AIS, adenocarcinoma in situ; MIA, minimally invasive adenocarcinoma.
Linear association between whole exome sequencing (WES) variant allele frequency (VAF) and RNA VAF.
Relationship between whole exome sequencing (WES) variant allele frequency (VAF) and RNA VAF across lesion types (A) and variant annotations (B).
Protein interaction graphs in AIS (A), MIA (B), and ADC (C) in P1. ADC, adenocarcinoma; AIS, adenocarcinoma in situ; MIA, minimally invasive adenocarcinoma; SOM-E, somatic variant overexpressed in the transcriptome; SOM-L, somatic variant lost in the transcriptome. a)CTNNB1 (P1 MIA1, P1 MIA2), ABCB6 (P1 ADC1, P1 ADC2), b)EGFR (P1 ADC1, and P5 ADC).
PBRM1 mutations in ADC (whole exome sequencing [WES]) with extremely low variant allele frequency (1%) in P1. ADC, adenocarcinoma.
B allele frequency (upper panel) and copy number depth ratio (lower panel) across P1 (A), P5 (B), and P8 (C).
Comparison of whole exome and targeted sequencing results. The boxes represent variant allele frequency (VAF), the line and whiskers represent the median and 1.5 times interquartile range, respectively. WES, whole exome sequencing. We used 75 variants identified in the targeted sequencing results (case) and 75 randomly chosen loci (control) as the gold standard. The cutoff of tumour VAF > 2% and normal VAF < 0.5% or tumour VAF > 4% and normal VAF < 1% resulted in 9,482 mutations with a sensitivity of 65% and positive predictive value of 100%. The cutoff tumour VAF > 4% and normal VAF < 1% resulted in 3,279 mutations with a sensitivity of 57% and positive predictive value of 100%.
Notes
Conflicts of interest relevant to this article was not reported.
Acknowledgements
This research was supported by the Basic Science Research Program through the National Research Foundation of Korea (NRF) funded by the Ministry of Education (NRF-2015R1D1A1A02061597 to SA and 2019R1A2C1006890 to JHC) and by Seoul National University Bundang Hospital (grant number 13-2016-013 to JHC). (C) Minimally invasive adenocarcinoma (MIA).