Establishment and Validation of a Nomogram for Nasopharyngeal Carcinoma Patients Concerning the Prognostic Effect of Parotid Lymph Node Metastases
Article information
Abstract
Purpose
The prognosis of nasopharyngeal carcinoma (NPC) patients with parotid lymph node (PLN) metastasis remains unclear. This study was performed to investigate the prognostic significance and optimal staging category of PLN metastasis and develop a nomogram for estimating individual risk.
Materials and Methods
Clinical data of 7,084 non-metastatic NPC patients were retrospectively reviewed. Overall survival (OS) was the primary endpoint. A nomogram was established based on the Cox proportional hazards regression model. The accuracy and calibration ability of this nomogram was evaluated by C-index and calibration curves with bootstrap validation.
Result
Totally, 164/7,084 NPC patients (2.3%) presented with PLNs. Multivariate analyses showed that PLN metastasis was a negative prognostic factor for OS, progression-free survival (PFS), distant metastasis-free survival (DMFS), and locoregional relapse-free survival (LRFS). Patients with PLN metastasis had a worse prognosis than N3 disease. Five independent prognostic factors were included in the nomogram, which showed a C-index of 0.743. The calibration curves for probability of 3- and 5-year OS indicated satisfactory agreement between nomogram-based prediction and actual observation. All results were confirmed in the validation cohort.
Conclusion
NPC patient with PLN metastasis had poorer survival outcome (OS, PFS, DMFS, and LRFS) than N3 disease. We developed a nomogram to provide individual prediction of OS for patients with PLN metastasis.
Introduction
Nasopharyngeal carcinoma (NPC) is an endemic malignancy prevailing in Southern and Southeast China [1,2]. Different from other head and neck cancers, NPC has a high predilection for regional lymph node metastasis as up to 85% of cases present with lymphadenopathy at diagnosis [3]. However, parotid lymph node (PLN) metastasis, which was classified as level VIII in the latest International Consensus Guidelines for nodal levels, is rare, with an incidence rate of only 1%-3.4% [4-7].
Nowadays, intensity-modulated radiotherapy (IMRT) has replaced two-dimensional conventional radiotherapy as the main radiation technique for NPC. With the advent of IMRT, which improved radiation doses to the primary tumor and offered better protection for the adjacent normal tissues, the parotid gland area receives rather low radiation doses to reduce the xerostomia and further improve the quality of life of NPC patients [8,9]. However, many studies have found that overprotection of the parotid gland increased recurrence rate of PLN after IMRT treatment of NPC compared to conventional radiotherapy [10-12]. Therefore, it is necessary to emphasize the prognostic value and standardize the treatment of PLN metastasis in clinical practice in IMRT era. Based on the criteria of the 8th edition of International Union Against Cancer/American Joint Committee on Cancer(UICC/AJCC) staging system, the classification of T4 has been changed from the invasion of the inferior temporal fossa and masticatory muscle space into extensive soft tissue involvement (beyond the lateral surface of the lateral pterygoid muscle, parotid gland) [13]. However, PLN metastasis is not included in the current UICC/AJCC staging system for NPC [14], which leads to different classifications and treatment strategies for PLN metastasis from center to center. Additionally, due to the low incidence of PLN involvement, there was a paucity of data addressing the prognostic significance and clinical staging reference for PLN metastasis [15,16]. Therefore, we retrospectively reviewed the clinical charts of 7,084 NPC patients including 164 patients with PLN metastasis, and further combined both PLN metastasis and clinical variables to generate a nomogram model with accurate prediction, which could be useful for guiding individualized treatment.
Materials and Methods
1. Patients
Newly diagnosed, non-distant metastatic, histologically-proven NPC treated with IMRT in Sun Yat-sen Cancer Center from 2008 to 2014 were identified. The inclusion criteria were as follows: (1) age ≥ 18 years, (2) Karnofsky performance score > 70, (3) hematological and Epstein-Barr virus (EBV) serology results were available, (4) received radical radiation treatment with or without chemotherapy, (5) complete follow-up data. After the screening procedure, 7,084 individuals including 164 patients with PLN metastasis were involved in the analysis. According to computer software-generated random numbers, 6,920 patients without PLN metastasis and 164 patients with PLN metastasis were randomly allocated in equal proportions into the training cohort and the validation cohort, separately. All patients were restaged according to the 8th UICC/AJCC staging system and equally divided into the training group and the validation group. The flow chart for patient inclusion was shown in Fig. 1. All patients were assessed by a complete physical examination, fiberoptic nasopharyngoscopy, magnetic resonance imaging (MRI) of the nasopharynx and neck, chest radiography, bone scan or whole-body fluorodeoxyglucose positron emission tomography (PET)/computed tomography (CT), complete blood count, renal and liver function tests, and plasma EBV DNA test.

Flow chart for patient inclusion. NPC, nasopharyngeal carcinoma; SYSUCC, Sun Yat-sen University Cancer Center.
2. Image assessment and diagnostic criteria
All patients were examined by a 1.5-T superconducting MRI system with scanning performed from the suprasellar cistern to the inferior margin at the sternal end of the clavicle as the previous study described [15]. All MRI scans were independently reviewed by two experts in head and neck radiology. No disagreement was remained after discussion. PLNs including the superficial and deep intraparotid nodes, subcutaneous pre-auricular nodes, and subparotid nodes were assessed [17]. All parotid nodules with a diameter ≥ 5 mm were recorded [18,19]. The diagnostic criteria for NPC with PLN metastasis in our study were as follows: (1) PLN metastasis confirmed by fine-needle aspiration cytology (FNAC) prior to treatment of NPC; (2) lymph nodes achieved a partial response or complete response according to the Response Evaluation Criteria in Solid Tumors (RECIST) 1.1 criteria [20] 3 months after completion of radiotherapy, or achieved stable disease but the node was enlarged on the subsequent follow-up MRI.
3. Treatment
All patients involved in this study underwent IMRT with or without chemotherapy in Sun Yat-sen Cancer Center. Five daily fractions of a total dose of 68-70 Gy at about 2 Gy per fraction were prescribed per week. Among 164 patients with PLN metastasis, the PLN lesions of 128 patients were delineated as gross tumor volume or clinical target volume receiving a radical prescribe dose more than 54 Gy. However, the other patients (n=36) with PLN involvement received parotid-sparing radiotherapy and the average mean dose delivered to ipsilateral parotid gland was 37.06 Gy (range, 28.77 to 42.05 Gy). Other details of the IMRT plan were in line with the principles described in previous studies [21-23]. The type of chemotherapy included neoadjuvant chemotherapy, concurrent chemoradiotherapy, and adjuvant chemotherapy. Salvage treatments (intracavitary brachytherapy, surgery, or chemotherapy) were provided when relapse or persistent disease occurred.
4. Follow-up and statistical analysis
After treatment, patients were examined every 3 months in the first 3 years and every 6 months thereafter or until death. The state of recurrence or metastasis was confirmed by pathological results or imaging tests. The primary endpoint measured overall survival (OS), which referred to the interval from the first day of hospitalization to death from any cause. The second endpoint measured progression-free survival (PFS; the interval from the first day of hospitalization to disease progression or death from any cause), locoregional relapse-free survival (LRFS), and distant metastasis-free survival (DMFS), which accordingly corresponded to the interval to first recurrence and distant metastasis.
All computations were performed with SPSS ver. 24.0 (IBM Corp., Armonk, NY) or R 3.5.3 (R project, http://www.R-project.org/). Categorical variables were compared by chi-square test or Fisher exact test. Survival parameters were calculated using Kaplan-Meier actuarial analysis, and the differences were compared by log-rank test. Multivariate analyses were calculated using the Cox proportional hazards regression model. A nomogram based on the Cox regression model was used to predict the 3-year and 5-year OS. The C-index was calculated to measure the predictive accuracy and the discriminative ability of this nomogram. Calibration curves were generated to estimate the performance of the nomogram along with bootstrap validation. A two-sided p-value of < 0.05 was considered significant.
5. Ethical statement
The study was approved by the Sun Yat-sen University Cancer Center Research Ethics Committee (308-2018-02-01). Patients were required to provide written informed consent before enrolling in the study.
Results
1. Clinical characteristic and survival
From January 2008 to December 2014, 7,084 non-metastatic NPC were enrolled in this study. Finally, 211 positive PLNs (PLN (+)) were found in 164 patients. All identified PLNs were separated from the primary lesion, including 153 superficial nodes and 58 deep intraparotid nodes. The median shortest and largest axial diameter of the positive PLNs were 8.8 mm (range, 5.3 to 21.2 mm) and 11.4 mm (range, 5.8 to 32.5 mm), respectively. Meanwhile, 28 and 33 metastatic PLNs were observed to have extracapsular spread and necrosis, respectively.
The median age was 46 years old and the male-to-female ratio was 2.8:1. As shown in Table 1, patients with PLN(+) were inclined to have more advanced T category (p < 0.001) and N category (p < 0.001). The percentages of concomitant T4 and N3 grades in PLN(+) group were 35.4% and 38.4% respectively, compared with 22.2% and 8.2% in PLN(–) group (p < 0.001). Similarly, the median minimal axial diameter of positive lymph node at level II in PLN (+) group was 18 mm (range, 7 to 41 mm) and 12 mm (range, 3 to 61 mm) in PLN(–) group (p < 0.001). PLN(+) patients were more likely to present with rare neck involvement including level Ia/b, Vc, and VI (45.7% vs. 10.7%, p < 0.001). Additionally, PLN metastasis was significantly affiliated with level II cervical lymph nodes necrosis, extracapsular spread as well as EBV DNA level (lactate dehydrogenase) level (p < 0.001).

Patient characteristics in PLN(–) and PLN(+)
The median follow-up was 46.5 months (interquartile range, 33.3 to 64.2 months) among the whole cohort. The OS was 91.8% (95% confidence interval [CI], 91.2 to 92.4) at 3-year and 85.2% (95% CI, 84.2 to 86.2) at 5-year follow-up.
2. Comparison of staging categories for PLN metastasis
To investigate the prognostic value of PLN metastasis compared with N category based on the 8th UICC/AJCC staging system, we divided all 7,084 patients into five groups. Patients without PLN metastasis were grouped by N category from grade 0 to 3 while patients with PLN metastasis were assigned to another group. The survival curves of each group were shown in Fig. 2. Obviously, patients with N0 achieved the best OS, followed by N1, N2, N3, and patients with PLN metastasis had the worst prognosis. The 5-year OS rates were 92.9%, 88.4%, 82.6%, 71.1%, and 57.3%, respectively (Fig. 2A). The same survival trend could be also observed in terms of PFS and DMFS while patients in N0-3 group showed similar LRFS (Fig. 2B-D). Noticeably, even though patients in N0-3 group showed similar LRFS (Fig. 2B-D), patients with PLN metastasis suffered from worse LRFS compared to the other four groups with statistically significant difference (p < 0.001).
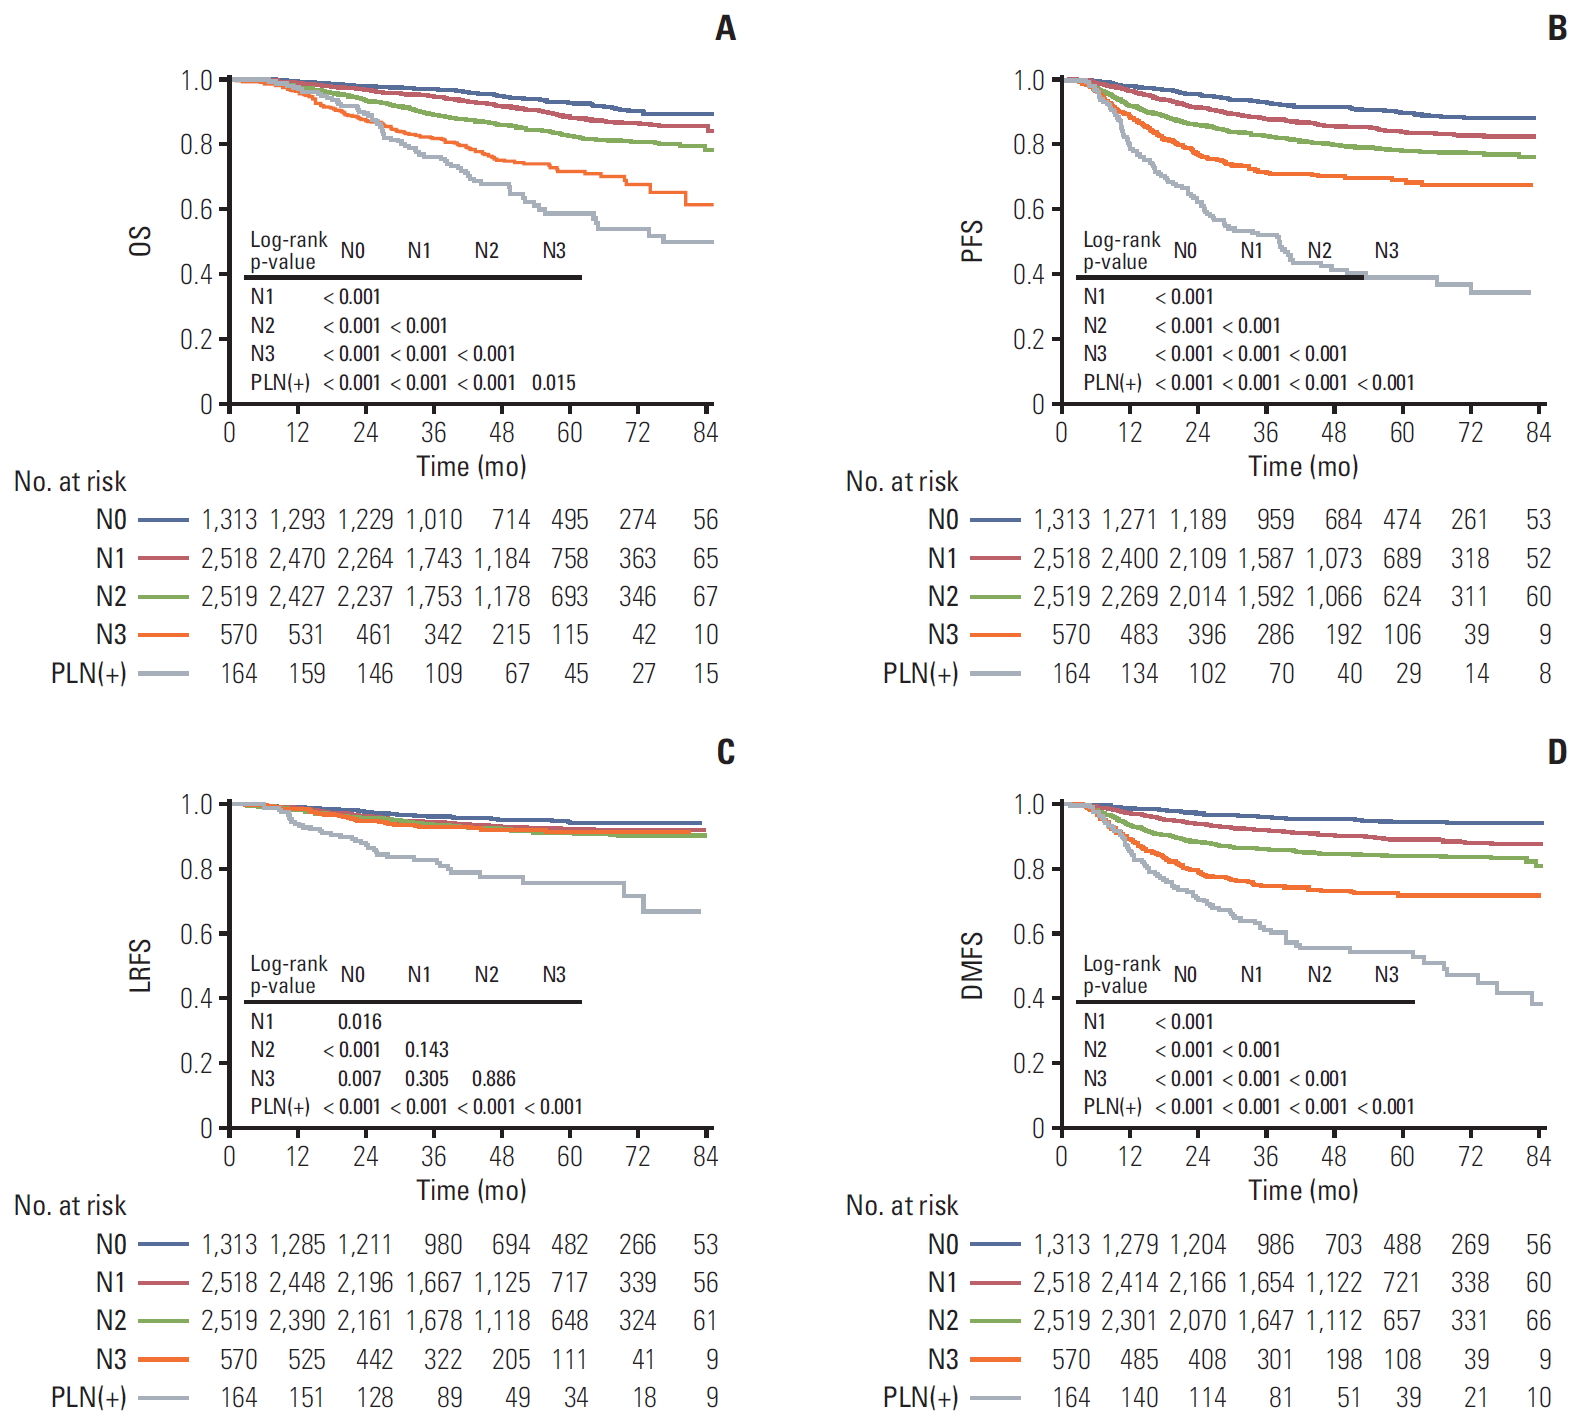
Kaplan-Meier survival curves of overall survival (OS) (A), progression-free survival (PFS) (B), locoregional relapsefree survival (LRFS) (C), and distant metastasis-free survival (DMFS) (D) for comparing 164 patients with parotid lymph nodes (PLN) involvement and 6,920 patients without PLN involvement classified by N classification.
3. The establishment nomogram model for OS involving PLN metastasis
As the PLN metastasis showed an important prognostic value in non-metastatic NPC, we further established a nomogram model for OS, which considered the PLN metastasis as a prognostic factor on the basis of the large cohort. The whole cohort was randomly divided into training cohort and validation cohort with a ratio of 1:1, and 3,542 patients were in each group. Patient characteristics were in good balance between the two cohorts, which were listed in Table 2.

Patient characteristics in training cohort and validation cohort
We carried out the multivariate analyses that included all potential prognostic factors (age, sex, T category, N category, and EBV DNA) in training cohort. As shown in Table 3, all five factors had a significant effect on OS (p < 0.05). A nomogram was further generated to predict the 3-year and 5-year OS (Fig. 3). By adding up the total score and locating it on the total point scale, we were easily able to draw a straight line down to establish the estimated individual probabilities of OS at the 3-year and 5-year time points.

Multivariable analysis of prognostic factors for OS, PFS, LRFS, and DMFS in training cohort

Prognostic nomogram for 3- and 5-year overall survival (OS) based on the training cohort. EBV DNA, Epstein-Barr virus DNA. As an example, locate the patient's sex and draw a line straight up to the “Points” axis to determine the associated score. Add the scores achieved for each covariate, and locate this sum on the “Total Points” axis. Draw a line straight down to determine the likelihood of 3- or 5-year OS. As a calculation parameter, “Linear Predictor” is not directly applied to the calculation of the survival rate.
4. The accuracy and calibration of the nomogram
A bootstrap validation method was applied to validate the nomogram model. In training cohort, the bootstrap-corrected C-index of this model was 0.743 (95% CI, 0.720 to 0.766), which exhibited good accuracy for predicting the 3-year and the 5-year OS. The calibration curves were shown in Fig. 4A and B. As observed, the calibration plot for the probability of 3-year and 5-year OS showed satisfactory agreement between prediction value and actual value in the training cohort. In the validation cohort, the Harrell C index was 0.738 (95% CI, 0.714 to 0.792). The calibration curves for validation cohort of 3-year and 5-year OS were shown in Fig. 4C and D, which also showed an agreeable calibration.
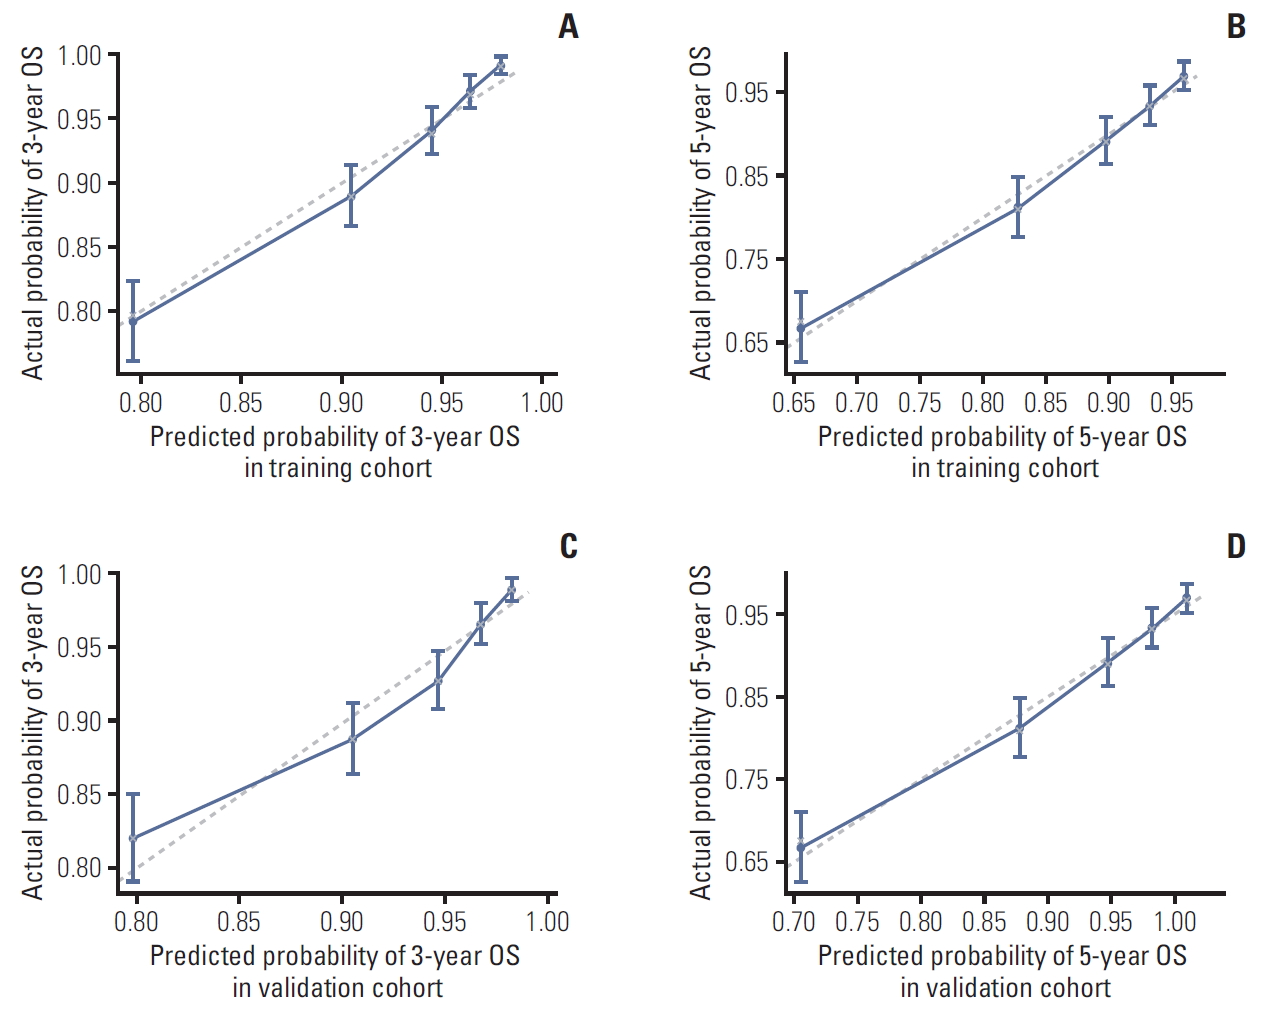
The calibration plots for predicting overall survival (OS) in training cohort at 3-year (A) and 5-year (B) OS and in validation cohort at 3-year (C) and 5-year (D) OS. Actual OS is plotted on the y-axis; nomogram-predicted probability of OS is plotted on the x-axis.
Discussion
In this study, we retrospectively reviewed a large cohort of 7,084 NPC patients including 164 with PLN metastasis and found that patients with PLN metastasis were associated with poorer OS, PFS, DMFS, and LRFS compared with N3 disease based on the 8th UICC/AJCC staging system. Furthermore, we built up a nomogram combining both PLN metastasis and clinical variables for guiding individualized treatment. The nomogram showed satisfactory predictive and calibrative ability. To the best of our knowledge, this is the first survival-prognostic nomogram with PLN metastasis involved in NPC patients, and also the largest retrospective study to assess the prognostic value of PLN metastasis.
Initial PLN metastasis is far less common in NPC patients with an incidence rate of 1%-3.4% in previous studies [4-7] and 2.3% in our study. Due to the low incidence of PLN involvement, there was a paucity of data addressing the prognostic significance and appropriate clinical classification methods for PLN metastasis [15,16]. Zhang et et al. [15] verified that PLN group had a poorer DMFS than N2 disease but was close to N3 disease. Similarly, Xu et al. [16] confirmed that the 5-year DMFS and regional relapse-free survival (RRFS) rates in case with PLN involvement were significantly worse than N2 disease but similar to N3 disease. Meanwhile, the 5-year OS and PFS were consistent with N2 disease. In coincidence with previous studies, our study showed that PLN metastasis was an independent negative prognostic factor for OS, PFS, DMFS, and locoregional recurrence-free survival. Furthermore, significantly poorer survival outcomes were observed in PLN group compared to the N3 group. The possible reasons might be as follows: all patients in previous studies were staged according to the 7th edition of UICC/AJCC staging system, which offered less diagnostic value compared with the latest version. On the other hand, the sample sizes of previous studies were relatively small, with 10 and 45 PLN patients recruited respectively, which was insufficient to detect the difference. On account of the scarity of PLN metastasis, a large sample size was required to draw conclusive conclusions. Based on our results, NPC patients with PLN metastasis should be regarded as an independent subgroup which presented with higher risk than N3 group. More aggressive therapeutic strategies such as more effective systemic chemotherapy and immunotherapy should be considered for these patients to improve their prognosis.
It is noteworthy that traditional TNM system was mainly based on anatomical disease extension and did not take the non-anatomic prognostic factor into account, which may account for the varied survival outcomes in patients with same stage [24]. Nomogram, as a predictive tool, has been proved to provide higher prediction accuracy than the traditional TNM classification [25,26]. Therefore, we established a nomogram incorporating TNM stage, PLN metastasis and other risk factors to predict 3-year OS and 5-year OS. Pretreatment plasma EBV DNA load has been reported as a considerable biomarker for NPC patients [27]. Several studies have verified its prognostic value for both non-metastatic and metastatic patients [28-30]. However, there was little data evaluating the value of plasma EBV DNA in PLN metastatic patients. Our study firstly showed that PLN(+) patients exhibited with much higher pretreatment EBV DNA level than other non-metastatic patients, and the median EBV level amont them was 22,600 copies/mL. This can serve as another evidence to explain the strong correlation between PLN mestastasis and poor survival outcomes. As all patients in this study had available pretreatment plasma EBV DNA results, which was proved as a prognosticator for survival, we included this factor in our model. Other important factors including sex and age were also incorporated in the final model as they also showed predictive capacity in both previous study [24] and our study.
The current nomogram showed good accuracy for the prediction of OS, with the C-index of 0.743 and 0.738 in training and validation cohort. PLN was found to make the largest prognostic contribution in this nomogram. When patients with suspicious PLN get high score based on this nomogram, the lymph node in parotid should be verified by FNAC and/or PET-CT, more aggressive treatment regimen and more frequent follow-up is recommended, whereas parotid-sparing IMRT may be not appropriate under this situation. Moreover, EBV DNA was closely related to PLN metastasis and was also a powerful prognostic factor in our model. It is strongly recommended that EBV DNA be monitored routinely if the condition allows. The model revealed the risk of PLN metastasis and provided physicians a more precise and easy-to-use tool for decision-making.
However, the result of this study should be cautiously interpreted due to its limitations. Firstly, false-negative and false-positive diagnoses of PLN metastasis might exist in this study for the lack of pathological evidence. Secondly, this was a retrospective study with patients from one center. EBV DNA level was not routinely detected in some medical centers on account of the technical difficulty in its measurement. Thirdly, the treatment modalities for PLN involvement varied a lot, which made it inappropriate to evaluate the survival impact of treatment on patient with PLN metastasis. Finally, although on the whole, the calibration plot for the probability of 3-year OS showed satisfactory agreement between prediction value and actual value, the CIs of highest OS in prediction value did not include the actual probability both in training and validation cohorts. Thus, the practical applicability of our model might be influenced to some extent. In short, there is a need for a lager, multicenter, and prospective study to further investigate the prognostic value of PLN metastasis in NPC patients.
In conclusion, our study verified that PLN metastasis was coincidence with N category and higher serum EBV DNA level. As an adverse prognostic factor for survival endpoint (OS, PFS, DMFS, and RRFS), NPC patient with PLN metastasis suffered poorer prognosis than N3 disease. We built up a nomogram involving PLN metastasis and EBV DNA for guiding individual treatment.
Notes
Conflict of interest relevant to this article was not reported.