Diabetes Mellitus Is Associated with Inferior Prognosis in Patients with Chronic Lymphocytic Leukemia: A Propensity Score-Matched Analysis
Article information
Abstract
Purpose
Diabetes mellitus (DM) is associated with elevated cancer risk and poor survival outcome in malignancies. The objective of this study was to evaluate the prognostic value of preexisting DM in chronic lymphocytic leukemia (CLL).
Materials and Methods
Six hundred and thirty-three subjects with newly-diagnosed CLL between 2007 and 2016 were recruited. Propensity score-matched method was performed to balance baseline characteristics and eliminate possible bias. Univariate and multivariate Cox regression analyses screened the independent risk indicators for time-to-first-treatment (TTFT) and cancer-specific survival (CSS) of CLL. Receiver operator characteristic curves and the corresponding areas under the curve assessed the predictive accuracy of CLL–International Prognostic Index (IPI) together with DM.
Results
The results showed that 111 patients had pre-existing DM. In the propensity-matched cohort, DM was correlated with inferior TTFT and CSS in CLL patients, and it was an independent prognostic factor for both CSS and TTFT. Pre-diabetics also shared undesirable prognostic outcome compared with patients with no diabetic tendency, and a positive association between longer diabetic duration and poorer prognosis of CLL was identified. DM as one additional point to CLL-IPI had larger area under the curve compared with CLL-IPI alone in CSS prediction and could improve the prognostic capacity of CLL-IPI.
Conclusion
Pre-existing DM was found to be a valuable prognostic predictor and could help predict life expectancy and build refined prognostication models for CLL.
Introduction
Diabetes and malignancy are multifactorial heterogeneous diseases, and both have witnessed a rapid increase in prevalence owing to environmental and lifestyle changes. In the recent decade, accumulating evidence suggested that diabetes mellitus (DM) was associated with elevated cancer risks in liver, pancreatic, colorectal and breast via possible mechanisms of hyperglycemia, hyperinsulinemia, and chronic inflammation. Regarding lymphoproliferative diseases, three meta-analyses reported the risk ratio of developing non-Hodgkin lymphoma (NHL) in diabetic patients was 1.19 (95% confidence interval [CI], 1.04 to 1.35) [1], 1.22 (95% CI, 1.07 to 1.39) [2], and 1.79 (95% CI, 1.30 to 2.47) [3], respectively. Epidemiological studies have shown a significant correlation in incidence between acute lymphoblastic leukemia (ALL) and type 1 diabetes mellitus (T1DM) at both international and regional levels. Standardized incidence ratios were significantly increased for both ALL (5.70; 95% CI, 3.68 to 8.43) and acute myeloid leukemia (AML) (2.57; 95% CI, 1.02 to 5.32) following hospitalization for T1DM [4].
Chronic lymphocytic leukemia (CLL), the most common hematological malignancy in the west, is extremely heterogeneous in clinical manifestations and evolutions. Chemoimmunotherapy of fludarabine, cyclophosphamide, and rituximab (FCR) has been considered as the first-line treatment since 2010, which improved overall survival (OS) compared with fludarabine plus cyclophosphamide (FC). However, only 40%-60% of patients achieved complete remission, while the rest experienced either relapse or hematologic toxicity. Clinical and biological prognostic factors such as advanced Binet stage, unmutated status of the immunoglobulin heavy chain variable region (IGHV), zeta-chain associated protein kinase 70 (ZAP-70) and CD38 expression were shown in correlation with unfavorable survival outcome [5-7]. There have also been studies indicating CD49d [8], miRNA [9], and NOTCH1 [10] as potential factors that might alter CLL prognosis or treatment outcome. Besides these single markers, various models and scores such as the International Prognostic Index for Chronic Lymphocytic Leukemia (CLL-IPI) were introduced to predict prognosis in CLL, but few of them were validated in prospective clinical trials. In addition, most of the prognostic markers identified for CLL are genetic-based alterations (such as IGHV, ZAP-70), to which little can be done to either prevent the development of CLL or alleviate its severity. On the other hand, if modifiable conditions, such as type 2 diabetes mellitus (T2DM) or hypertension, can be proven as prognostic factors for CLL, then it would be much more meaningful clinically, since there are measures to prevent or treat these chronic conditions. A case-control study in Canada found a higher prevalence of dyslipidemia and hypertension preceding a diagnosis of CLL [11]. However, to our knowledge, no research to date has found an association between CLL and DM.
The aims of our study are (1) to investigate the correlation between pre-existing DM and CLL, and the prognostic value of DM in CLL survival outcome; (2) to establish a novel prognostic index including DM (DM-PI) for CLL.
Materials and Methods
1. Patients
Six hundred and eighty consecutive subjects with newly-diagnosed CLL between January 2007 and December 2016 from the First Affiliated Hospital of Nanjing Medical University were retrospectively enrolled. Forty-seven patients were excluded due to (1) incomplete clinical information, laboratory examinations or follow-up data; (2) human immunodeficiency virus–infected; (3) diagnosed with previous malignancies; (4) patients who died of accident or other medical conditions with no relation to CLL. A diagnosis of CLL was based on the criteria of the International Workshop on CLL–National Cancer Institute (IWCLL-NCI). The flow chart of the study population is demonstrated in S1 Fig.
Among the eligible 633 cases, 452 (71.41%) received induction therapies, including fludarabine, cyclophosphamide, and rituximab (n=178, 39.38%), fludarabine and cyclophosphamide (n=122, 26.99%), bendamustine (n=22, 4.87%), chlorambucil and rituximab (n=62, 13.72%), and chlorambucil (n=68, 15.04%).
As regards to the relative dose intensity of chemotherapies, both diabetics and non-diabetics received standard treatments without delay or dose reduction (including steroid) due to hyperglycemia or other diabetic complications. The dose of rituximab is 375 mg/m2 in all rituximab-based chemoimmunotherapies. In FC or FCR, the dose intensity is fludarabine 25 mg/m2 intravenously and cyclophosphamide 250 mg/m2 intravenously. For bendamustine, the specific dose is 100 mg/m2 intravenously on days 1 and 2 of a 28-day treatment cycle, while for chlorambucil the dosing is oral 0.1 mg/kg/day for 3 to 6 weeks or intravenous 0.4 mg/kg pulsed doses administered intermittently, biweekly, or monthly. The numbers of patients according to diabetic status distributed by treatment types are presented in Tables 1 and 2.
2. Data collection
All CLL patients were managed and treated in the inpatient department, while the follow-up examinations were conducted in the outpatient department. Baseline demographic and clinical data concerning gender, age, Binet stage, Eastern Cooperative Oncology Group (ECOG) performance status (PS) and CLL-IPI were retrieved from medical records and hospital registries. Laboratory data within 24 hours after first CLL admission, including absolute lymphocytic count, hemoglobin (Hb), platelet count (PLT), lactate dehydrogenase (LDH), serum albumin, β2-microglobulin (β2-MG), and C-reactive protein levels, were obtained from the hospitalbased laboratory service.
Fluorescence in situ hybridization analysis was performed to detect del(11q22) and del(17p13) using commercially available probes as described elsewhere [12]. The cutoff levels for positive values (mean of normal control ±3 standard deviation), determined from samples of cytogenetically normal persons, were 7.7% and 5.2% for del(11q22) and del(17p13) respectively. Sanger sequencing of TP53 (exons 4-9) was conducted as previously reported [13]. We referred the cohort with TP53 mutation and/or del(17p13) as TP53 disruption. Sequence analysis of IGHV was performed as previously described and germline IGHV was defined as ≥ 98% germline homology [14]. Immunophenotyping of CD38 and ZAP-70 were detected via flow cytometry [15], and the cutoff levels for positivity were 30% and 20%, respectively.
3. Definition of pre-existing DM
Pre-existing DM was defined as patients having any one of the following characteristics at diagnosis of CLL: diagnosis of DM from medical records of previous outpatient visit or hospitalization (based on the International Statistical Classification of Diseases and Related Health Problems, 10th revision [ICD-10] code E10, E11, and E14 or antidiabetic prescriptions); fasting plasma glucose level (FPG) ≥ 7.0 mmol/L (126 mg/dL) at first hospital admission for CLL before administration of prednisone. Diabetes newly-identified during the CLL follow-up periods was ignored. Prediabetes was defined as having medical histories of impaired fasting glucose (IFG) or impaired glucose tolerance (IGT) (ICD-10 code R73.0), or FPG ≥ 6.1 mmol/L (110 mg/dL) and < 7.0 mmol/L (126 mg/dL) at first CLL diagnosis. Diabetes, IFG, and IGT were diagnosed according to the criteria established by the World Health Organization [16]. Diabetic duration (calculated from the earliest applicable diagnosis of DM to the first CLL admission) and antidiabetic treatments at enrollment were also collected from medical records and hospital registries. FPG results were accessible from the hospital-based laboratory service for all patients. Venous blood samples were collected between 7:00 AM and 9:00 AM after overnight fasting on the second day after first admission. Within 2 hours after blood sample collection, plasma glucose level was measured on an automatic enzymatic analyzer (Beckman Coulter, Fullerton, CA) by means of glucose oxidase or hexokinase method under a stringent quality control mechanism.
Their antidiabetic medications before admission of CLL were still used as the basic glycemic control during the entire hospitalization. Insulin was also applied for poorly controlled hyperglycemic patients.
4. Follow-up and outcome measures
The patients recruited were followed for 7-129 months until August 2017, with a median follow-up time of 65 months. The follow-up included clinical and laboratory checkups every 3 months for the first year and every 6 months from the second to the fifth years at the outpatient department. For those who survived more than 5 years, the follow-up and mortality data were carefully retrieved from hospital records, death certificates in local disease control center, or by interviewing (directly or by telephone) the patients, their families and personal physicians annually. Diabetic patients and non-diabetics were treated unbiasedly with uniformity of reassessment.
The follow-up events include time-to-first-treatment (TTFT) and cancer-specific survival (CSS). TTFT refers to the period from the diagnosis date to either the time of the first CLL-specific treatment or to the last follow-up date. Owing to that TTFT is strongly affected by status at diagnosis especially Binet stage and it would be difficult to evaluate long-term e ffect of DM on CLL survival, patients who had treatment immediately after diagnosis were excluded from the prognostic analyses of TTFT. CSS was calculated as the interval between diagnosis and CLL-specific death (including CLL-related pneumonia) or the end of the follow-up (August 2017). Cause of death coded as C91.1, J12.9, or J15.9 based on ICD-10 was classified as CLL-specific death, while eight deaths due to other causes, including two due to lung cancer (ICD-10 code C34.9), one due to glioma (ICD-10 code C71.9), three due to ischemic heart disease (ICD-10 code I25.9) and two due to stroke (ICD-10 code I64) were excluded from the analyses of CSS, but were still included in the analysis of OS to further exclude selection bias.
5. Statistical analyses
All statistical analyses were performed by SPSS ver. 23.0 (IBM Corp., Armonk, NY) and R software 3.2.5 (http://www.r-project.org/) with MatchIt packages. Categorical variables were displayed as percentage and compared by the chisquare test or the Fisher exact test. Continuous variables were shown as mean±standard deviation and compared by the unpaired t test or the Mann-Whitney U test. Underlying assumptions for the t test were previously assessed including the normality test and the homogeneity test of variances. Survival curves were constructed by the Kaplan-Meier method and differences were compared by the log-rank test. Univariate and multivariate Cox regression analyses were performed to determine the independent risk indicators for TTFT and CSS. Collinearity diagnoses were performed by calculation of the variance inflation factor (VIF) and the tolerance value of each univariate predictor. Variables with VIF ≥ 10.0 or tolerance ≤ 0.1 represented severe multicollinearity and this was used as a guide for exploring alternative models. Propensity score-matched (PSM) analyses, using the 1:1 nearest neighbor technique with a small caliper of 0.1, were carried out to ensure better balance and reevaluate univariate and multivariate analyses in matched couples. Receiver operator characteristic curves and the corresponding areas under the curve (AUC) were calculated to assess the predictive accuracy of CLL-IPI together with DM. The difference in AUCs was tested by a non-parametric approach developed by DeLong et al. [17] Difference with a two-sided p < 0.05 was considered significant.
6. Ethical statement
This study was approved by the Ethics Committee of the First Affiliated Hospital of Nanjing Medical University. All aspects of the study, including periodical clinical and laboratorial checkups were performed according to the principles of the Declaration of Helsinki (64th, 2013). Written informed consent and permissions for the possibility of utilizing their clinical data anonymously in the future were obtained from all subjects involved in this study at the time of first CLL admission.
Results
1. Patients’ clinical characteristics in relation to DM
Six hundred and thirty-three newly-diagnosed CLL patients were finally recruited in our study. In total, 111 CLL patients (17.54%) had pre-existing DM, with 103 patients having a medical history of diabetes, and the other eight whose FPG levels ≥ 7.0 mmol/L at diagnosis of CLL. Furthermore, 56 patients (8.85%) had prediabetes, including 17 patients reporting a history of IFG or IGT, and the other 39 patients whose FPG levels ≥ 6.1 mmol/L and < 7.0 mmol/L at enrollment. The mean FPG levels for diabetes and prediabetes were 7.83±2.54 mmol/L and 6.54±0.29 mmol/L, respectively. The median diabetic duration was 48 months (range, 0 to 360 months).
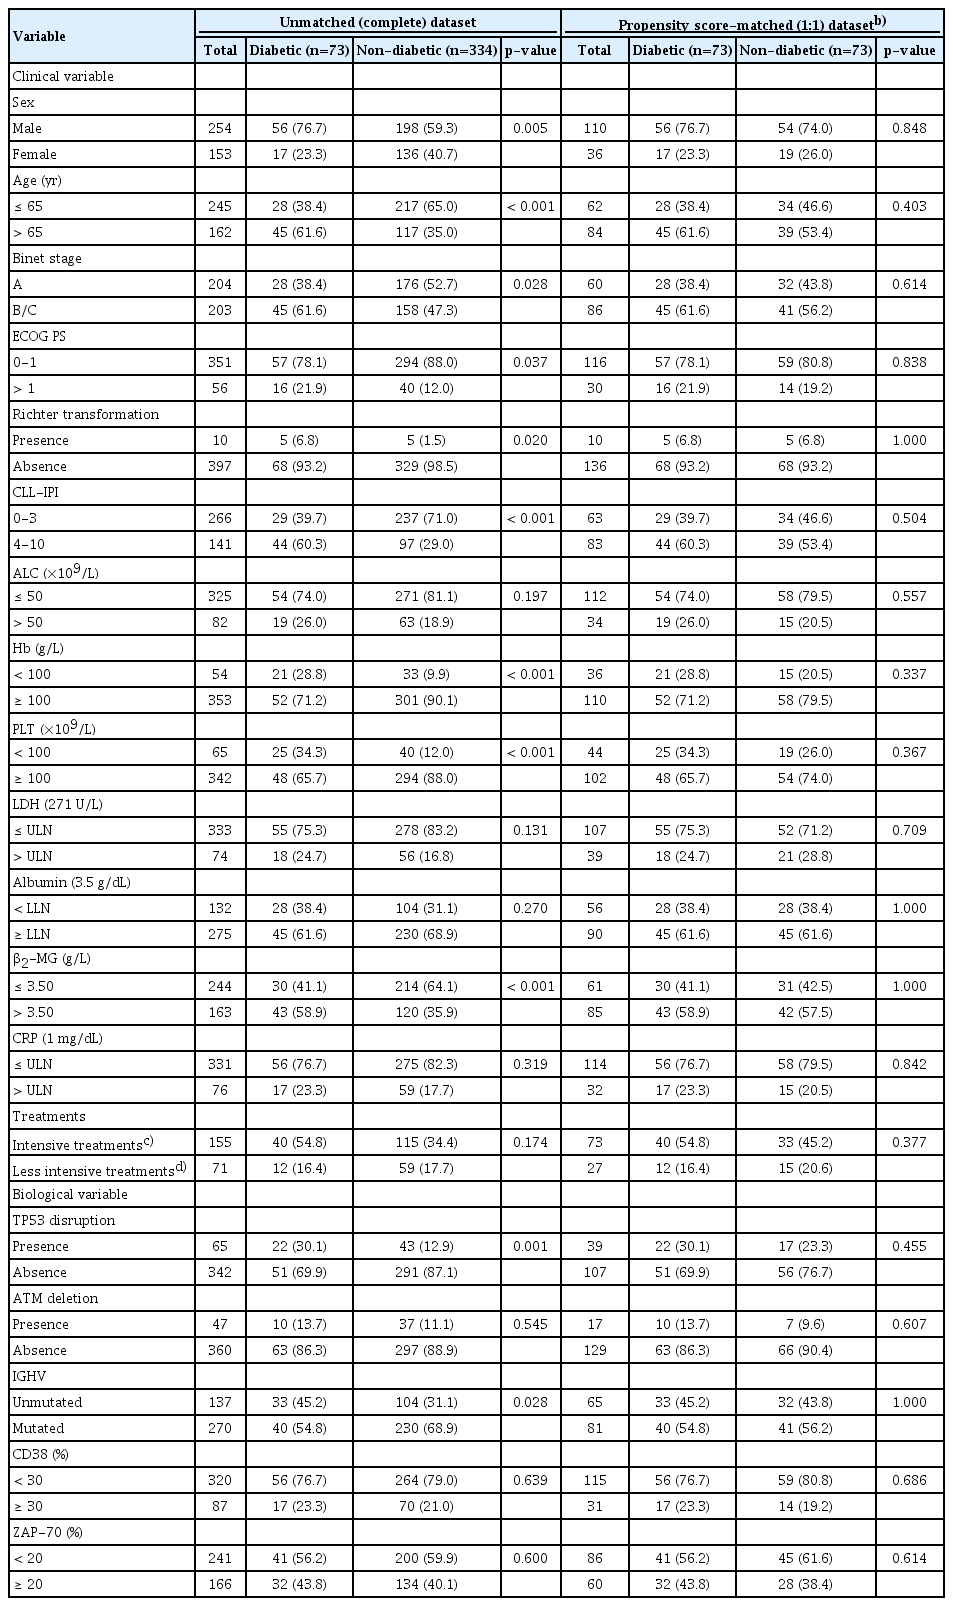
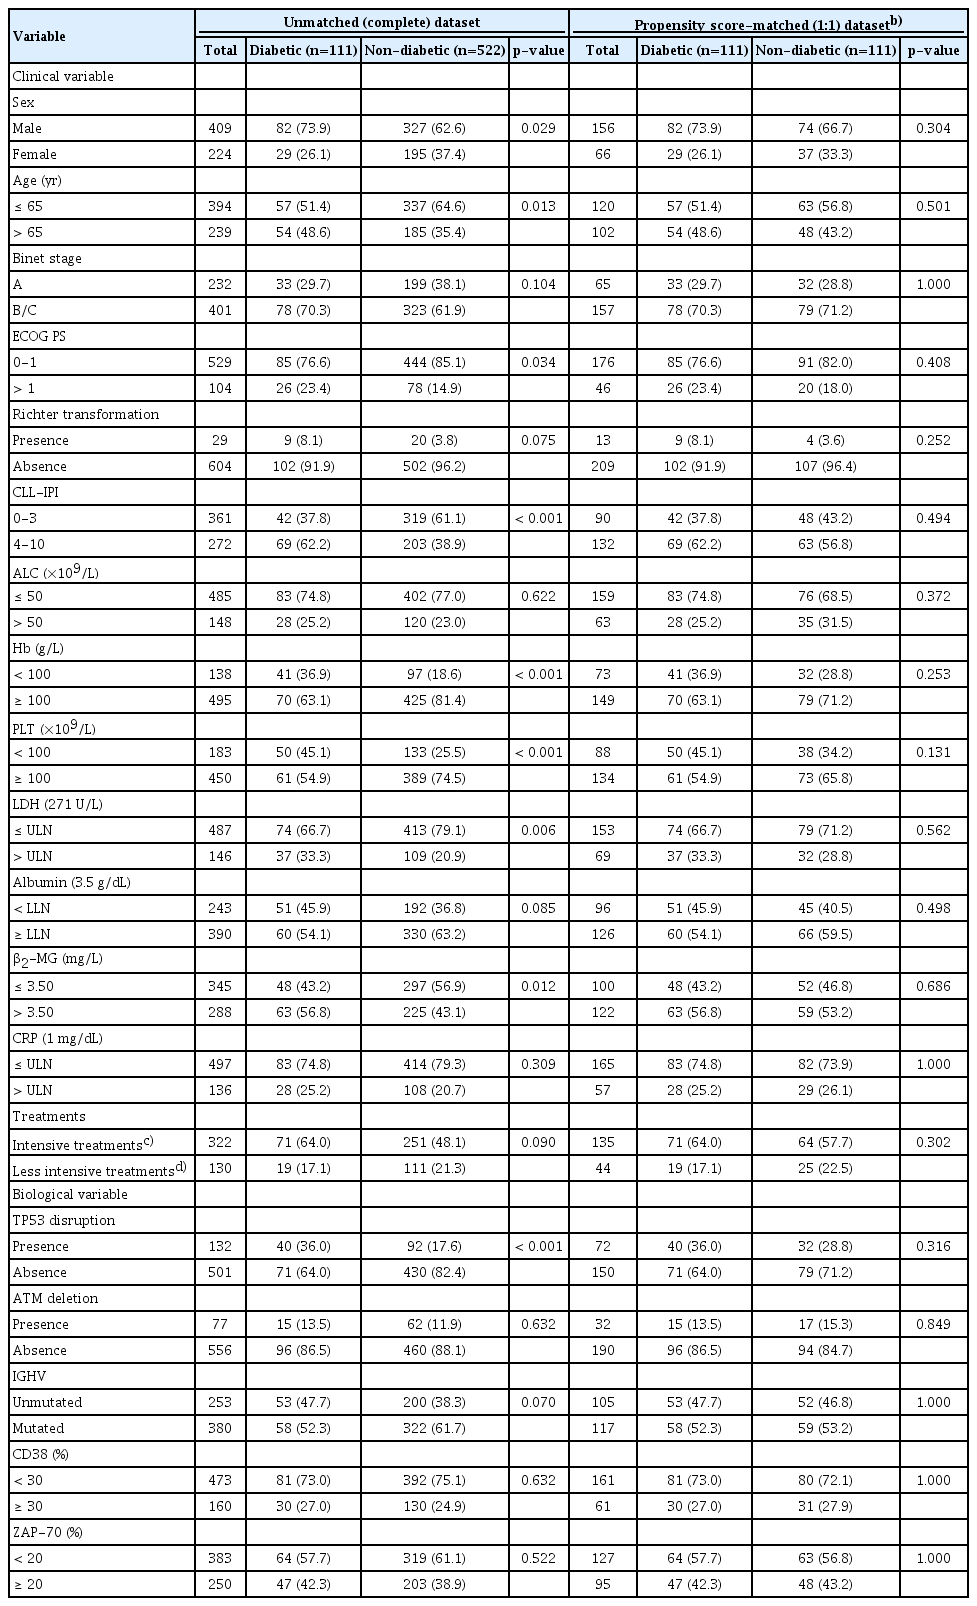
The baseline characteristics according to diabetic status for evaluating TTFT and CSS were correspondingly presented in Tables 1 and 2. In patients for TTFT and CSS evaluation, clinical variables of sex male (p=0.005 for TTFT and p=0.029 for CSS), age above 65 years (p < 0.001 for TTFT and p=0.013 for CSS), elevated ECOG PS (> 1) (p=0.037 for TTFT and p=0.034 for CSS) and CLL-IPI score (4-10) (p < 0.001 for both TTFT and CSS) were associated with DM. Diabetic CLL patients were more likely to have reduced Hb and PLT levels, together with elevated β2-MG concentrations in both TTFT and CSS cohort, with p-values around 0.001. As for biological variables, significant correlations were identified for TP53 disruption (p=0.001 for TTFT and p < 0.001 for CSS). Moreover, no statistically evident difference (p=0.174 for TTFT and p=0.090 for CSS) was detected in the distribution of CLL therapies suggesting diabetic and non-diabetic patients received comparable treatments.
To balance the characteristics between diabetics and nondiabetics, PSM analyses with 1:1 ratio were applied to minimize the differences in potential confounders including sex, age, Binet stage, ECOG PS, Hb, PLT, LDH and β2-MG levels, TP53 disruption, ATM deletion, IGHV mutational status, CD38, and ZAP-70 expressions. After matching, these clinicopathological parameters were adequately balanced and evenly distributed in the propensity-matched dataset as shown in Tables 1 and 2 (all p > 0.1).
2. Prognostic value of pre-existing DM in CLL
During the median follow-up of 65 months (range, 7 to 129 months), 452 patients (71.41%) had treatment indications, and 190 patients (30.02%) deceased. Among the 452 patients who received induction therapies, 226 required immediate medication after initial diagnosis, while the other 226 received treatment during the follow-up but with no indication of antileukemic therapy at CLL diagnosis. Patients who were immediately treated after diagnosis were excluded from the prognostic analyses of TTFT.
In diabetic CLL patients, the median of TTFT was 24 months (range, 2 to 95 months) and of CSS was 60 months (range, 1 to 129 months), which were significantly worse compared with non-diabetic CLL patients, in whom the median of TTFT was 46 months (range, 2 to 127 months) and of CSS was 125 months (range, 2 to 129 months) (p < 0.001 for both TTFT and CSS) (Fig. 1A and B). After propensity score-matching, diabetic patients showed only a tendency towards significance in TTFT (p=0.068); however, their CSS was still significantly worse compared to non-diabetic patients (p < 0.001) (Fig. 1C and D).

Kaplan-Meier curves of time-to-first-treatment (TTFT) and cancer-specific survival (CSS) stratified by diabetic status before and after propensity matching. (A) TTFT in unmatched (complete) dataset. (B) CSS in unmatched (complete) dataset. (C) TTFT in propensity score-matched (1:1) dataset. (D) CSS in propensity score-matched (1:1) dataset.
Table 3 demonstrated the univariate and multivariate Cox regression analyses of TTFT and CSS (VIFs of all variables < 2) for potential prognostic factors in CLL. All the variables, regardless of significance in univariate analyses, further entered multivariate Cox regression analyses to avoid confounding effect. For TTFT in the complete cohort, seven variables remained statistically evident in multivariate analyses, including Binet B/C (hazard ratio [HR], 1.901; 95% confidence interval [CI], 1.366 to 2.644; p < 0.001), ECOG PS > 1 (HR, 1.523; 95% CI, 1.027 to 2.257; p=0.036), reduced PLT level (HR, 1.577; 95% CI, 1.082 to 2.301; p=0.018), β2-MG > 3.50 mg/L (HR, 1.378; 95% CI, 1.022 to 1.857; p=0.036), TP53 disruption (HR, 1.577; 95% CI, 1.114 to 2.234; p=0.010), IGHV unmutated status (HR, 1.919; 95% CI, 1.425 to 2.584; p < 0.001), and diabetic (HR, 1.639; 95% CI, 1.170 to 2.297; p=0.004). For CSS, diabetic (HR, 2.758; 95% CI, 1.989 to 3.824; p < 0.001) together with the other five variables remained statistically significant in multivariate analyses, including age > 65 years (HR, 1.876; 95% CI, 1.378 to 2.554; p < 0.001), Binet B/C (HR, 2.029; 95% CI, 1.319 to 3.122; p=0.001), β2-MG > 3.50 mg/L (HR, 1.523; 95% CI, 1.098 to 2.112; p=0.012), TP53 disruption (HR, 1.934; 95% CI, 1.388 to 2.695; p < 0.001), and IGHV unmutated status (HR, 1.960; 95% CI, 1.424 to 2.697; p < 0.001), which were in accordance with the parameters in CLL-IPI. In conclusion, pre-existing DM was an independent prognostic predictor not only for TTFT, but also for CSS. After PSM, multivariate Cox regression analyses (VIFs of all variables < 2) showed that diabetic still remained an independent prognostic factor for both TTFT (HR, 1.580; 95% CI, 1.041 to 2.398; p=0.032) and CSS (HR, 2.514; 95% CI, 1.613 to 3.918; p < 0.001).
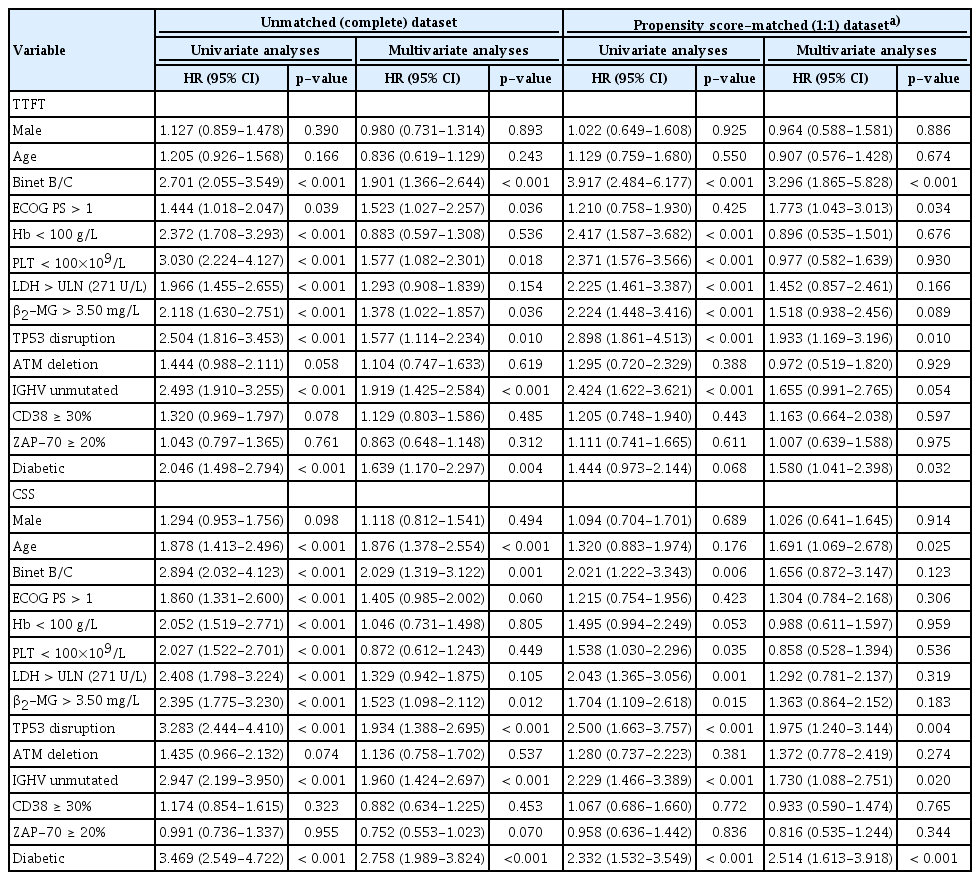
Univariate and multivariate Cox regression analyses of TTFT and CSS before and after propensity matching
Owing to that excluding information from future events would generate selection bias, we analyzed the association between DM and all-cause mortality by censoring individuals at the time of death due to other causes rather than excluding them. Univariate and multivariate Cox regression analyses of TTFT and OS (VIFs of all variables < 2) were conducted in 641 patients including eight who died of other causes. After multivariate analyses, DM was an independent factor correlated with worse TTFT and OS (HR, 1.643; 95% CI, 1.179 to 2.290; p=0.003 for TTFT and HR, 2.744; 95% CI, 1.994 to 3.777; p < 0.001 for OS) (S2 Fig., S3 Table).
Cox regression analyses for CSS (VIFs of all variables < 2) was performed again in patients who received treatment for CLL, and intensive treatments (fludarabine, cyclophosphamide±rituximab or bendamustine) was added as an independent variable. DM was found to be still significantly associated with unfavorable CSS in the complete cohort (HR, 2.717; 95% CI, 1.933 to 3.818; p < 0.001) and the PSM datasets (HR, 2.342; 95% CI, 1.476 to 3.716; p < 0.001) (S4 Table).
3. Analyses of prediabetes, diabetic duration and HbA1c in relation to CLL prognosis
Among the 633 CLL patients enrolled in our study, 111 cases (17.54%) were diagnosed as pre-existing DM, while the remaining 522 patients (82.46%) were categorized into two subgroups: 56 (8.85%) as pre-diabetics and 466 (73.62%) having no tendency towards diabetes. Both in the unmatched (Fig. 2A and B) and the PSM datasets (Fig. 2C and D), significant overall difference in TTFT and CSS was identified among the three subgroups, with all p-value around 0.001 (log-rank test across all three groups). Further survival analyses by pairwise over strata showed the comparison between every two specific subgroups for TTFT and CSS. In the unmatched dataset, pre-diabetic CLL patients were more likely to have an evidently poorer TTFT (p < 0.001) and CSS (p < 0.001) compared with those having no diabetic tendency, while only significance in CSS was detected between diabetics and pre-diabetics (p=0.024). However, after propensity score-matching, no significant difference in CSS was identified comparing pre-diabetics and those having no diabetic tendency (p=0.962) (S5 Table). These results might convey the idea that CLL patients with prediabetes should be given equal concern as those with diabetes, since they might share an undesirable survival outcome.

Prediabetes, diabetic duration, and hemoglobin A1c (HbA1c) level in relation to chronic lymphocytic leukemia survival before and after propensity matching. (A) Time-to-first-treatment (TTFT) stratified by different diabetic status of diabetes mellitus, pre-diabetes, and no diabetic tendency in unmatched (complete) dataset. (B) Cancer-specific survival (CSS) stratified by different diabetic status in unmatched (complete) dataset. (C) TTFT stratified by different diabetic status in propensity score-matched (PSM) (1:1) dataset. (D) CSS stratified by different diabetic status in PSM (1:1) dataset. (E) TTFT stratified by different diabetic duration in unmatched (complete) dataset. (F) CSS stratified by different diabetic duration in unmatched (complete) dataset. (G) TTFT stratified by different diabetic duration in PSM (1:1) dataset. (H) CSS stratified by different diabetic duration in PSM (1:1) dataset. (I) TTFT stratified by different HbA1c levels in unmatched (complete) dataset. (J) CSS stratified by different HbA1c levels in unmatched (complete) dataset. (K) TTFT stratified by different HbA1c levels in PSM (1:1) dataset. (L) CSS stratified by different HbA1c levels in PSM (1:1) dataset.
A subgroup analysis was also carried out for different diabetic duration in CLL patients with DM. Diabetic duration refers to the interval from the date of initial diagnosis of DM to the date of first CLL hospital admission. Eight patients whose FPG level ≥ 7.0 mmol/L at diagnosis of CLL were also defined as diabetics, and their disease duration was calculated as 0 month. We grouped all 111 diabetic patients into four categories by quartiles (Q1=25%, Q2=50%, Q3=75%) of diabetic duration: ≥ 120 months, ≥ 48 and < 120 months, ≥ 12 and < 48 months and < 12 months. Both in the complete (Fig. 2E and F) and the PSM datasets (Fig. 2G and H), an overall significance was only discovered for CSS (p < 0.001 for both unmatched and PSM datasets, log-rank test across all four groups), but not for TTFT (p=0.125 for unmatched dataset and p=0.363 for PSM dataset, log-rank test across all four groups). In the further pairwise prognostic comparison, we noticed that worse CSS went along with longer diabetic duration (S6 Table).
Due to the retrospective nature of this study, records of HbA1c were only found in 62 of the 111 total diabetic CLL patients. Diabetic patients with (62 cases) and without (49 cases) an HbA1c result had no significant difference in the distribution of clinical characteristics (all p > 0.05). Diabetic patients were subdivided into three groups according to their HbA1c levels: ≥ 8.0%, ≥ 6.5% and < 8.0%, < 6.5%. Pairwise comparisons by analyzing the complete (Fig. 2I and J) and the PSM datasets (Fig. 2K and L) both presented that adequate glycemic control was associated with longer CSS in diabetic CLL patients (S7 Table).
4. DM together with CLL-IPI: a better prognostic index for CLL
Given that in Table 3, DM was found to be an independent prognostic indicator for CSS in multivariate analyses alongside with other five parameters which are included in CLL-IPI, adding the criterion of DM to CLL-IPI might improve its predictive capacity. When evaluated for CSS, DM as one additional point to CLL-IPI demonstrated a statistically significantly larger AUC compared with CLL-IPI alone (p=0.009), while DM as two additional points exhibited no significance (p=0.062) in CSS prediction. Accordingly, a new prognostic index (DM-PI) can be generated by the sum of adding 1 point for DM to the original CLL-IPI (Fig. 3A and B).
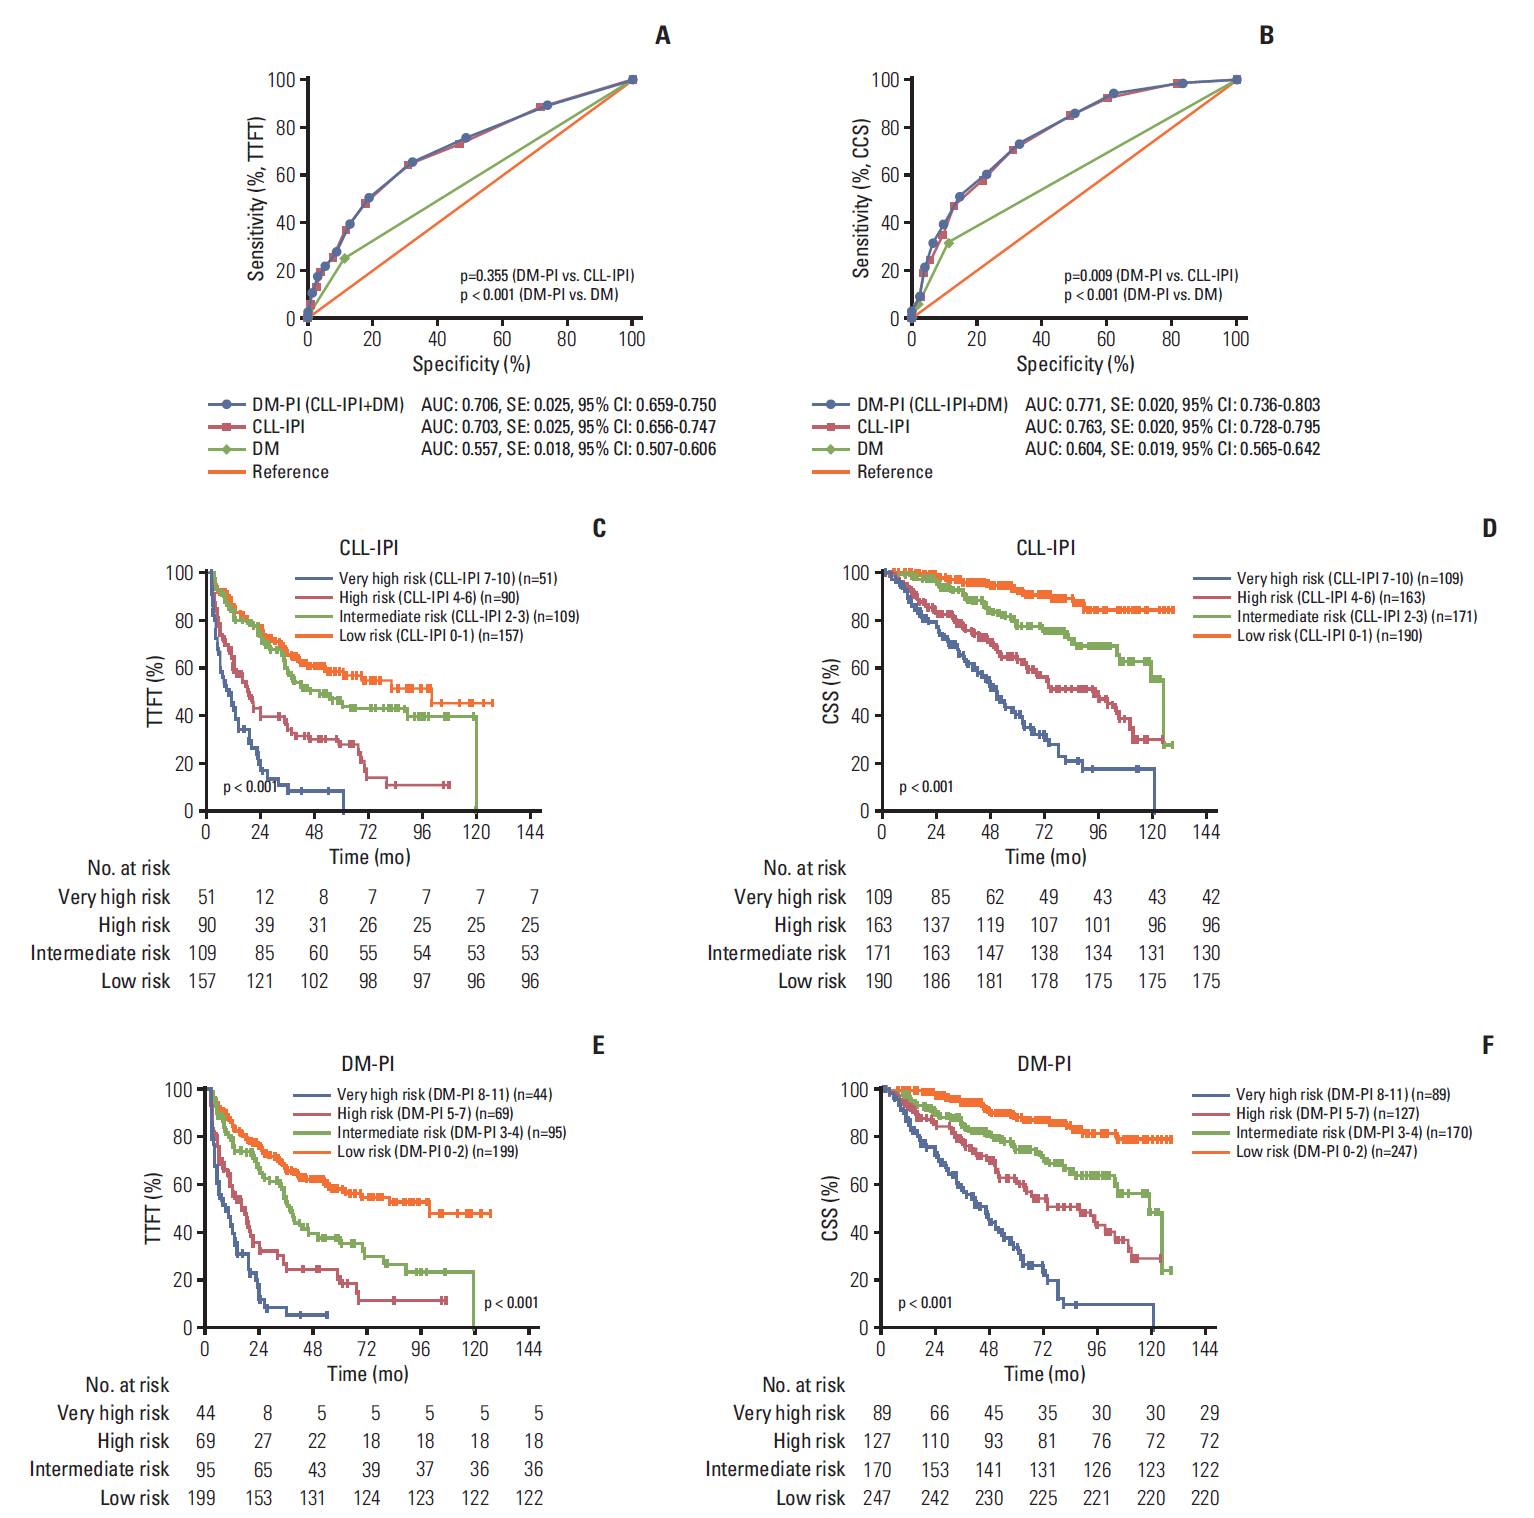
Diabetes mellitus (DM) together with chronic lymphocytic leukemia (CLL)–International Prognostic Index (IPI) is a better prognostic index for CLL. (A) The areas under the curve (AUC) comparison between prognostic index including diabetes mellitus (DM-PI), CLL-IPI and DM alone for time-to-first-treatment (TTFT) prediction. (B) The AUC comparison between DM-PI, CLL-IPI, and DM alone for cancer-specific survival (CSS) prediction. (C) Kaplan-Meier curves of TTFT for four different CLL-IPI risk grades. (D) Kaplan-Meier curves of CSS for four different CLL-IPI risk grades. AUC, area under the curve; SE, standard error; 95% CI, 95% confidence interval. (E) Kaplan-Meier curves of TTFT for four different DM-PI risk grades. (F) Kaplan-Meier curves of CSS for four different DM-PI risk grades.
To further validate and confirm the prognostic capacity of DM-PI, we split the entire cohort into four risk grades: low-risk group (DM-PI 0-2), intermediate-risk group (DM-PI 3-4), high-risk group (DM-PI 5-7), and very high-risk group (DM-PI 8-11). For comparison, we also divided the cohort into four risk groups based on the original CLL-IPI: low-risk group (CLL-IPI 0-1), intermediate-risk group (CLL-IPI 2-3), high-risk group (CLL-IPI 4-6), and very high-risk group (CLL-IPI 7-10). The TTFT and CSS differed significantly among all risk groups (p < 0.001, log-rank test across all four groups) (Fig. 3C-F). In pairwise comparison, a statistically evident difference for TTFT and CSS was found between every pair of subgroups categorized by DM-PI and patients with very high risk (DM-PI 8-11) had the worst survival outcome among all risk groups (S8 and S9 Tables). In addition, we compared the immediate and 3-year risk for TTFT, 3-year and 5-year risk for CSS in the CLL-IPI and DM-PI groups, and we found that DM-PI both widened the definition of low-risk and high-risk patients for 3-year and 5-year CSS, and maintained relative equivalent accuracy to the CLL-IPI in 3-year TTFT estimation (S10 Table). So as a conclusion, DM together with CLL-IPI can significantly differentiate each risk group from one another, and improve the risk stratification of CLL-IPI.
Discussion
To our knowledge, rarely has any studies to date investigated the association of pre-existing DM and CLL, and the possible etiology role of DM in CLL has not been fully elucidated. Our study is the first to discover the possible value of DM in CLL prognostication and presenting that adding the criterion of DM to CLL-IPI could improve the predictive accuracy of CLL prognostic model.
In the last decade, substantial epidemiological evidences indicated that some cancers developed more commonly in diabetic patients (predominantly T2DM), and the relative risk imparted by diabetes was greatest for liver and pancreatic cancer (nearly 2-fold or higher), while lesser for colorectal, gastric, breast and bladder cancer (1.2-1.5 fold) [18]. Possible biological links such as hyperinsulinemia, hyperglycemia, inflammatory cytokines over-secretion, insulin-like growth factor (IGF) over-production, and up-regulation of IGF-1 receptor might favor not only malignant transformation of cells but also progression of tumors. Obesity might be the underlying cause, as abdominal adiposity has been shown to play a role in creating a systemic pro-inflammatory environment, which could result in the development of both diabetes and cancer. As to lymphoproliferative diseases, the odds ratios for NHL, leukemia and myeloma were increased at 1.22 (95% CI, 1.07 to 1.39), 1.22 (95% CI, 1.03 to 1.44), and 1.22 (95% CI, 0.98 to 1.53) respectively as reported in a meta-analysis of observational studies [2]. In our study, the prevalence of pre-existing DM in newly-diagnosed CLL patients was 17.17%, which was evidently higher than the results (9.70%) from a Chinese nationwide study of diabetes, in which 46,239 nationally representative samples were participated [19].
Our findings suggested that pre-existing DM was associated with worse TTFT and CSS in CLL patients (p < 0.001 for both TTFT and CSS), and that it was an independent prognostic indicator for CSS (p < 0.001) in multivariate analyses. In consistent with our results on cancer prognosis, previous clinical research among Taiwanese population addressed that mutually adjusted HR for NHL mortality in diabetic patients was 1.028 (95% CI, 1.005 to 1.051; p=0.0168) [20]. Another case-control study also observed that NHL patients with a history of pre-existing DM had a poorer survival after approximately one year of follow-up and had an approximately 20-fold risk for death compared with those without DM after 4 years of follow-up [21]. Regarding other specific cancer types, evidence was provided that pre-existing diabetes was also correlated with worse disease-free survival and OS in lung (HR, 1.27; 95% CI, 1.07 to 1.50), prostate (HR, 1.56; 95% CI, 1.03 to 2.36), and colorectal cancer (HR, 1.17; 95% CI, 1.09 to 1.25). In consensus with our results on diabetic duration and severity, two studies demonstrated a positive association between duration of diabetes and increased risk of NHL [22,23].
With respect to T1DM and childhood leukemia, previous studies have shown significant correlations in incidence and similarities in epidemiology between AML, ALL, and T1DM both across international and regional areas. The plausible explanation for the observed comorbidity could be shared infectious etiology, growth-promotion effects of insulin therapy and T1DM related metabolic disturbances. Genetic susceptibility to T1DM and ALL regulated by distinct genes was also proven to be a contributing factor. One of the single nucleotide polymorphisms (rs10272724) near the IKZF1 gene, which has been implicated in the development of childhood ALL, was found to be protective against T1DM in a large population of patients of European ancestry [24]. However, to our knowledge, the potential etiology role of DM in CLL development has not been investigated and it is difficult to tease out a possible causal sequence between DM and CLL. It is postulated that these two diseases might share common pathways in the early stage of developments via immune dysregulation and cytokine activity, or share risk factors including obesity, diet, genetic susceptibility, and environmental exposures. For immune dysregulation, CLL patients have been shown to develop autoimmune disorders possibly mediated through excessive activation of B cells [25]. Regulatory T-cells dysregulation was also found to play a fundamental role in protecting CLL cells from being killed by the immune system [26]. In patients with T2DM, Pietropaolo et al. [27] demonstrated that the presence of islet cell autoimmunity was associated with an impairment of the acutephase insulin secretion. As to cytokine activity, circulating levels of interleukin-6 and tumor necrosis factor-α activated by excess fat were raised in insulin-resistant states, such as T2DM and obesity [28]. These inflammatory factors and cytokines also promoted normal plasma cell development and proliferation of myeloma cells in culture and were reported to be related to poor prognosis of CLL in clinical studies [29,30].
In the current clinical practice of CLL, little attention was paid to controlling the progression of comorbid DM and its complication. The implications of our study are (1) concerns should be given to patients with diabetes or prediabetes at first diagnosis of CLL to help predict life expectancy; (2) blood glucose level should be routinely monitored for diabetic patients. Because hyperglycemia could cause prednisolone dosing attenuated, it should be actively controlled using effective antidiabetic agents.
The limitations of our study were illustrated as follow: the restriction within one institution; inability to account for unmeasured confounders despite using PSM analyses (e.g., different types of treatment for CLL, or different types of diabetes-related lifestyle); the retrospective nature of this study with incomplete data on HbA1c. Owing to that the informed consent was not only restricted to this study and the research design was not established before the patients’ enrollment, we still consider our study to be a retrospective one.
We concluded that pre-existing DM was correlated with worse TTFT and CSS in CLL patients and that it was an independent prognostic factor for both TTFT and CSS in PSM cohort. Pre-diabetics also shared undesirable survival outcomes (TTFT and CSS) compared with patients with no diabetic tendency, and a positive association between longer diabetic duration and poorer prognosis of CLL was identified. We also noticed that DM together with CLL-IPI (DM-PI) had a statistically significantly larger AUC compared with CLL-IPI alone in CSS prediction, and can improve the risk stratification of CLL-IPI. Although statistically significant, the inclusion of DM only resulted in minor improvement. To interpret our results more cautiously, DM-PI was not intended to replace CLL-IPI in clinical practice, but only to indicate that diabetes should be well-assessed and managed in CLL patient care. Due to the retrospective nature and lack of validation cohort, our results remain to be replicated and confirmed in epidemiologic studies with larger samples, longer follow-up periods and full adjustments for covariates to test the proposed prognostic score.
Electronic Supplementary Material
Supplementary materials are available at Cancer Research and Treatment website (https://www.e-crt.org).
Flow chart of the study population. CLL, chronic lymphocytic leukemia; HIV, human immunodeficiency virus; TTFT, time-to-first-treatment; CSS, cancer-specific survival.
Kaplan-Meier curves of time-to-first-treatment (TTFT) and overall survival (OS) (all-cause mortality) stratified by diabetic status.
Univariate and multivariate Cox regression analyses of CSS in treated patients including chemotherapy received before and after propensity matching
Pairwise comparisons among different diabetic status for TTFT and CSS before and after propensity matching
Notes
Conflict of interest relevant to this article was not reported.
Acknowledgements
We are grateful to all the study participants, patients and their family members for their contributions and supports.
This study was supported by National Natural Science Foundation of China (81370657, 81470328, 81600130, 81770166, 81720108-002), Jiangsu Province’s Medical Elite Programme (ZDRCA2016-022), Project of National Key Clinical Specialty, National Science & Technology Pillar Program (2014BAI09B12), Jiangsu Provincial Special Program of Medical Science (BL2014086 and BE2017751) and National Science and Technology Major Project (2017ZX09304032).