Negative Conversion of Progesterone Receptor Status after Primary Systemic Therapy Is Associated with Poor Clinical Outcome in Patients with Breast Cancer
Article information
Abstract
Purpose
Alteration of biomarker status after primary systemic therapy (PST) is occasionally found in breast cancer. This study was conducted to clarify the clinical implications of change of biomarker status in breast cancer patients treated with PST.
Materials and Methods
The pre-chemotherapeutic biopsy and post-chemotherapeutic resection specimens of 442 breast cancer patients who had residual disease after PST were included in this study. The association between changes of biomarker status after PST and clinicopathologic features of tumors, and survival of the patients, were analyzed.
Results
Estrogen receptor (ER), progesterone receptor (PR), and human epidermal growth factor receptor 2 (HER2) status changed after PST in 18 (4.1%), 80 (18.1%), and 15 (3.4%) patients,respectively. ER and PR mainly underwent positive to negative conversion,whereas HER2 status underwent negative to positive conversion. Negative conversion of ER and PR status after PST was associated with reduced disease-free survival. Moreover, a decline in the Allred score for PR in post-PST specimens was significantly associated with poor clinical outcome of the patients. HER2 change did not have prognostic significance. In multivariate analyses, negative PR status after PST was found to be an independent adverse prognostic factor in the whole patient group, in the adjuvant endocrine therapy-treated subgroup, and also in pre-PST PR positive subgroup.
Conclusion
ER and HER2 status changed little after PST, whereas PR status changed significantly. In particular, negative conversion of PR status was revealed as a poor prognostic indicator, suggesting that re-evaluation of basic biomarkers is mandatory in breast cancer after PST for proper management and prognostication of patients.
Introduction
Primary systemic therapy (PST), also referred to as neoadjuvant chemotherapy, is currently considered the standard treatment for locally advanced breast cancer. It is increasingly being used to downgrade tumors and facilitate conservative surgery for operable breast cancers [1]. A core needle biopsy is performed to establish the diagnosis of breast cancer, and biomarker (estrogen receptor [ER], progesterone receptor [PR], human epidermal growth factor receptor 2 [HER2], and Ki-67) status is evaluated on biopsy specimens prior to PST. Currently, there are no established guidelines regarding re-evaluation of biomarkers on post-chemotherapeutic specimens [2,3]. However, biomarker status is occasionally altered after PST, and therefore re-analysis of biomarker expression in post-chemotherapeutic surgical specimens is recommended.
The frequency of biomarker alterations after PST varied from 5% [4] to 46% [5] between studies, and hormone receptor (ER and PR) status changed more often than HER2 status [6-8]. Also positive to negative conversion was more common than negative to positive conversion in the case of hormone receptors [9-11]. Although biomarker alteration after PST has received much attention and was reported in several series, its variable frequency is confusing. In addition, there is a lack of information on the clinicopathologic factors associated with biomarker alteration in breast cancer [6,12].
Alteration of biomarker status may have a clinical impact on the treatment of patients following PST. For example, identification of a switch of a hormone receptor status may influence the planning of adjuvant endocrine therapy. Regarding its impact on clinical outcome, some studies have reported that alteration of hormone receptor status after PST is an unfavourable prognostic factor [6,9,10,13,14], but its prognostic significance remains unclear. In this study, we evaluated pre-PST and post-PST biomarker status using a relatively large series of 442 breast cancer patients and analysed the association between biomarker alteration after PST and clinicopathologic features. We also evaluated the prognostic significance of biomarker alteration in breast cancer.
Materials and Methods
1. Patients and samples
We collected data on 571 patients with primary breast cancer who underwent breast-conserving surgery or mastectomy after PST in Seoul National University Bundang Hospital from October 2004 to December 2015. Breast cancer patients with metastases at presentation were excluded. A pathologic complete response (pCR) was defined as the complete disappearance of all invasive tumor cells from breast tissue regardless of the presence of residual ductal carcinoma in situ in the breast. Of the 571 patients, 129 (22.6%) achieved pCR. Finally, the 442 patients with residual tumors after PST were included in this study.
Of the 442 patients, 126 (28.5%) were treated with the doxorubicin plus cyclophosphamide (AC) regimen consisting of 60 mg/m2 doxorubicin intravenously on day 1 and 600 mg/m2 cyclophophamide intravenously once every 3 weeks for four cycles. A further 205 (46.4%) received sequential AC followed by docetaxel (AC-T) comprising four cycles of AC followed by four cycles of 75 mg/m2 docetaxel, and 32 (7.2%) received sequential AC followed by docetaxel and trastuzumab (AC-TH) comprising four cycles of AC followed by four cycles of 75 mg/m2 docetaxel and trastuzumab. Sixty patients (13.6%) received the doxorubicin plus docetaxel (AD) regimen consisting of 50 mg/m2 doxorubicin intravenously on day 1 and 75 mg/m2 docetaxel intravenously once every 3 weeks for three to six cycles, and the remaining 19 patients (4.3%) were treated by a variety of other regimens. The patients underwent breast surgery about 3-4 weeks after the last chemotherapy cycle. The other clinicopathologic variables are summarized in Table 1.
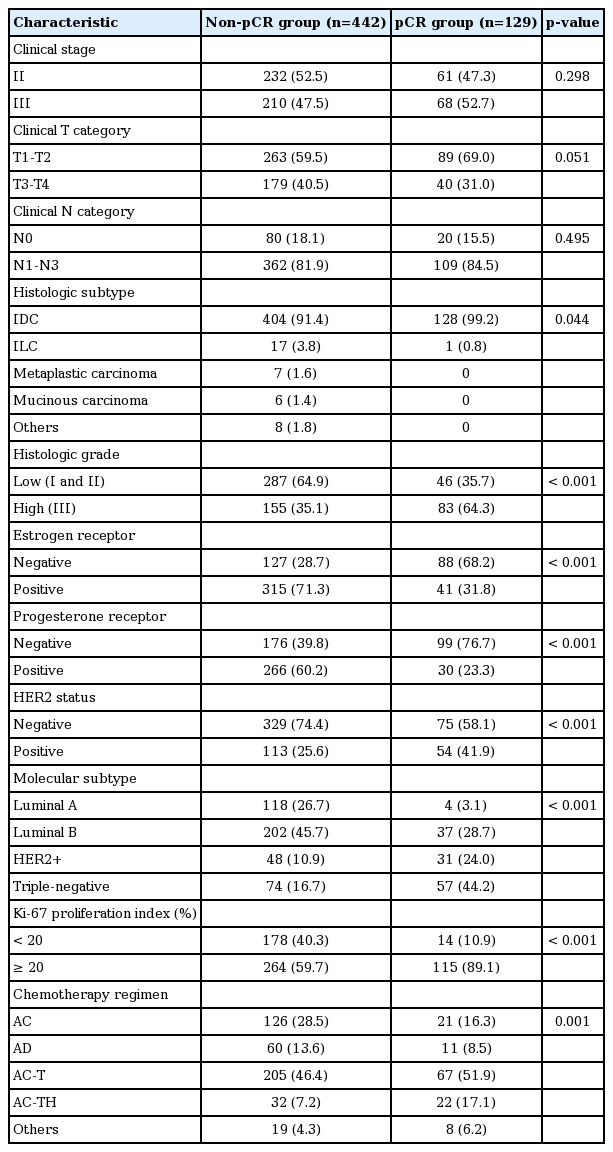
Clinicopathologic characteristics of the patients before primary systemic therapy
Pre-chemotherapeutic biopsy samples were obtained before PST by core needle biopsy, and led to a diagnosis of invasive carcinoma of the breast. A pair of formalin-fixed and paraffin-embedded tumor samples consisting of a prechemotherapy biopsy and post-chemotherapy resection specimen, were collected for each patient. Medical records and hematoxylin and eosin‒stained sections were reviewed to acquire clinicopathologic information, including age, sex, initial clinical T and N category, chemotherapeutic regimen, cycle of PST, pathologic T and N category after PST, histologic subtype, histologic grade, and lymphovascular invasion. The pathologic response to PST was evaluated with the Miller-Payne regression grading [15] and residual cancer burden (RCB) systems [16].
2. Immunohistochemical analyses and scoring
Immunohistochemical staining results for standard biomarkers including ER, PR, HER2, p53, and Ki-67 were searched during the study to identify any data missing from the pre-chemotherapeutic biopsy and post-chemotherapeutic resection specimens. In cases with missing data, immunohistochemical staining on representative tissue sections was carried out in a BenchMark XT autostainer (Ventana Medical Systems, Tucson, AZ) using an UltraView detection kit (Ventana Medical Systems). The following antibodies were used: ER (1:100, clone SP1, Labvision, Fremont, CA), PR (1:70, PgR636, Dako, Carpinteria, CA), HER2 (ready to use, clone 4B5, Ventana Medical Systems), p53 (1:600, D07, Dako), and Ki-67 (1:250, MIB-1, Dako).
For each case, immunohistochemical slides for basic biomarkers were reviewed to acquire information about biomarker expression. ER and PR were regarded as positive if there were at least 1% positive tumor nuclei. ER and PR were also scored using the Allred scoring system [17]. HER2 expression was scored according to 2013 American Society of Clinical Oncology/College of American Pathologists (ASCO/CAP) guidelines [18]. For p53, cases with 10% or more positive staining were grouped as positive. For the Ki-67 proliferation index, cases with 20% or more positive tumor cells were regarded as having high indices.
3. Determination of HER2 status
HER2 status had been determined by HER2 fluorescence in situ hybridization or silver in situ hybridization (SISH) for cases that were equivocal by HER2 immunohistochemistry. In cases whose HER2 status was not determined, HER2 SISH assays were performed with INFORM HER2 DNA and chromosome 17 probes (Ventana Medical Systems) using an ultraView SISH Detection Kit (Ventana Medical Systems) as previously described [19]. At least 50 cells were evaluated for each case and HER2 status was determined according to the updated 2013 ASCO/CAP guidelines [18]. A HER2 copy number of 6.0 or higher per cell, or a HER2:CEP17 ratio of 2 or higher was defined as amplified. Cases with HER2/CEP17 ratios < 2 and HER2 copy numbers of 4 to 6 signals per cell were considered equivocal. HER2 copy numbers of < 4 signals per cell and HER2/CEP17 ratios < 2 were defined as non-amplified. In this study, HER2-equivocal cases were regarded as HER2–non-amplified for statistical analysis.
4. Definition of breast cancer subtypes
Immunohistochemical expression of the standard biomarkers was used to categorize the tumor samples into breast cancer subtypes according to the 2011 St. Gallen Expert Consensus [20] as follows: luminal A (ER+ and/or PR+, HER2–, Ki-67 < 14%), luminal B (ER+ and/or PR+, HER2–, Ki-67 ≥ 14%; ER+ and/or PR+, HER2+), HER2+ (ER–, PR–, HER2+), and triple-negative subtype (ER–, PR–, HER2–).
5. Statistical analysis
Statistical significance was assessed using Statistical Package, SPSS ver. 15.0 for Windows (SPSS Inc., Chicago, IL). Pearson’s chi-square test or Fisher's exact test was used to compare frequencies between pairs of groups. Comparison of continuous variables between matched pre-chemotherapeutic and post-chemotherapeutic specimens was performed by paired sample t-tests. Survival curves were estimated by the Kaplan-Meier method, and the significance of differences was assessed using the log-rank test. For multivariate analysis, the Cox proportional hazards regression model was used with backward stepwise selection, with covariates that were significantly associated with patient outcome in the univariate analyses. Hazard ratios and their 95% confidence intervals were calculated for each variable. p-values less than 0.05 were considered statistically significant, and all reported p-values were two-sided.
6. Ethical statement
This study was approved by an Institutional Review Board of Seoul National University Bundang Hospital (Protocol # B-1601/332-304), and informed consent was waived.
Results
1. Clinicopathologic characteristics of the patients
The 442 patients included in this study, that is the non-pCR group, had low histologic grade (p < 0.001), ER positivity (p < 0.001), PR positivity (p < 0.001), HER2 negativity (p < 0.001), and a low Ki-67 proliferation index (p < 0.001) more frequently, compared to the pCR group (Table 1). ER, PR, and HER2 positivity were found in 71.3%, 60.2%, and 25.6%, respectively of the non-pCR group. As for breast cancer subtype, the luminal A and luminal B subtypes were more frequent in the non-pCR group than the pCR group. Clinical T category tended to be higher in the non-pCR group (p=0.051).
2. Biomarker alteration after PST
In a paired analysis of 442 pre-and post-PST samples, ER and PR expression generally decreased after PST (Table 2). There was a more substantial decrease in PR positivity (mean, 34.44% to 17.76%) and Allred score of PR (mean, 4.13 to 2.96) than in ER positivity (mean of positivity, 61.24% to 58.43%; mean of Allred score, 5.52 to 5.38). HER2 expression level increased slightly (mean, 1.41 to 1.55) and Ki-67 index decreased markedly (mean, 25.85% to 15.70%).

Paired analyses of biomarker expression levels before and after primary systemic therapy
After PST, ER, PR, and HER2 status was altered in 18 (4.1%), 80 (18.1%), and 15 (3.4%) patients, respectively (Table 3, Fig. 1). Of the 18 patients with ER changes, 10 underwent positive to negative conversion, and six of them had ER expression levels of < 5% in the pre-PST samples. Of the eight patients with ER negative to positive conversion, five also had low ER expression levels (< 5%) in post-PST samples. Of the 80 patients with PR status changes, 65 underwent positive to negative conversion. Of the 15 patients who underwent negative to positive conversion, 11 had low PR expression levels (< 5%) in post-PST samples. Overall, hormone receptor status changed in 22 patients (5.0%), with 13 positive to negative conversions and nine negative to positive conversions. While HER2 positive to negative conversion was observed in four (0.9%) of the total patients, HER2 negative to positive conversion was observed in 11 (2.5%).
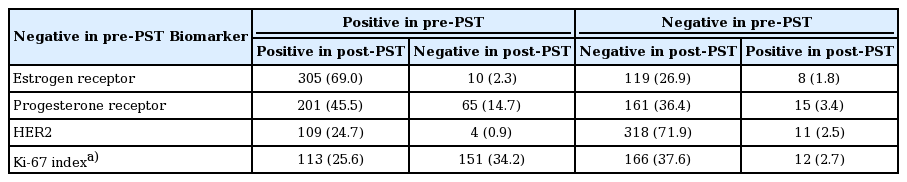
Biomarker changes after primary systemic therapy (n=442)
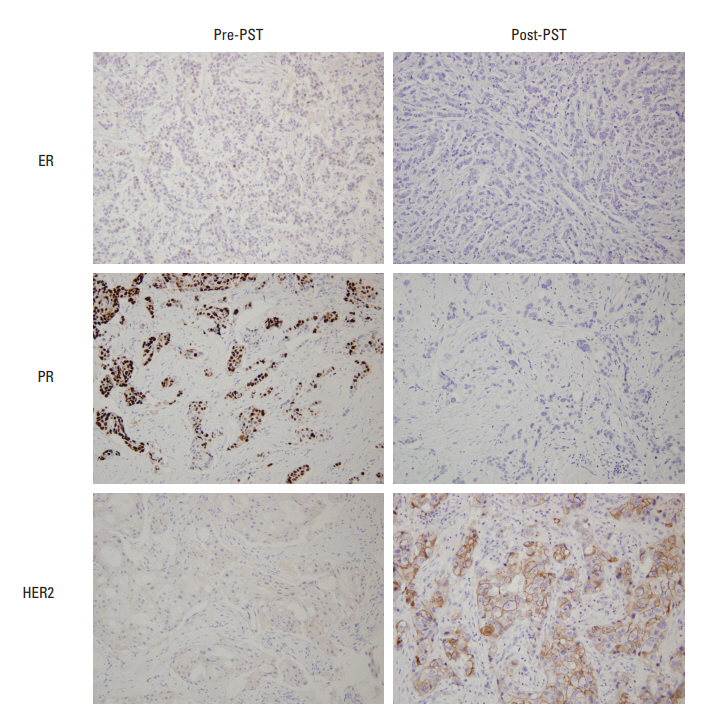
Representative examples of biomarker alteration after primary systemic therapy. Estrogen receptor (ER) and progesterone receptor (PR) show negative conversion, and the immunohistochemical score for human epidermal growth factor receptor 2 (HER2) is altered from 1+ to 3+ after primary systemic therapy (PST).
Table 4 presents the biomarker alterations according to pre-PST molecular subtype. All of the 10 cases with ER positive to negative conversion were of luminal B subtype, and none belonged to luminal A subtype (p=0.015). In terms of Ki-67 proliferation index, six cases (3.0%) of luminal B subtype changed from low index to a high one after PST, and the frequency of this change was significantly higher than in the luminal A subtype (0.8%) (p=0.002). The decrease of Ki-67 proliferation index after PST were more prominent in the luminal B subtype than in the HER2+ (p < 0.001) and triple-negative (p < 0.001) subtypes. As a whole, the luminal B subtype underwent the most alterations after PST.
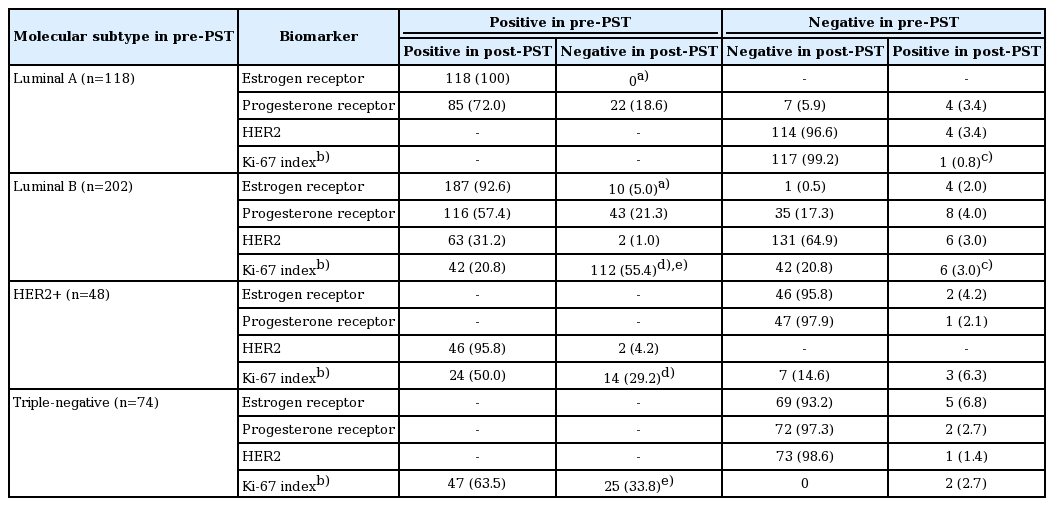
Biomarker changes after primary systemic therapy according to molecular subtype
3. Clinicopathological characteristics of tumors showing biomarker alteration after PST
Table 5 summarizes the clinicopathological characteristics of the tumors with biomarker changes after PST. ER conversion was more frequent in tumors of high histologic grade (p=0.018), PR negativity (p < 0.001), high Ki-67 index (p=0.010), and p53 overexpression (p < 0.001) before PST. ER conversion was also associated with low ypT stage (p=0.014), PR negativity (p=0.001), and high Ki-67 index (p=0.002) after PST. On the other hand, PR conversion was more frequent in tumors with pre-PST low to intermediate histologic grade (p=0.001), ER positivity (p < 0.001), and PR positivity (p < 0.001). Among the post-PST factors, PR conversion was associated with high ypT stage (p=0.043), ER positivity (p < 0.001), and low Ki-67 index (p=0.008).
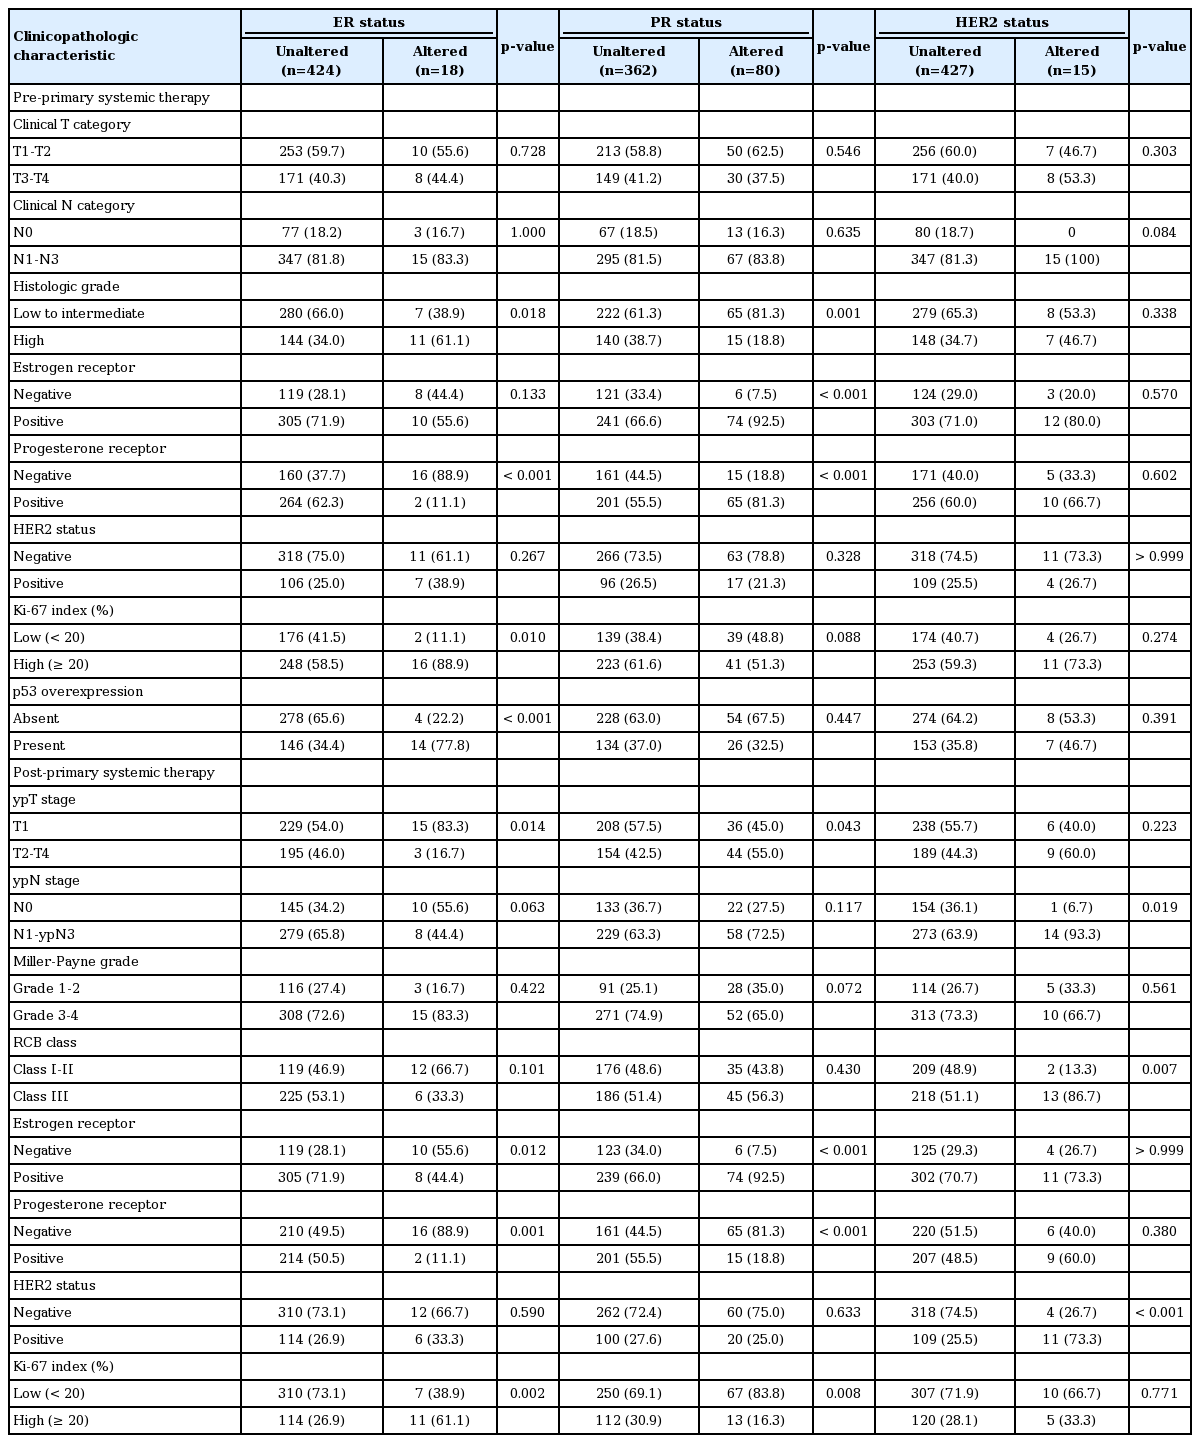
Clinicopathologic characteristics of tumors associated with biomarker changes after primary systemic therapy
ER and PR changes after PST were predominantly from positive to negative (p=0.012, ER; p < 0.001, PR). Cases with HER2 conversion had a higher frequency of lymph node metastasis (p=0.019), and higher RCB class (p=0.007). HER2 changed more frequently from negative to positive (p < 0.001).
4. Prognostic significance of biomarker alteration after PST
Most of the patients received the standard treatment and regular follow-up. Three hundred and eighty-seven patients (87.6%) were treated by radiation therapy, and 316 (71.5%) received adjuvant endocrine therapy. The median follow-up period was 41 months (range, 1 to 142 months). Kaplan-Meier plots for disease-free survival according to biomarker status alteration are shown in Fig. 2. Positive to negative conversion of ER and PR status after PST was associated with decreased disease-free survival of the patients compared to persistent positive tumors (p=0.038 and p=0.017, respectively). There was no prognostic significance of negative to positive conversion of ER and PR in comparison with tumors with persistent negative status. However, compared to persistent PR-positive group, negative to positive conversion of PR was associated with poor disease-free survival (p=0.004) (Fig. 3). HER2 alteration had no prognostic significance. High Ki-67 index after PST was associated with decreased diseasefree survival regardless of pre-PST Ki-67 index. We also evaluated prognostic significance according to changes of Allred scores of ER and PR after PST in the pre-PST ER or PR positive groups. Interestingly, the decrease of Allred score of PR in post-PST samples was significantly associated with poor disease-free survival (p=0.006) (Fig. 4).
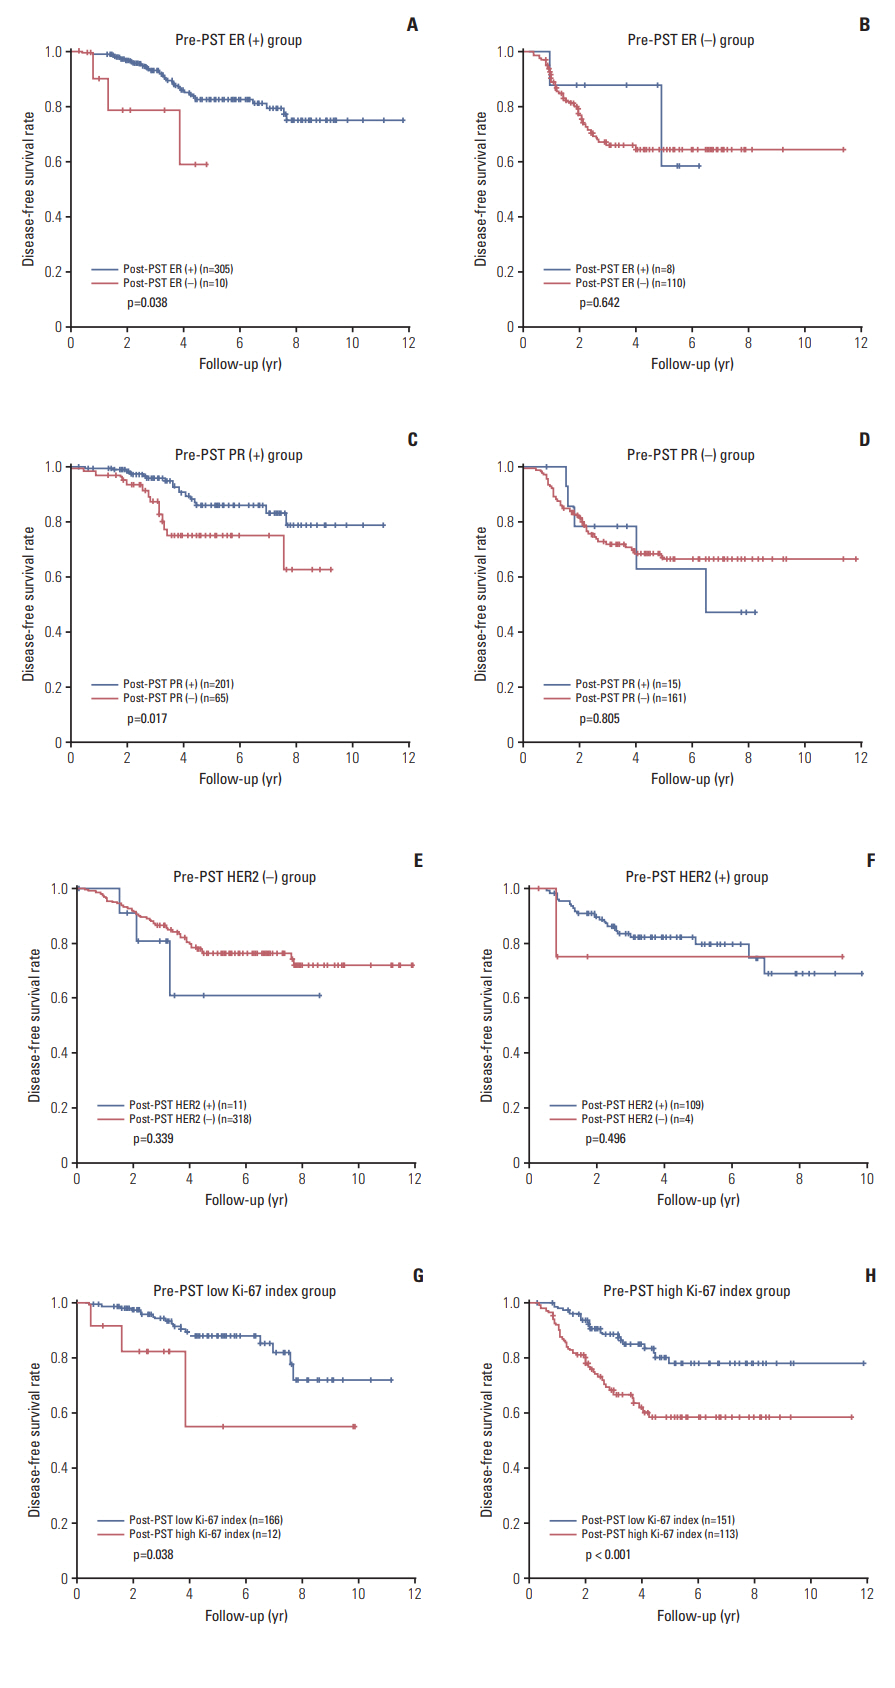
Survival analyses according to biomarker alteration after primary systemic therapy. Negative conversion of estrogen receptor (ER) (A) and progesterone receptor (PR) (C) status after primary systemic therapy (PST) are associated with decreased disease-free survival. However, positive conversion of ER (B) or PR (D) in receptor-negative cases has no prognostic significance. (E, F) Alteration of human epidermal growth factor receptor 2 (HER2) status after PST is not related to the survival of patients. (G, H) High Ki-67 index in post-PST samples is associated with poor diseasefree survival, irrespective of pre-PST Ki-67 status.
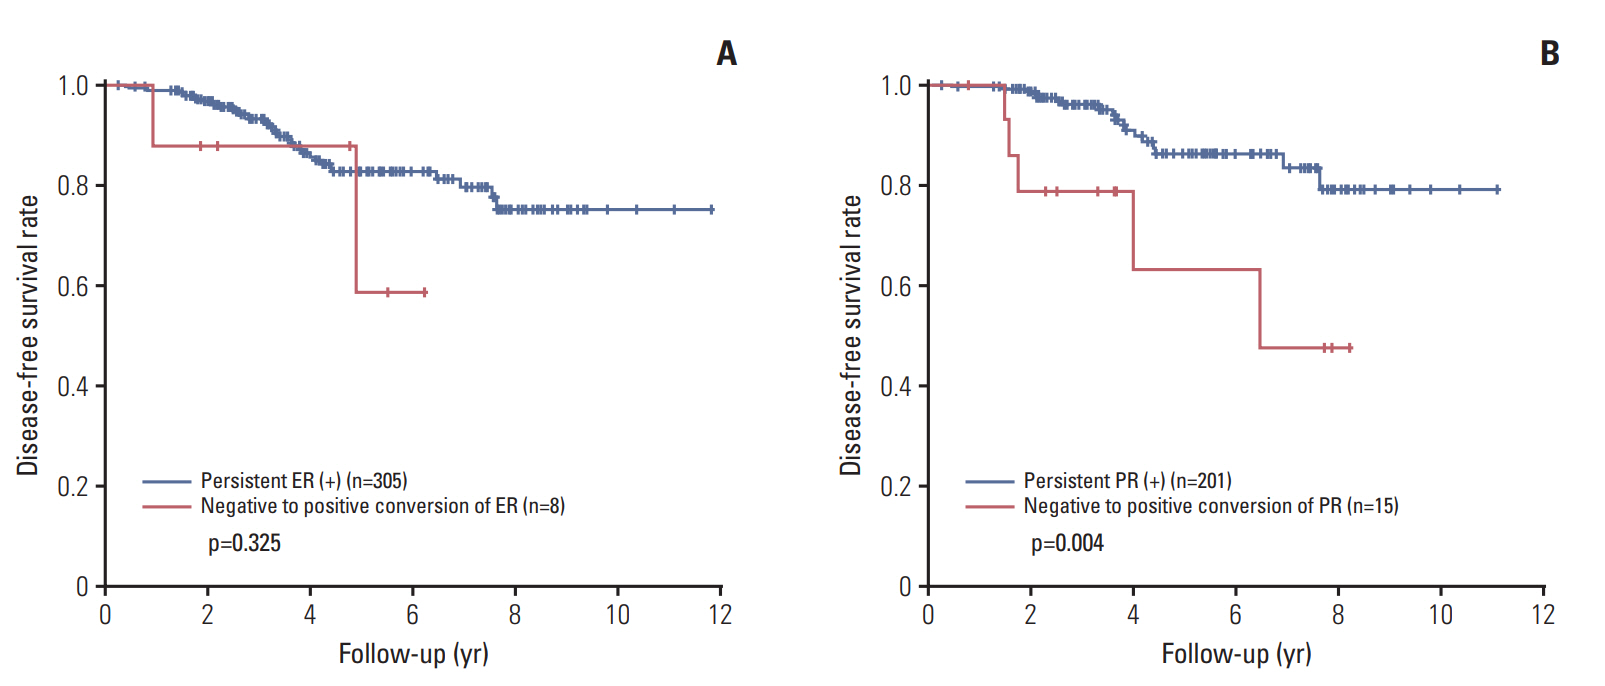
Survival analyses between the tumors showing negative to positive conversion of hormone receptor status and persistent receptor-positive tumors after primary systemic therapy. (A) Negative to positive conversion of estrogen receptor (ER) shows no prognostic significance. (B) However, negative to positive conversion of progesterone receptor (PR) is associated with decreased disease-free survival compared to persistent PR-positive group.
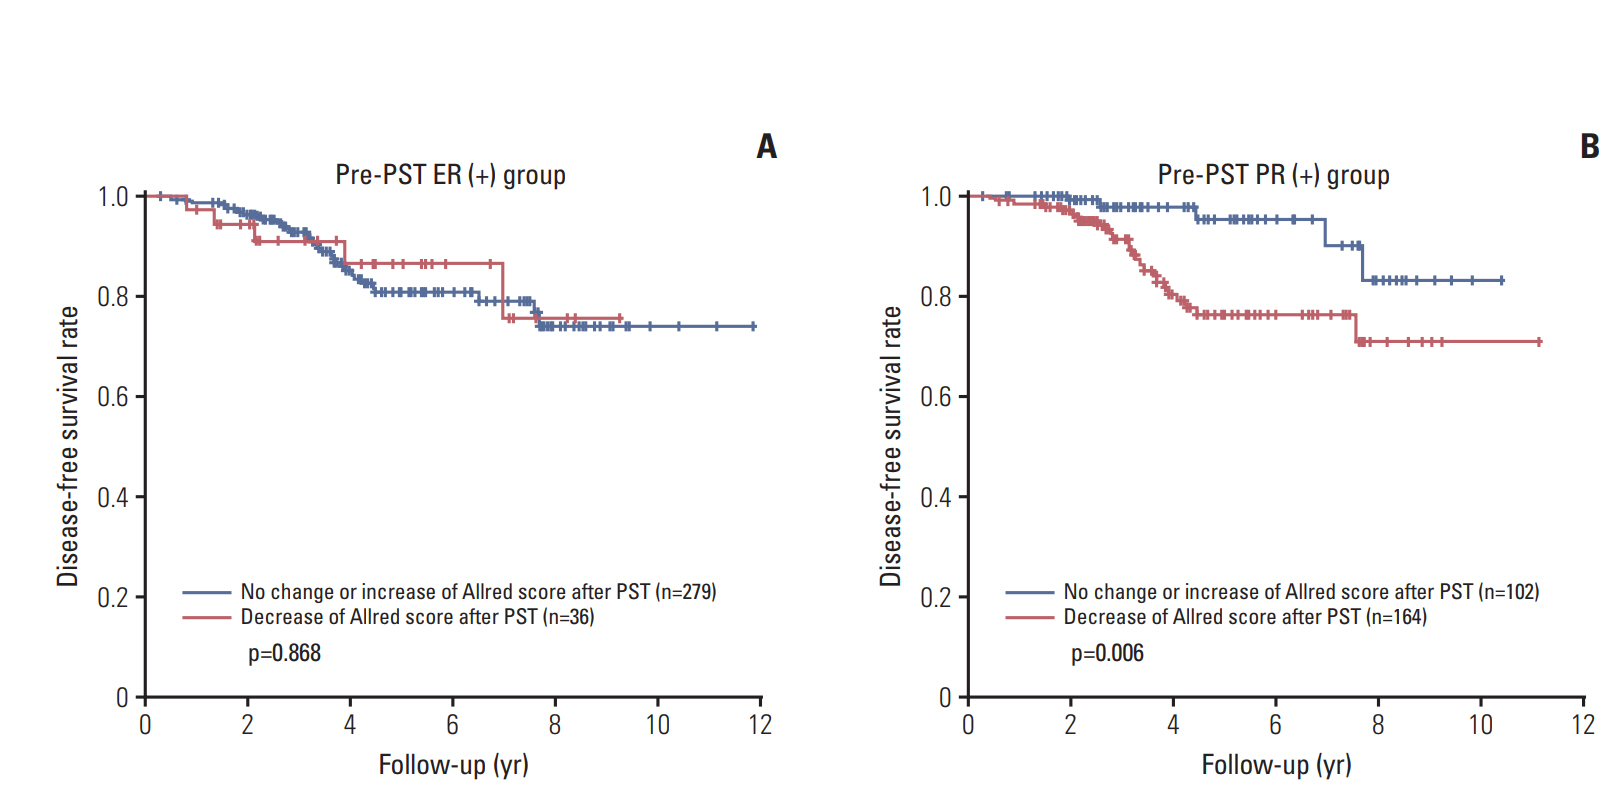
Survival analyses according to changes of Allred score after primary systemic therapy. (A) Change of the Allred score for estrogen receptor (ER) after primary systemic therapy (PST) in the pre-PST ER-positive group has no prognostic significance. (B) Decreased Allred score for progesterone receptor (PR) after PST is associated with poor disease-free survival in the pre-PST PR-positive group.
Univariate and multivariate analyses of disease-free survival in the whole patient group, the pre-PST ER-positive group, the group receiving adjuvant endocrine therapy, and the pre-PST PR positive group are summarized in Table 6. In multivariate analyses of the whole group, ypT category (p=0.003), ypN category (p=0.001), Miller-Payne regression grade (p=0.020), post-PST ER status (p=0.025), and post-PST PR status (p=0.028) were independent prognostic factors. Post-PST ER status was not found to be an independent prognostic factor in the pre-PST ER-positive group, but ypT stage (p=0.047), post-PST PR status (p=0.031) and post-PST Ki-67 index (p=0.002) were independent prognostic factors. Negative PR status after PST was also an independent adverse prognostic factor in multivariate analyses of the group receiving adjuvant endocrine therapy (p=0.012), together with high ypT stage (p=0.028), high ypN stage (p=0.019), and post-PST high Ki-67 index (p=0.001). In the pre-PST PR positive subgroup, post-PST PR negative status (p=0.008) and high Ki-67 index (p=0.034) were independent poor prognostic factors.
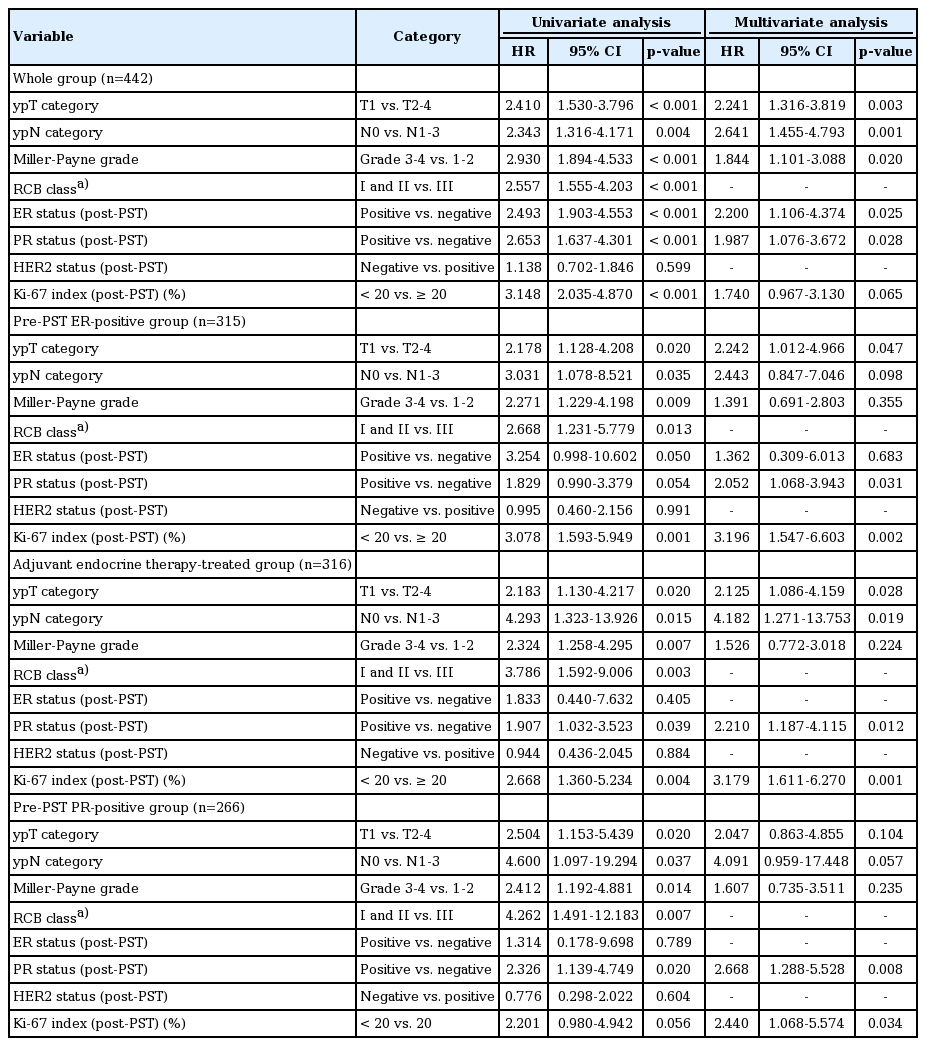
Univariate and multivariate analyses of disease-free survival
Discussion
The frequency of biomarker alterations after PST in breast cancer has varied widely between report [7,21]. This variability raises the clinical question whether repeat tests on samples after chemotherapy need to be routinely performed. In addition, there is a relative lack of data about the prognostic value of biomarker alterations in breast cancer. We showed in the present work that PR status changes frequently after PST, and negative conversion of PR status is a poor prognostic indicator.
In the present study, alterations of ER, PR, and HER2 status were observed in 4.1%, 18.1%, and 3.4% of the total cases, respectively. PR status changed more often than that of ER and HER2, which is consistent with previous reports [12,21-23]. The frequency of positive to negative conversion was higher than negative to positive. It is notable that alterations of biomarkers were more frequent in the luminal B subtype than in the luminal A, HER2+ and triple-negative subtypes. Zhou et al. [22] also showed that the luminal B and luminal–HER2 subtypes underwent biomarker alterations after PST more frequently than the other subtypes, although the differences were not statistically significant except for the Ki-67 index [22]. Recently, Xian et al. [23] reported that the triplenegative subtype usually remained triple-negative after PST, and PR was the most frequently altered biomarker. Currently, there are no guidelines about whether treatment should be modified based on altered biomarker status after PST. However, patients with hormone receptor conversion that received endocrine therapy were shown to have significantly better disease-free or overall survival than those with conversion without endocrine therapy [9,24]. In our study, most cases with negative to positive conversion of hormone receptor status had low receptor expression levels (< 5%), and there was no difference in survival according to adjuvant endocrine therapy among those patients (data not shown). Further investigation of treatment modification according to altered biomarker status, including patients with low levels of hormone receptor expression, are warranted.
The clinicopathologic features associated with ER, PR, and HER2 conversion differed. While ER conversion was more frequently found in cases of high histologic grade and high Ki-67 index before PST, PR conversion occurred more frequently in cases with pre-PST lower histologic grade and post-PST low Ki-67 index. It has been reported that PR status changed quite often in carcinomas that were grade 1-2 before PST, whereas changes of ER status were unrelated to histologic grade before PST [12]. Others have reported that large tumor size and lymph node metastasis are associated with biomarker alterations [22]. Thus the clinicopathologic factors associated with biomarker alteration after PST differ between reports and the situation is still unclear. Further large-scale studies are needed.
Several studies have focused on the prognostic value of biomarker alterations after PST in breast cancer, and the results are controversial. As for positive conversion of hormone receptor status, Tacca et al. [13] reported that positive conversion of hormone receptor status was correlated with favorable clinical outcome. Hirata et al. [9] showed that patients with ER negative to positive conversion after PST had a poorer prognosis. However, in our study, positive conversion of hormone receptor status did not have prognostic significance. At the same time, there are recent reports that negative conversion of hormone receptor status, especially loss of PR positivity, predicts poorer disease-free survival [6,8,10,14], which is concordant with our findings. We also showed that reduced PR Allred score was associated with an unfavorable prognosis. Finally, negative PR status itself after PST was an independent prognostic factor in the whole patient group, the pre-PST ER positive group, the adjuvant endocrine therapy-treated group, and the pre-PST PR positive group. Accordingly, we recommend re-evaluation of basic biomarkers in breast cancer after PST not only for proper management, but also for better prognostication of patients. Regarding HER2, alteration of its status did not have prognostic significance in our study. This is in contrast to a previous report that patients with tumors undergoing negative HER2 conversion following treatment had significantly reduced disease-free survival [11,25].
The causes of biomarker alteration following PST remain unclear. They can be partly understood in terms of well-documented cancer biology, including intra-tumoral heterogeneity and the general instability of tumor biomarkers [21,22]. ER+/PR‒ tumors are known to have aggressive behavior and tamoxifen resistance despite ER positivity [26,27]. In terms of biomarker alteration during tumor progression, metastatic ER+/PR– tumors follow a worse clinical course after loss of PR [26,28]. The mechanism of PR loss in breast cancers has not been fully elucidated, but involves complex mechanisms including low serum ER, hypermethylation of the PR promoter, loss of DNA at the PR locus, growth factor signaling of the PR, and altered ER co-regulator activity [26]. However, it is unclear which mechanism is particularly associated with the PR loss related to PST. It has been suggested that decreased PR expression is associated with increased growth factor signaling, and that this contributes to the aggressiveness of ER+/PR‒ tumors [26,27].
Factors related to data collection and analysis could also affect differences between pre- and post-PST biomarker status [11,21]. In the current study, all the cases were collected from a single institution, the same immunohistochemistry methods were used, and the same criteria for interpretation were applied. Therefore, the effects of such technical factors should be minimal. In general, the concordance between biomarker expression in core needle biopsies and excised specimens is excellent [21,29]: in a different cohort in our institution it was 99% for ER and 97.1% for PR [30]. The frequency of biomarker alterations after PST was higher than the frequency of discrepancies between biopsy and excision specimens in our institution, indicating that biomarker alteration after PST is related to tumor biology itself rather than preanalytic and analytic factors. However, most cases of hormone receptor conversion after PST, especially those with ER conversion, had low hormone receptor expression levels, suggesting that analytical issues associated with the use of a specific cut-off value (1% in this study) and intra-tumoral heterogeneity may contribute to the discordance between biopsy and excision specimens.
There are some limitations in this study. First, being a retrospective study, the patients were not treated with homogenous chemotherapeutic regimen although most patients received standard treatment. Moreover, changes were made regarding hormone and anti-HER2 therapies in treatment of breast cancer during 2004 to 2015. For example, in 113 HER2-postitive breast cancer patients, 12 patients (10.6%) did not receive anti-HER2 therapy. Although there was no survival difference in HER2-positive breast cancer patients with or without anti-HER2 therapy (p=0.920, log-rank test, data not shown), the difference in adjuvant treatment may affect clinical outcome. Also, the follow-up periods were too short for the recent cases, considering the large proportion of early staged breast cancer in this group. Thus, further large-scale studies in a homogeneously-treated patient population with long-term follow-up would be needed to confirm the prognostic value of PR conversion after PST in breast cancer.
In conclusion, negative conversion of PR status after PST was frequently observed in breast cancer, and it was associated with poor clinical outcome in patients with breast cancer. Therefore, we suggest that re-evaluation of basic biomarkers should be mandatory in breast cancer after PST, for proper management and better prognostication of patients.
Notes
Conflict of interest relevant to this article was not reported.
Acknowledgements
This study was supported by a grant from the Basic Science Research Program through the National Research Foundation of Korea (NRF) funded by the Ministry of Science, ICT and Future Planning (Grant No. NRF-2015R1A2A2A01007907) to Park SY.