Supporting Low-income Cancer Patients: Recommendations for the Public Financial Aid Program in the Republic of Korea
Article information
Abstract
Purpose
As the recent term of “financial toxicity” implies, cancer causes a treatment-related financial harm. Financial Aid Program for Cancer Patient (FAPCP) is a government’s financial support for low-income patients in the Republic of Korea. This study aimed to describe FAPCP applicants’ condition and to investigate factors influencing financial burden, which would provide the basis for implementing a strategy for FAPCP administration.
Materials and Methods
The telephone survey results from 2,700 FAPCP participants were analyzed, including demographic, socioeconomic, and disease characteristics and experiences associated with financial burden and the actions or measures to cope with them.
Results
Overall, 87.6% experienced financial burden more than moderate degree, 39.2% got financial help/a loan, 17.8% disposed of their property, and 10.2% changed or stopped treatment owing to medical costs. Monthly household income was connected to financial burden, and the highest income group was associated with the lowest financial burden (odds ratio [OR], 0.21; 95% confidence interval [CI], 0.11 to 0.38) and the lowest rate of changing/stopping care (OR, 0.23; 95% CI, 0.05 to 1.00). Parents of childhood cancer patients got financial help/a loan (OR, 2.24; 95% CI, 1.03 to 4.88) and disposed of their property (OR, 3.18; 95% CI, 1.40 to 7.22) more frequently, and Medical Aids applicants showed the highest rate of changing/stopping care (OR, 3.01; 95% CI, 1.89 to 4.78).
Conclusion
FAPCP targets low income groups; however, financial burden and the consequent actions taken still exist disproportionately, depending on the income of the applicants. FAPCP should focus on more vulnerable groups including Medical Aid applicants and parents of childhood cancer patients, by increasing funds and expanding their support coverage.
Introduction
Apart from its high death rate, cancer is notorious for high medical costs [1,2]. In most cases, patients need surgery and chemotherapy, the requirement for which is usually urgent owing to the rapid progress of the disease. Compared to patients with other chronic diseases, cancer patients spend large amounts on treatment in a relatively short time period [3] and pay more out-of-pocket (OOP) as copayment of uninsured services in the United States [4]. Perhaps it is for these reasons that the term “financial toxicity” has been used to describe the financial burden of patients receiving anti-cancer treatment [5]. In a recent survey by Korea Cancer Care Alliance, Korean cancer patients answered that economic difficulty continued to increase although physical, psychological and social difficulties reduced over time [6,7]. On an average, uninsured anti-cancer drug spending was 4.24 million Korean won (KRW)/mo in the same survey.
A series of governmental policies, such as lowering copayment rate of insured services to 10% in 2005 and even to 5% in 2009, were carried out in the Republic of Korea to reduce OOP payment of cancer patients. However, low-income households still experienced catastrophic health expenditure [8], particularly in case where the cancer patient was the breadwinner of the household and lost his or her job [9]. It is not only because the National Health Insurance (NHI) provides limited benefit coverage but because uncovered services have extended rapidly, resulting in a higher OOP payment. In 2016, public health care expenditure in Korea remained as low as 56.4% (Organization for Economic Co-operation and Development [OECD] average, 72.5%) and OOP payment share was as high as 36.8% of the total expenditure (OECD average, 20.3%) [10].
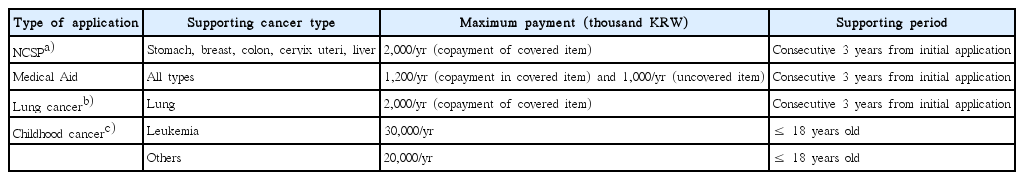
Financial Aid Program for Cancer Patients (FAPCP) is a public financial assistance program for cancer patients that has an expanded beneficiary base and eligibility since its launch in 2002 (Table 1) [11]. Initially, FAPCP funded only pediatric leukemia patients under 15, but it now covers various target groups including all childhood cancer patients below 120% of the median household income, adult cancer patients who are Medical Aid recipients, lung cancer patients who fall into the lower half of the insurance bracket, and cancer patients diagnosed through the National Cancer Screening Program (NCSP) who are in the lower half of the insurance bracket. As each beneficiary group was included into FAPCP for distinct reasons, the overall applicants of FAPCP come from various socioeconomic backgrounds and the maximum limit of the amount of funding depends on the application type. In 2016, FAPCP funded roughly 34.0 billion KRW for 49,400 adult patients and 16.2 billion KRW for 3,400 childhood patients [12]. For childhood cancer patients and Medical Aid beneficiaries, FAPCP supports uninsured services in addition to copayment of insured services, with different maximum limits for each applicant group.
Overall scheme of FAPCP
As FAPCP currently supports various applicant types with limited financial resources, it would be more effective to focus on the groups in urgent need and fund them adequately. Thus, a detailed description of the applicants’ conditions and their financial burden would provide a basis to verify the target group. The present study investigated the FAPCP recipients’ situations including financial burden and the consequent actions or measures taken to afford medical expenses, and analyzed factors associated with them. In doing so, the study aimed to provide the basis for implementing a strategy for FAPCP’s administration going forward.
Materials and Methods
1. Study population
The study used retrospective data derived from the annual satisfaction survey of FAPCP recipients. Eligible participants for the telephone survey were cancer patients, parents of childhood cancer patients, and family members of cancer patients who applied to FAPCP for financial support and submitted the written informed consent for the survey from 2014 to 2016. The participants were clearly informed that the assistance from FAPCP would be independent of their decision to participate in the survey. The participants were collected from the electronic database of FAPCP by proportional stratified random sampling. The subjects were sampled randomly from each public health center (254 administrative districts), according to the ratios of gender, registration type (newly registered applicant or existing applicant for the current year), and applicant type (childhood cancer patient, Medical Aid recipient, lung cancer patient, and cancer patient diagnosed through NCSP) that reflected the true ratio of the collective applicant base each year. Initially, the percentages of application type were obtained in the whole applicants who were supported, and the target numbers of samples (5 times of final samples) were calculated considering the ratio of registration type (newly registered vs. existing) excluding 2014 in each application type, while maintaining the ratios of application type on the whole. Then the same number of samples was allocated to 254 districts considering the gender ratio of the whole population. Those without telephone numbers or registration cards and those who were not funded for various reasons were dropped from the study. For a more comprehensive analysis, the 3-year (2014-2016) data were pooled and the final generated dataset of 2,700 respondents was used.
Although a beneficiary of FAPCP is selected based on various criteria including cancer type and diagnostic path, income or property levels are the common base for being funded. The median household income/property and the NHI brackets serve as filter criteria for childhood cancer patients, patients diagnosed by NCSP, and lung cancer patients. Cancer patients receiving Medical Aid are obviously low-income patients who passed the strict criteria of the means test. Thus, although the applicants of FAPCP are from various generations and socioeconomic statuses, a common denominator of the FAPCP applicants would be relatively low income.
2. Survey
A cross-sectional survey by telephone was performed annually at the end of each year. The survey questionnaire consisted of (1) demographic, socioeconomic, and disease characteristics of participants and (2) participants’ experiences associated with financial burden and the actions or measures taken to cope with them. The questionnaire was drafted and revised based on the literature review and consultation, and Cronbach’s α value was measured as 0.72 [13]. As two questions (income level and applicant’s registration time) had not been asked in 2014, those variables were omitted in 900 study subjects from 2014.
3. Variables
Among the independent variables, demographic and socioeconomic characteristics included sex, age (< 50, 50-59, 60-69, or ≥ 70 years), registration type (new or existing), education level (less than middle school, middle to high school, college or higher), average monthly household income (< 1 million, 1-3 million, or > 3 million KRW/mo), location (metropolitan city or province), and FAPCP applicant type (childhood cancer patient, Medical Aid, lung cancer patient, or cancer patient diagnosed through NCSP). In addition, information of private medical insurance status (yes or no) and cancer stage (stage 1, stages 2-3, or stage 4) was obtained.
The FAPCP survey asked the participants about the presence and degree of financial burden of cancer care, as the existence of financial burden implied financial difficulties of both economical and psychological meanings that the cancer patients and their families experience [13,14]. Apart from quantitative measures including monthly average income, financial burden would also represent both objective and subjective conditions of the patients. The extent of financial burden and the consequent actions or measures taken to afford medical expenses were operationalized by four questions: (1) “How would you rate your financial burden as a result of cancer care?” (4-point scale answer: none, low, moderate, high), (2) “Have you needed financial help from others or taken a loan to cover the cost?” (yes or no), (3) “Have you had to dispose your property to afford cancer care?” (yes or no), and (4) “Have you ever changed or stopped the treatment, tests, or clinic visits because of financial constraints?” (yes or no).
4. Statistical analysis
Categorical variables (sex, age, education, average monthly household income, location, applicant type, registration type, private medical insurance status, cancer stage, financial burden, experience of getting financial help/a loan, disposal of property, and changing/stopping cancer treatment) are expressed as frequencies or percentages. The 4-point scale answer for the question about financial burden was dichotomized into none/low and moderate/high for the analysis. Pearson correlations were calculated to determine the degree of correlation between the independent variables. A chisquared test and logistic regression with or without adjustment were performed using SAS ver. 9.4 (SAS Institute Inc., Cary, NC). For the multivariate analysis, sex, age, location, applicant type, registration type, education, income, and cancer stage were adjusted. All analyses were made using a p-value of 0.05 was considered to be statistically significant, designated with odds ratio (OR) and 95% confidence intervals (CIs) in case of need.
5. Ethical statement
The study protocol was reviewed and approved by the Institutional Review Board of the National Cancer Center in Korea (approval number: NCCNCS-09-252) and performed in accordance with the principles of the Declaration of Helsinki. Written informed consents were obtained.
Results
1. Characteristics of subjects according to the application type
Table 2 presents the descriptive statistics for the full sample (n=2,700), categorized by the application type of FAPCP. The proportions of sex, location, and registration type (new or existing) were initially adjusted during the multi-stratified sampling process. Except for the adjusted variables, age, education, income level, private insurance status, and cancer stage of applicants represented the distinctive features of the FAPCP application type. The applicants receiving Medical Aid and those with lung cancer were older than the NCSP group, and less educated than the NCSP group and the group comprising parents of childhood cancer patients. Overall education and income levels of all study subjects seemed to be low, as more than half of the applicants (50.2% and 65.3%, respectively) were included in the lowest tiers of education (below middle school) and income (< 1 million KRW/mo). A greater proportion of the parents of childhood cancer patients belonged to higher tiers of education and income level compared to the other groups. Although 63.7% of the NCSP group and 64.1% of the parents of childhood cancer patients purchased private health insurance, the overall private insurance purchase rate (48.9%) is a far lower figure than that of the general population (78.1% in 2014) [15]. Cancer was more progressed in the lung cancer group, which may reflect that lung cancer is difficult to detect in early stages.

General characteristics of participants according to the application type
2. Factors related to financial burden and the subsequent behaviors in study subjects
Overall, 87.6 % of applicants (n=2,366) had experienced financial burden that was more than moderate, 39.2% (n=1,059) had received financial help/a loan, and 17.8% (n=481) had disposed of their property to afford the cost. A total of 10.2% (n=276) had changed or stopped treatment due to the medical cost.
Although most applicants experienced a financial burden, the cost of cancer care was a major financial burden for males, younger applicants, parents of childhood cancer patients, low-income groups, applicants who did not have private insurance, and applicants with late-stage cancer (Table 3).

Frequency distributions of experiencing financial burden and related measures
Younger applicants, parents of childhood cancer patients, and the higher education group got financial help/a loan and disposed of their property more frequently due to medical expenses. As all the parents of childhood cancer patients were under the age of 50 and the group was relatively better educated (Table 2), it was plausible that the parents felt more financial distress and took more measures to cover their children’s care cost than other groups. The proportions of changing or stopping treatment due to the cost were not significantly different across sex, age groups, locations, and education levels (range, 9.4% to 11.4%). In contrast, the frequency of changing or discontinuing medical care differed according to application type, registration type, income level, private insurance status, and cancer stage. The figure was the lowest in the highest tier of income level (2%), and the highest in stage-4 cancer patients (17.9%) and Medical Aid applicants (16.1%).
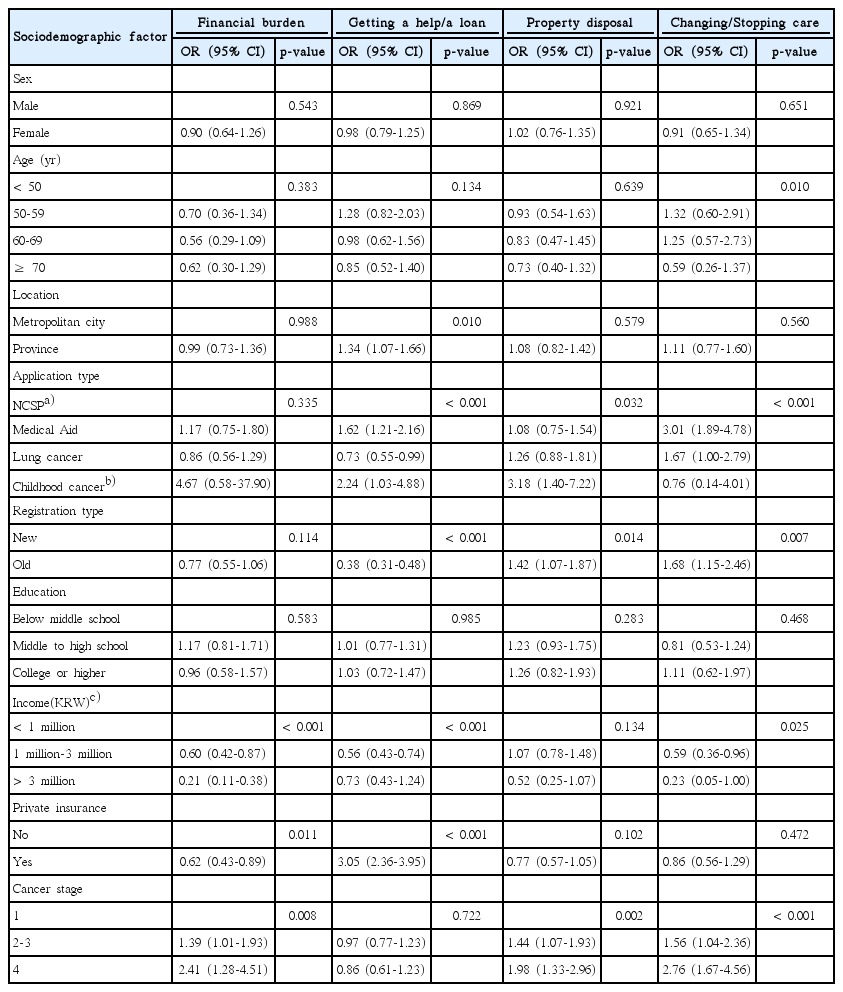
In a multivariate analysis (Table 4), higher income (OR, 0.21;95% CI, 0.11 to 0.38; in the highest tier) and private insurance (OR, 0.62; 95% CI, 0.43 to 0.89) groups were associated with significantly lower financial burden, and the applicants of stage-4 cancer were associated with higher burden (OR, 2.41; 95% CI, 1.28 to 4.51). As in the univariate analysis, the parents of childhood cancer patients got financial help/a loan (OR, 2.24; 95% CI, 1.03 to 4.88) and disposed of their property (OR, 3.18; 95% CI, 1.40 to 7.22) more frequently than any other group. Interestingly, existing applicants had gotten financial help/a loan less frequently than newly registered applicants (OR, 0.38; 95% CI, 0.31 to 0.48) but had a higher property disposal rate (OR, 1.42; 95% CI, 1.07 to 1.87). Higher income groups got financial help/a loan (OR, 0.56; 95% CI, 0.43 to 0.74; 1 million-3 million tier) less than lower income groups (< 1 million KRW/mo), and applicants with private insurance answered that they got financial help/a loan (OR, 3.05; 95% CI, 2.36 to 3.95) more than those without private insurance.
Factors associated with financial burden and related measures in multivariate analysis
As for changing or stopping cancer treatment, applicants in their 50s (OR, 1.32; 95% CI, 0.60 to 2.91), Medical Aid applicants (OR, 3.01; 95% CI, 1.89 to 4.78), existing applicants (OR, 1.68; 95% CI, 1.15 to 2.46), and stage-4 cancer applicants (OR, 2.76; 95% CI, 1.67 to 4.56) showed higher ORs compared to each reference group (Table 4). In contrast, the highest income group was the least likely to change or stop care (OR, 0.23; 95% CI, 0.05 to 1.00) compared to the reference group.
Discussion
New technologies for cancer diagnosis, treatment, and follow-up have increased its medical costs tremendously [16]. Lower income groups are likely to suffer rather than benefit from such medical progress, since they pay a higher proportion of their whole resources for treatment than higher income groups do [5,17]. The current study investigated the experience of financial burden among FAPCP applicants in both objective and subjective senses that include personal and emotional aspects, factors related to financial burden, and consequent actions or measures taken by the applicants to mitigate such burden. The results showed that monthly household income was closely connected to financial burden, and parents of childhood cancer patients and the Medical Aid group were the most burdened among the various applicant groups.
Income level was seen to be the main factor associated with financial burden, experience of getting financial help/a loan or changing/stopping treatment. Even after the adjustment of education level and applicant type, the lowest income group continued to experience heavy financial burden roughly 5 times and changing/stopping care 4.3 times more than the highest income group. This showed that the applicants underwent financial burden disproportionately and tool measures depending on income levels, despite the presence of FAPCP assistance. Conversely, education level was not linked to the proportions experiencing a financial burden, getting help/a loan, disposing of property, and changing/stopping treatment.
One of the most critical groups is the one that opted to change/stop treatment for financial reasons. Variables including application type, registration type, income, and cancer stage were linked to that decision. Of all variables, the decision to change/stop care heavily depended on the applicant type. Medical Aid group decided to change/stop treatment 3.1 times more than NCSP applicants. The absolute proportion of changing/stopping treatment ranged from 2% in the highest income group (> 3 million KRW/mo) to 16.1% in the Medical Aid group, showing a major difference between two groups. Besides the Medical Aid group, the lung cancer, existing applicants, lower income, and stage-4 cancer groups changed or stopped treatment more frequently than each reference group. As treatment for lung cancer costs more than any other cancer treatment in Korea [3], the result was sufficiently convincing. Regardless of income levels, the results showed that FAPCP needs to support applicants with lung cancer and continue to assist existing applicants.
The results clearly showed that parent of childhood cancer patients form a special group of applicants. The vulnerability of this group is evident from the perspective of a lifespan as well as simple financial distress of the household. Although young parents of childhood cancer patients are relatively better off than other applicants (Table 2), the treatment of common types childhood cancers such as leukemia and brain tumors continues to be expensive even with FAPCP assistance. Parents felt a heavy financial burden, got financial help or a loan, and disposed of the property at higher rates than any other applicant types, but they were the least likely to discontinue treatment (Table 3). Proper treatment of pediatric patients is directly linked to various physical functions in the entire life cycle as well as a specific survival period, because of which children’s care is the most urgent matter for parents.
Notably, a greater proportion of newly registered applicants got financial help or went into debt than existing applicants, but existing applicants tended to dispose of property and change/stop cancer care more frequently than new applicants. As most newly registered applicants in FAPCP are likely to be newly diagnosed cancer patients, the results may suggest some sequential economic actions that cancer patients take to afford treatment cost. Patients may initially receive help from their family or borrow money if they cannot afford treatment on their own; however, as cancer is treated and monitored over a long period of time, the patients dispose of their property (such as selling their house and valuables or cancelling installment savings) and sometimes decide to change or stop treatment if it is unsustainable. It suggests that large expenses are continuously incurred during treatment despite FAPCP assistance. Although it was reported that the medical cost is the highest in the first year of cancer diagnosis and decreases thereafter [3], the cost seems to remain burdensome for FAPCP applicants. As FAPCP only supports direct medical cost and mainly copayment of insured cost with an upper limit, the applicants are required to pay the rest including uncovered services, transportation, accommodation, and attendance, besides incurring indirect costs such as loss of job.
Meanwhile, the implications of getting financial help/a loan and disposing of property are not straightforward [18-20]. To dispose of property, one should own property such as real estate and financial assets. Likewise, the applicants should have close family members, small communities, or social networks that can help each other, or they should qualify for loans to borrow money from banks. Thus, it may not always be feasible for those in the lower income groups to get help from others, and they are not as likely to get financial help/a loan as the higher income groups. Interestingly, a greater proportion of applicants with a college diploma or higher education sought financial help/a loan or disposed of property than the lower education group, in the univariate analysis (Table 3).
It should take into account different sides to interpret the result that private insurance members got financial help/a loan more frequently than uninsured. More utilization of medical service in private insurance members might drive excess expenses and resulting debt; however, the association between medical utilization and private insurance is still a controversial issue in Korea [21-23]. Kang et al. [24] reported that cancer patients who had private insurance were likely to utilize medical service more than uninsured, but it was not clear whether this relationship was caused by the effect of insurance or the high income level. A closer examination with distinction between fixed-benefit and indemnity type of insurance would help to analyze the service utilization pattern and medical expenses. Besides, a more practical explanation would be that those who had private insurance could get a loan on insurance premium which is available for only the insured within the amount of the refund. Because the applicant did not need to be qualified for a loan additionally, a loan on premium was likely to increase the proportion of those who get a loan in our study.
Lastly, as there was no information of income level and applicant’s registration time in 2014, the present results were adjusted depending on 2-year data only. The ratios of applicant’s registration type (newly registered applicant vs. existing applicant) in whole FAPCP applicants were relatively constant (2:3) from 2014 to 2016, and the adjustment by 2-year data might not significantly alter the outcome assuming that the ratio of samples was not seriously biased by chance. Still, it could not exclude the possibility that the outcome was over- or under-adjusted by income level because of a disproportionate distribution of income in the applicants from 2014.
It was recently reported that financial distress exerted greater influence on the risk of mortality than the influence of socioeconomic status [14], and the researchers proposed overall poorer well-being, impaired quality of life, and subpar quality of care as its mechanisms. The report suggested that the experience of financial toxicity, ranging from psychological distress to personal bankruptcy, is no less harmful than the adverse effects of cancer treatment [5]. The results of this study show that Medical Aid applicants, parents of childhood cancer patients, and lower income groups other than Medical Aid applicants underwent a significant financial burden, being in more need of assistance. To avoid the impending risk of stopping cancer care and financial toxicity, these financially vulnerable groups should be protected, and FAPCP has strong public accountability for doing so.
Overall, low income was the most important factor for those experiencing financial risk and burden in FAPCP applicants. FAPCP generally targets lower income groups; however, financial burden and the consequent actions taken still exist disproportionately, depending on the income of the applicants. It seemed that the applicants were more likely to face a financial crisis as time passed after cancer diagnosis, resulting in the decision to change or stop care. The support of that FAPCP provides is likely to be of insufficient help for cancer patients of lower income groups. If FAPCP is a under budget constraint, it should focus on more vulnerable groups including Medical Aid applicants and parents of childhood cancer patients by increasing funds and expanding their support coverage.
Notes
Conflict of interest relevant to this article was not reported.