Profiling of Serum Metabolites Using MALDI-TOF and Triple-TOF Mass Spectrometry to Develop a Screen for Ovarian Cancer
Article information
Abstract
Purpose
We sought to develop a matrix assisted laser desorption ionization-time of flight (MALDI-TOF)-based, ovarian cancer (OVC), low-mass-ion discriminant equation (LOME) and to evaluate a possible supportive role for triple-TOF mass analysis in identifying metabolic biomarkers.
Materials and Methods
A total of 114 serum samples from patients with OVC and benign ovarian tumors were subjected to MALDI-TOF analysis and a total of 137 serum samples from healthy female individuals and patients with OVC, colorectal cancer, hepatobiliary cancer, and pancreatic cancer were subjected to triple-TOF analysis. An OVC LOME was constructed by reference to the peak intensity ratios of discriminatory low-mass ion (LMI) pairs. Triple-TOF analysiswas used to select and identify metabolic biomarkers for OVC screening.
Results
Three OVC LOMEs were finally constructed using discriminatory LMI pairs (137.1690 and 84.4119 m/z; 496.5022 and 709.7642 m/z; and 524.5614 and 709.7642 m/z); all afforded accuracies of > 90%. The LMIs at 496.5022 m/z and 524.5614 m/z were those of lysophosphatidylcholine (LPC) 16:0 and LPC 18:0. Triple-TOF analysis selected seven discriminative LMIs; each LMI had a specificity > 90%. Of the seven LMIs, fourwith a 137.0455 m/z ion atretention times of 2.04-3.14 minuteswere upregulated in sera from OVC patients; the ion was identified as that derived from hypoxanthine.
Conclusion
MALDI-TOF–based OVC LOMEs combined with triple-TOF–based OVC metabolic biomarkers allow reliable OVC screening; the techniques are mutually complementary both quantitatively and qualitatively.
Introduction
Epithelial ovarian cancer (OVC) is the fourth most common cause of death from cancer in Western women. Over 70% of patients are diagnosed at advanced stages; the 5-year survival rate is < 30%. As epithelial OVC has few specific symptoms, the challenge is to detect OVC early to improve clinical outcomes [1].
Various screening methods including measurements of serum tumor and proteomic markers, and ultrasonography, have been developed and intensively investigated. A strategy combining serum tumor marker levels with ultrasonography has shown most promise; large-scale randomized clinical trials have been conducted. The UK Collaborative Trial of Ovarian Cancer Screening (UKCTOCS) featuring annual carbohydrate antigen 125 (CA-125) measurement and second-line transvaginal ultrasound scanning afforded sensitivity of 89.5% and specificity of 99.8% among postmenopausal women, but primary analysis indicated that any reduction in mortality was not statistically significant [2,3]. Similar trials have been performed in the United States. For example, the Prostate, Lung, Colorectal, and Ovarian (PLCO) Cancer Screening study found that simultaneous screening of the CA-125 level and transvaginal ultrasonography (compared with the usual care) did not reduce OVC mortality in post-menopausal women, and false-positive data were associated with various complications [3]. A recent 15-year follow-up PLCO report showed that mortality was not reduced by CA-125/ultrasonographic screening [4].
Thus, no reliable screening method exists and a noninvasive method is urgently required. Recently, we reported that a low-mass ion discriminant equation (LOME) might allow early detection of OVC [4]. In our previous study, we performed matrix assisted laser desorption ionization-time of flight (MALDI-TOF) mass analysis on metabolic low-mass ions (LMIs) using 1,184 serum samples from healthy individuals and patients with OVC or other types of cancer [4]. An OVC LOME derived using 13 discriminatory LMIs yielded excellent results. Among 13 LMIs exhibiting differential mass intensities in OVC patients, three (LPC 16:0, D,L-glutamine, and the fibrinogen alpha-chain fragment) were identified and semi-quantitated [4].
In the present study, we focused on modification and validation of the MALDI-TOF‒based OVC LOME, and we also compared MALDI-TOF and triple-TOF analyses discriminating OVC.
Materials and Methods
1. Study population
A total of 114 serum samples from women with OVC and benign ovarian tumors (BOTs) were subjected to MALDITOF analysis (Table 1, S1-S3 Tables). A total of 137 serum samples from healthy women (controls) and those with OVC, colorectal cancer (CRC), hepatobiliary cancer (HBC), and pancreatic cancer (PC) were subjected to triple-TOF analysis (Table 2, S4-S9 Tables). The OVC groups differed between the two analyses. HBC and PC included high risk groups. Samples were collected before surgery or chemotherapy to prevent any effects of anesthetics or anticancer agents on the LMIs of sera. Some resources were provided by the Korean Gynecological Cancer Bank through the Bio & Medical Technology Development Program of the Ministry of Science, ICT and Future Planning, South Korea.

Demographic data on study participants evaluated via MALDI-TOF analysis

Demographic information on patients evaluated via triple-TOF analysis
2. Separation of the OVC from the BOT group using MALDI-TOF data
The manner in which we formulated a LOME separating the OVC and BOT groups differed significantly from that of our previous study [5], although the basic ideas and many procedures were similar. The modified methods were described in the following parts 4 and 5.
3. MALDI-TOF and triple-TOF analyses
MALDI-TOF (Autoflex Speed, Bruker Daltonik GmbH, Bremen, Germany) and triple TOF 5600+ system (AB SCIEX, Framingham, MA) analyses were performed as described previously [5,6] (see more details in Supplementary Methods).
4. Preliminary LMI candidates
Principal component analysis–based discriminant analysis (PCA-DA) was performed to discriminate the OVC from the BOT group. The groups were not divided into training and validation sets, as the sample numbers were rather small. Six repetitive sets of measurement data were respectively analyzed. When performing PCA-DA, it is necessary to import mass spectra into MarkerView software (AB SCIEX, Foster City, CA). During this process, we chose the following settings: mass tolerance, 300 ppm; minimum required response, 10.0; and maximum number of peaks, 10,000. Data in the resulting peak table were converted into common logarithms and Pareto-scaled. A zero mass intensity was set to unity because Log10(0) is undefined and Log10(1) is zero. The Markerview software accepts only natural logarithms; the reference manual deals with PCA-DA and Pareto scaling.
The PCA-DA discriminant score (DS) was the weighted sum of the Pareto-scaled intensities of all LMIs (≤ 10,000). Usually, a few percent of the LMIs play a crucial role in calculation of the DS. Search algorithm I selected preliminary LMI candidates using two criteria: (1) weighted intensities > 0.018 for each sample and (2) LMIs common to > 50% of the entire sample. The 0.018 threshold was empirically determined in an iterative manner; we explored how various thresholds changed the numbers of candidate LMIs and their performance in terms of classification. Search algorithm I was individually applied to the six PCA-DA results and the resulting LMIs were assembled into a preliminary candidate set of P LMIs by replacing multiple LMIs with similar mass values by an averaged mass value.
5. Discriminative LMIs derived using MALDI-TOF data
A peak table was prepared for each sample by sequentially importing the six repetitions. Each peak table was normalized using the “total area sums” method described in the reference manual. The six mass intensities of all preliminary LMI candidates were extracted and processed as follows: (1) the ranges of mass values ±0.5 m/z were determined; (2) the maximum normalized intensity was determined for every repetition in the interval; (3) the mean of the six maximum intensities was calculated (the averaged intensity); and (4) the common logarithm of the averaged intensity was calculated. Throughout this process, a column of the logarithmic intensities of P LMI candidates was built for each sample and then merged into a single peak table for the entire sample.
Several LOMEs derived using the ratio of two discriminant LMIs were constructed with the aid of the logarithmic peak table. Search algorithm II identified the two LMIs as follows: (1) The PC2 combinations were listed and every pair of LMIs was evaluated twice. One of the two LMIs was initially arbitrarily chosen as the numerator in the first round and the denominator in the second. (2) Every pair in the list was investigated sequentially. The ratios of the common logarithms of all paired LMIs were calculated to yield DSs. (3) We identified a threshold with a resolution of 0.01 that maximized the sum of the sensitivity and specificity. If more than one threshold afforded the same performance, the thresholds were averaged. (4) The two ordered pairs, the thresholds, and their sensitivity and specificity sums were tabulated for later comparison. (5) A few discriminative pairs were identified by comparing the discriminatory performances of all ordered pairs.
6. Distinguishing OVC from non-OVC patients using triple-TOF data
Triple-TOF measurements were performed only once on each sample, unlike the procedure described above during MALDI-TOF evaluation. We did not select preliminary LMI candidates; our focus was on defining a single LMI, the pattern of which differed between the OVC and non-OVC (control/CRC/HBC/PC) groups.
7. Discriminative LMIs identified using the triple-TOF data
Liquid chromatography/mass spectrometry (LC/MS) peak lists (.peaks files) were first created for all samples (.wiff files) using MarkerView software running under the following constraints: minimum retention time, 0.00 minute; subtraction offset, 10 scans; subtraction mult. factor, 1.3; noise threshold, 10; minimum spectral peak width, 10 ppm; and minimum retention time peak width, 5 scans. Next, a peak table was created by simultaneously importing the LC/MS peak lists for all samples. The parameters for the second process were as follows: retention time tolerance, 0.01 minute; mass tolerance, 10.0 ppm; intensity threshold, 10; and maximum number of peaks, 20,000. Areas were derived using raw data, not the original peak findings, as suggested by the reference manual. The resulting peak table was normalized using the “total area sums” method and the data converted to common logarithms. As for MALDI-TOF, a zero peak area was set to unity.
Several LMIs exhibiting individually acceptable discriminatory abilities were searched using the logarithmic peak table (consisting of 7,018 LMIs). Search algorithm III was straightforward. (1) For each LMI, a threshold with a resolution of 0.01 was chosen at which the sum of the sensitivity and specificity was maximized. If more than one threshold exhibited the same discriminatory performance, the thresholds were averaged. (2) A few discriminatory LMIs were identified by comparing the performances of all LMIs. As an initial check, their locations on the volcano plot and/or their Fisher’s discriminant ratios (FDRs) were evaluated.
8. Identification of metabolite ions
The mass spectrometry (MS) and tandem mass spectrometry (MS/MS) spectra were explored using Formula Finder computational tools (AB SCIEX) that identify probable elemental compositions within specified mass tolerances of a given mass-to-charge ratio using PeakView software. The Human Metabolome Database (HMDB) identified compounds associated with given m/z ratios, and listed them in rank order based on the MS and MS/MS data.
9. Statistics
A volcano plot was created and the associated t-test performed using data from the normalized peak table (not the logarithmic table), employing MarkerView software (AB SCIEX).
10. Ethical statement
Informed consent was obtained from all participants, and the institutional review board of each participating institution approved the research protocol.
Results
1. Preliminary LMI candidates
The discriminations afforded by PCA-DA (sensitivity, 96.49%; specificity, 91.23%) and Search algorithm I (sensitivity, 91.23%; specificity, 94.74%) are shown in Fig. 1 for one of the representative six repeat measurements. All LMIs in the peak table were included in the PCA-DA DSs. Unlike when the mass intensity per se was used [5,6], the DS range fell noticeably when Search algorithm I rather than the PCA-DA was employed (logarithmic intensities were analyzed). However, the marked decrease in the number of LMIs did not greatly reduce the discriminatory capacity. Individual applications of Search algorithm I to the six repetitions, followed by assembly of the resulting LMIs, yielded 374 preliminary candidates.
Separation results obtained during one of the six repeats of matrix assisted laser desorption ionization-time of flight analysis. (A) Principal component analysis-based discriminant analysis (PCA-DA). (B) Preliminary low-mass-ion candidates. DS, discriminant score; OVC, ovarian cancer; BOT, benign ovarian tumor.
2. Ratios of the discriminatory LMI pairs yielded by the MALDI-TOF data
Search algorithm II identified several pairs of discriminatory LMIs (Fig. 2) between the OVC and BOT groups. The separation performances of three such pairs are summarized in Table 3. In all cases, the accuracies were > 90%. Overall, the logarithmic intensities of the numerator LMIs were higher in the OVC than in the BOT group and the reverse was true for the denominator LMIs. The numerator LMIs of 496.5022 m/z and 524.5614 m/z were earlier identified as lysophosphatidylcholine (LPC) 16:0 and LPC 18:0 [5,6]. Different tumor stage did not lead to significant change in screening sensitivity and specificity (Fig. 2).
Discriminatory results afforded by the ratios of low-mass ion pairs on matrix assisted laser desorption ionization-time of flight analysis. (A) Log10(137.1690 m/z)/Log10(84.4119 m/z). (B) Log10(496.5022 m/z)/Log10(709.7642 m/z). (C) Log10 (524.5614 m/z)/Log10(709.7642 m/z). OVC, ovarian cancer; BOT, benign ovarian tumor.
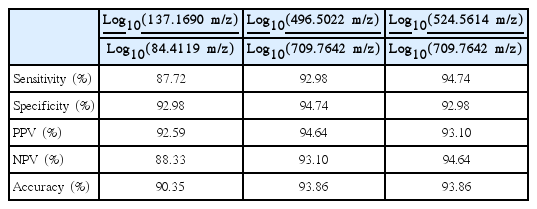
The discriminatory capacity ratios of certain LMI pairs upon MALDI-TOF analysis
3. Individual discriminative LMIs derived using triple-TOF data
Search algorithm III identified seven LMIs (Fig. 3A) differentiating between the OVC and control/CRC/HBC/PC groups; the overall specificity was > 90%. There was no significant change in screening sensitivity and specificity according to tumor stage (Fig. 3A). LMI with 381.1314 m/z only showed a pattern of decrease in late stage, i.e., stage I vs. III (p=0.006), stage I vs. IV (p=0.045) and stage II vs. III (p=0.01) (Fig. 3A). Table 4 shows the discriminatory performances. Overall, the logarithmic peak areas of the first five LMIs were higher in OVC than in non-OVC patients and the reverse was true for the other two LMIs. In particular, the latter two LMIs exhibited excellent separation capabilities. Accordingly, when these LMIs were used as denominators (as in MALDI-TOF evaluation), their performances were outstanding. For all 10 (5×2) cases, the accuracies were > 98% (thus, no more than two false-positives/100 patients), as expected. The associated volcano plot (Fig. 3B) and the high FDR (Table 4) confirmed these findings. The fourth and fifth LMIs are not highlighted on the volcano plot (unlike the other five) because the Log10(-fold change) of the first LMI was very close to those of LMIs 2 and 3; they could not be individually visualized.
Seven candidate metabolites suggested by triple-TOF analysis to be characteristic of ovarian cancer (OVC). (A) Figure shows relative amount of each candidate metabolites [Y-axis, Log10(mass peak area of low-mass ion)] in healthy women (control) and those with OVC, colorectal cancer (CRC), hepatobiliary cancer (HBC), and pancreatic cancer (PC). Low-mass ions (LMIs) of 137.0455 m/z, retention time (RT) 2.04 min; 138.0497 m/z, RT 2.46 min; 159.0270 m/z, RT 2.46 min; 137.0461 m/z, RT 2.07 min; 137.0454 m/z, RT 3.14 min; 359.1413 m/z, RT 15.27 min; 381.1314 m/z, RT 15.30 min. Of the seven LMIs, four with a 137.0455 m/z ion at RTs of 2.04-3.14 min were upregulated in sera from OVC patients; those LMIs were identified as hypoxanthine. (B) A volcano plot of low-mass ions detected on triple-TOF analysis.

The discriminatory capacities of OVC-related metabolites identified on triple-TOF analysis
4. Metabolites discriminating OVC from BOT
Triple-TOF analysis revealed that seven single LMIs potentially discriminated OVC from BOT (Table 4). A search of the HMDB using the exact LMI masses revealed several candidate metabolites (Table 5). Of these, four with a 137.0455 m/z ratio at retention times of 2.04-3.14 minutes were upregulated in serum from OVC patients (Fig. 3). The HMDB identified hypoxanthine as the metabolite corresponding to these LMIs (Table 5). We used MS/MS to confirm this finding; the MS/MS pattern of the LMIs at 137.0455 m/z was identical to that of hypoxanthine (Fig. 4).

Seven candidate metabolites discriminating OVC

Identification of hypoxanthine upregulated in sera of ovarian cancer (OVC) patients. A low-mass ion of 137.0455 m/z (left panel, B) exhibited a retention time (RT) that differed slightly from that of hypoxanthine (left panel, A), but the tandem mass spectrometry (MS/MS) pattern (right panel, B) was exactly that of hypoxanthine (right panel, A).
Discussion
We selected preliminary LMI candidates by aligning the mass peaks of all samples with each mass value. We did not simultaneously import all six repeats when creating a peak table using MarkerView software. PCA-DA and Search algorithm I were employed to this end (Fig. 1). However, this did not necessarily identify a monoisotopic peak on the main lobe. In fact, the three numerator LMIs were present as monoisotopic peaks on the side lobe of second- highest intensity, thus at 138.1754 m/z, 497.5082 m/z, and 525.5643 m/z. This was also the case in our previous studies [5,6], but there is no reason to insist that only these LMIs should be used; completely new approaches are possible.
MALDI-TOF did not yield any unique LMI affording acceptable performance. We limited the number of LMIs used to create a LOME to two, formulated as a ratio (Fig. 2). The method can be easily extended to the creation of new LOMEs including more than two LMIs; however, the ratio approach would not then be appropriate. For example, the ratio can be replaced by an algebraic sum of the signed logarithmic intensities. In addition, the number of PCI combinations will increase sharply with increasing I, where I is the number of LMIs used to compose a LOME. Accordingly, it is important to reduce candidate LMIs using methods such as PCA-DA and Search algorithm I.
It is not possible to compare the MALDI-TOF and triple-TOF data directly; the OVC countergroups differed. In triple-TOF analysis, the ratio scheme was implemented without selection of candidate LMIs (thus, the intermediate step was omitted) after identification of individual discriminatory LMIs. However, the reduction step may be useful when the goal is to apply a ratio or other multi-LMI scheme directly. In addition, it is much more time-consuming to create a peak table for triple-TOF than for MALDI-TOF data. Therefore, any peak table should be used for various purposes, such as multi-cancer screening on single samples; in males, analysis of serum samples will also be required. MALDI-TOF consumes less analytical time than triple-TOF and more samples can be analyzed on a single MALDI target plate. However, we recently found that reproducibility is affected by MS hardware such as the laser source and laser power unit. Thus, we sought to apply LOME to triple-TOF analysis to enhance analytical repeatability and to identify candidate metabolites for inclusion in LOMEs. The analytical tools are mutually complementary.
A screening test for OVC must be highly specific and highly sensitive, to avoid needless surgery. As the incidence of epithelial OVC is low, the positive predictive value of multimodal screening was only 35.1%, but the sensitivity and specificity were as high as 89.5% and 99.8%, respectively, in the UKCTOCS trial [2]. In the present study, we show that LOME may overcome the shortcomings of other noninvasive screening tests, without any need for imaging. The sensitivity and specificity may reach 98% if the optimal discriminatory equation is selected. Furthermore, the hypoxanthine LMI discriminated OVC from non-OVC patients (Figs. 3 and 4). Hypoxanthine is a natural purine derivative, and an intermediate in adenosine metabolism and nucleic acid synthesis via the salvage pathway (http://www.hmdb.ca/). We previously identified hypoxanthine as a useful serum biomarker of the chemoresponsiveness of locally advanced rectal cancer [7], and as a valuable urine biomarker when screening for non-Hodgkin lymphoma [8]. The urinary hypoxanthine level may be a marker of gastrointestinal tumors [9,10]. Recent metabolic profiles of ovarian cyst fluid samples from benign, borderline, and malignant ovarian tumors showed that hypoxanthine was present only in a sub-cohort of malignant tumors [11]. Our findings support the suggestion that high serum hypoxanthine levels may be indicative of OVC (Figs. 3 and 4). Furthermore, a higher hypoxanthine concentration correlated with a good chemoresponse in patients with locally advanced rectal cancer [7]. In OVC patients, hypoxanthine completely reversed the cytotoxicity induced by methotrexate and methotrexate plus dipyridamole [12]. Unfortunately, the sample size of the present OVC group was too small to allow us to explore links between the hypoxanthine level and clinicopathological factors including chemoresponse and stage. However, we expect that several candidate markers identified and to be identified may have a potential for screening OVC in early stage. For example, Metabolite with 381.1314 m/z showed a pattern of decrease in late stage (Fig. 3A). Therefore, future work on this issue is thus needed.
In conclusion, a MALDI-based LOME exhibited good potential as a noninvasive screening test for OVC, and triple-TOF-based metabolite analysis successfully identified OVC biomarkers.
Electronic Supplementary Material
Supplementary materials are available at Cancer Research and Treatment website (http://www.e-crt.org).
Notes
Conflict of interest relevant to this article was not reported.
Acknowledgements
This work was supported by grant from the Korean Health Technology R&D Project, Ministry of Health & Welfare, Republic of Korea (HI12C0050).