Sarcopenia Predicts Prognosis in Patients with Newly Diagnosed Hepatocellular Carcinoma, Independent of Tumor Stage and Liver Function
Article information
Abstract
Purpose
The purpose of this study was to demonstrate the prognostic significance of changes in body composition in patients with newly diagnosed hepatocellular carcinoma (HCC).
Materials and Methods
Patients (n=178) newly diagnosed with HCC participated in the study between 2007 and 2012. Areas of skeletal muscle and abdominal fat were directly measured using a three-dimensional workstation. Cox proportional-hazards modes were used to estimate the effect of baseline variables on overall survival. The inverse probability of treatmentweighting (IPTW) method was used to minimize confounding bias.
Results
Cutoff values for sarcopenia, obtained from receiver-operating characteristic curves, were defined as skeletal muscle index at the third lumbar vertebra of ≤ 45.8 cm/m2 for males and ≤ 43.0 cm/m2 for females. Sarcopenia patients were older, more likely to be female, and had lower body mass index. Univariable analysis showed that the presence of sarcopenia and visceral to subcutaneous fat area ratio (VSR) were significantly associatedwith prognosis. The multivariable analyses revealed that VSR was predictive of overall survival. However, in the multivariable Cox model adjusted by IPTW, sarcopenia, not VSR, were associated with overall survival.
Conclusion
The presence of sarcopenia at HCC diagnosis is independently associated with survival.
Introduction
Sarcopenia is defined as loss of skeletal muscle mass and strength [1]. It usually occurs as part of the normal aging process in an elderly population, but is also associated with various health problems, including liver cirrhosis [2], metabolic syndrome [3], chronic kidney disease [4], inflammatory bowel disease [5], and cognitive impairment [6]. Sarcopenia may also be associated with cancer, which is a leading cause of death in many parts of the world and will be a far bigger health issue due to increasing life expectancy.
Previous studies demonstrated that changes in body compositions were associated with poor outcomes in cancer patients. For example, Kumar et al. [7] reported that computed tomography (CT)–measured muscle mass was associated with overall survival in patients with advanced ovarian cancer [7]. Similar results were reported for various solid organ malignancies including lung cancer, pancreas cancer, renal cell carcinoma, and esophageal cancer, and for hematologic malignancies such as lymphoma [8-12].
Among patients with hepatocellular carcinoma (HCC), sarcopenia was associated with poor outcome after various treatments [13-15]. A recent Japanese study found that changes in body composition, including sarcopenia, were predictive of overall survival in a large number of HCC patients, more than one third of whom had previously received anticancer therapy [16]. However, cancer treatment itself can have either a positive or negative effect on skeletal muscle mass, depending on the treatment response [17,18]. In addition, the severity of liver disease, assessed by tumor stage and hepatic impairment, may affect sarcopenia status. In this study, we evaluated the impact of sarcopenia on survival of patients newly diagnosed with HCC, after adjustment for multiple covariates which might have influenced skeletal muscle mass.
Materials and Methods
We identified patients who are newly diagnosed with HCC and whose first treatment plan (including supportive care) was made at our center between 2007 and 2012. Patients who did not have CT images appropriate for the evaluation of skeletal muscle mass and abdominal fat area were excluded. Patients who had other malignancies in the five years before their HCC diagnosis were also excluded. Clinical characteristics included in the study were age at HCC diagnosis, sex, body mass index (BMI), presence of diabetes, etiologies of liver disease, presence of cirrhosis and ascites, and level of functioning, measured by the Eastern Cooperative Oncology Group (ECOG) scale of performance status. Laboratory characteristics included liver function tests, creatinine, electrolytes, complete blood count, fasting glucose, lipid profiles, C-reactive protein, and tumor markers, including α-fetoprotein (AFP) and protein induced by vitamin K absence/antagonist-II. Tumor features were assessed with baseline CT imaging and included tumor size, number, type, presence of vascular invasion, and Barcelona Clinic Liver Cancer (BCLC) stage. Child-Pugh score, Model for End-stage Liver Disease (MELD) score, and MELD-Na score were calculated at baseline for the evaluation of liver function.
Patients were diagnosed with HCC by their managing physicians using the American Association for the Study of Liver Diseases guidelines. The diagnoses were confirmed by the authors of the study during enrollment. Liver cirrhosis was diagnosed either by a combination of medical history, physical examination, liver function tests, and CT imaging, or by histology when available.
Baseline data, follow-up information and mortality records were fully accessible.
1. Measurement of skeletal muscle mass and abdominal fat area
The unenhanced axial CT images (5 mm thickness) for each patient were sent to a three-dimensional workstation (AW 5.5, GE Healthcare, Milwaukee, WI). A radiologist (D.K.) with > 10 years of experience measured the skeletal muscle mass and abdominal fat area.
For the measurement of the skeletal muscle mass (cm2), a cross-sectional image at the level of the third lumbar vertebra (L3) was selected. At this level, the rectus abdominis, external and internal oblique muscle, transverse abdominis, psoas major, quadratus lumborum, and erector spinae were identified. Any intra-abdominal structure inside the inner boundary of aforementioned skeletal muscle was erased by manual demarcation to maximize the accuracy of the measurement. Then, the Hounsfield Units (HU) of ‒30 to +150 were applied to confirm the L3 skeletal muscle mass (Fig. 1) [19].
Representative image of skeletal muscle area measurement at the third lumbar vertebra level.
For the measurement of the abdominal fat area (cm2), a cross-sectional image at the L3 level was selected. A line was drawn outside of the patient’s body and the total fat area was measured with the attenuation value of ‒250 to ‒50 HU (Fig. 2A) [19]. Then, an internal line along the outer boundary of the skeletal muscles was manually drawn and the visceral fat area was measured with the same HU range (Fig 2B). The area of subcutaneous fat was calculated by subtracting the visceral fat area from the total fat area.
Representative images of total fat area measurement (A) and visceral fat area measurement (B) at the third lumbar vertebra level.
All of the measured values were normalized to height (m2) and expressed as total fat area index, visceral fat area index, and subcutaneous fat area index. The visceral to subcutaneous fat area ratio (VSR) and skeletal muscle mass to total fat area ratio were calculated from the measured values.
2. Statistical analysis
The data were presented as mean±standard deviation for continuous variables and the number and percentage for categorical variables. The relationships between sarcopenia status and continuous variables were assessed by Student’s t tests or Wilcoxon rank-sum tests. The relationships between sarcopenia status and categorical variables were analyzed by chi-square or Fisher exact tests, depending on the distribution of the variable. The optimal cutoff values used to define sarcopenia in males and females were determined by the receiver operating curve (ROC) analysis.
The primary endpoint of this study was overall survival. The duration between the date of HCC diagnosis and death was calculated. Patients were followed up until death or December 31, 2015, whichever came first. In the event of loss to follow-up, censoring occurred at the date of the last visit to the clinic.
The association between the baseline variables and overall survival were determined using Cox proportional-hazards models. Next, we performed the same analyses with the data weighted to the population of eligible patients. To adjust for observable differences between sarcopenia and non-sarcopenia patients, we used the inverse probability of treatment weighting (IPTW) method with all baseline variables. The IPTW uses weights based on the estimated propensity score for sarcopenic patients and the inverse of one minus the propensity score for patients without sarcopenia. The balance of the covariates in the weighted population was evaluated.
We computed standardized mean differences between the two groups. We considered the covariate distribution to be balanced if the absolute standardized difference was < 0.2.
All reported p-values were two-sided, and p-values of < 0.05 were considered statistically significant. SAS ver. 9.1 (SAS Institute Inc., Cary, NC) and R ver. 3.0 (http://cran.r-project.org/) software were used for statistical analyses. The covariate balancing propensity score package in R was used for the IPTW method [20].
3. Ethical statement
The study protocol was approved by the institutional review board of our center. The requirement for written informed consent was waived.
Results
1. Patients
A total of 216 patients were identified during the study period. Among them, 38 patients who did not meet eligibility criteria (27 with no appropriate CT images; and 11 with concomitant malignancies) were excluded. The final study sample included 178 patients.
2. Characteristics of sarcopenic vs. non-sarcopenic patients
The overall c-index for prediction of survival in the entire cohort was 0.55 (standard error, 0.03). After consideration of follow-up time and censoring status, the adjusted areaunder-the-receiver-operating-curve (AUROC) was 0.55 for males and 0.72 for females, for a 1-year observation period. The cutoff points for sarcopenia were 45.8 for males (sensitivity 0.40, specificity 0.81) and 43.0 for females (sensitivity 0.69, specificity 0.73). Using these cutoff points, 62 patients (34.8%) had sarcopenia.
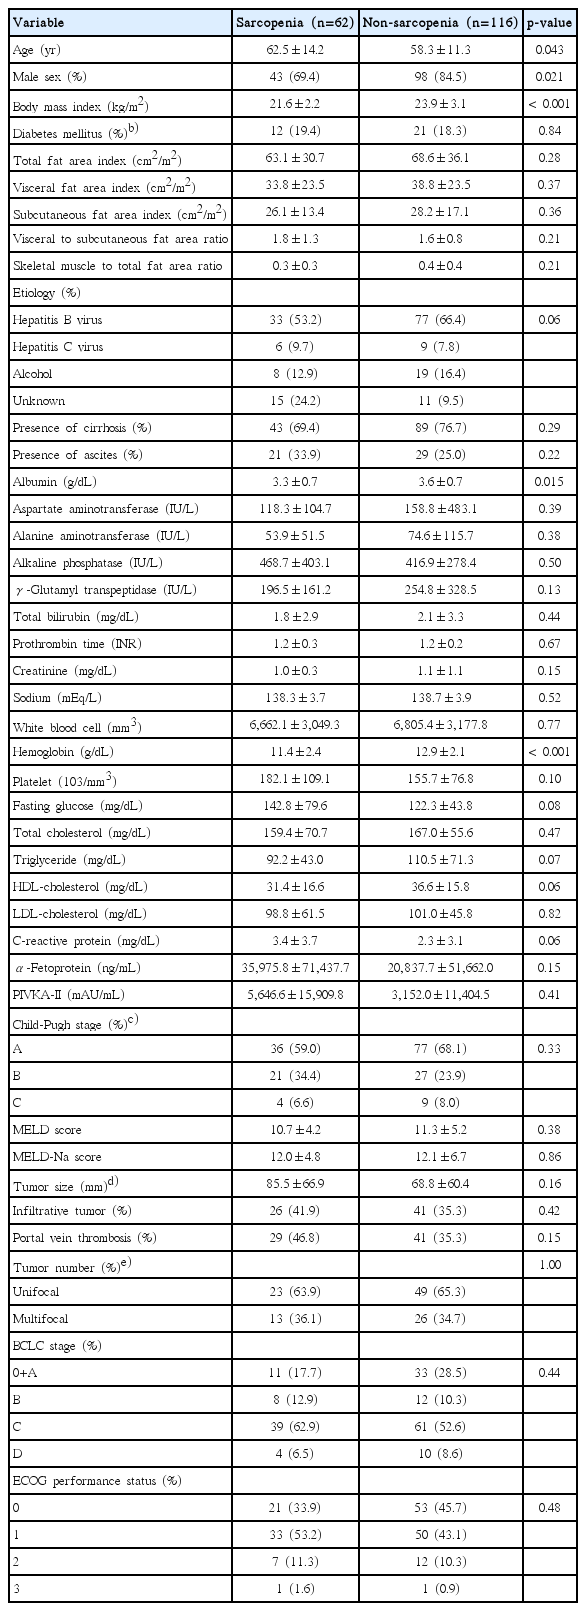
Baseline characteristics of the study population according to sarcopenic status appear in Table 1. The BMI of patients with ≥ grade 3 ascites was not calculated due to the possibility of overestimation. The mean age of sarcopenic patients were 62.5 years, compared to 58.3 years for patients without sarcopenia (p=0.043). There were more female patients in the sarcopenic group (30.6% vs. 15.5%, p=0.021). The mean BMI (23.9 kg/m2 vs. 21.6 kg/m2), albumin (3.6 g/dL vs. 3.3 g/dL), and hemoglobin levels (12.9 g/dL vs. 11.4 g/dL) were significantly higher in non-sarcopenic patients. Total fat area index, visceral fat area index, and subcutaneous fat area index did not significantly differ between the two groups. In addition, the VSR and skeletal muscle mass to total fat area ratio were also comparable. Other clinical and laboratory characteristics, tumor features, and liver function, did not significantly differ by sarcopenic status.
3. Characteristics associated with overall survival in the unweighted cohorts
The result of the univariable and multivariable analyses are summarized in Table 2. In the univariable analysis, presence of sarcopenia (p=0.006), subcutaneous fat area index (p=0.020), VSR (p=0.028), presence of ascites (p < 0.001), platelet count (p=0.016), C-reactive protein level (p < 0.001), AFP level (p < 0.001), Child-Pugh stage (p < 0.001), MELD score (p < 0.001), tumor size (p < 0.001), infiltrative tumor type (p < 0.001), portal vein thrombosis (p < 0.001), tumor number (p < 0.001), BCLC stage (p < 0.001), and ECOG performance status (p < 0.001) were significantly associated with overall survival. Multivariable analysis, that included nine of these variables which were not highly correlated with, was performed. VSR (hazard ratio [HR], 1.33; 95% confidence interval [CI], 1.03 to 1.72; p=0.028), AFP level (HR, 2.55; 95% CI, 1.37 to 4.74; p=0.003), tumor size (HR, 1.07; 95% CI, 1.02 to 1.13; p=0.005), infiltrative tumor type (HR, 4.51; 95% CI, 2.08 to 9.76; p < 0.001), and BCLC stage (p < 0.001) remained statistically significant. The presence of sarcopenia was not associated with overall survival (HR, 1.18; 95% CI, 0.63 to 2.20; p=0.60).
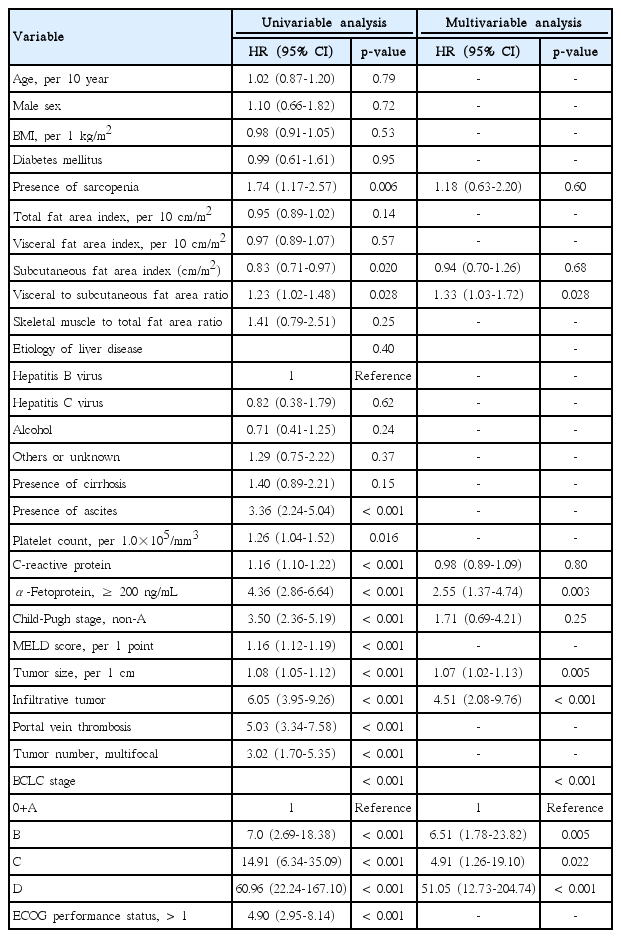
Univariable and multivariable analyses of factors affecting overall survival in 178 patients with hepatocellular carcinoma
4. Characteristics associated with overall survival in the weighted cohorts
To control for potential confounding, propensity score weighting using the IPTW method was performed. After weighting, the covariates were generally well balanced (S1 Fig.).
Contrary to the results of multivariable analysis in the unweighted cohorts, the presence of sarcopenia was significantly associated with overall survival after IPTW adjustment (HR, 1.63; 95% CI, 1.03 to 2.57; p=0.038) (Table 3).
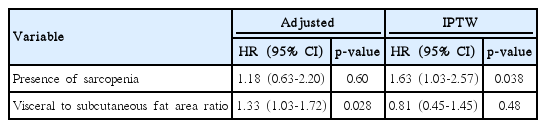
Adjusted and weighted Cox-proportional analyses of factors affecting overall survival
In the analysis of VSR, which was significant in the multivariable analysis of unweighted cohorts, the ROC plot initially identified 1.5 as the best cutoff for predicting 1-year survival (AUROC, 0.58; sensitivity, 0.56; specificity, 0.59). When this cutoff point was tested by IPTW analysis, VSR was not significantly associated with overall survival (HR, 0.81; 95% CI, 0.45 to 1.45; p=0.48).
Discussion
The result of this study suggested that the presence of sarcopenia at the time of HCC diagnosis predicted poor overall survival, independent of demographics, tumor stage, and the degree of liver dysfunction. Previous studies demonstrated that sarcopenia was associated with poor outcomes in HCC patients. However, there are some points which need to be considered. First, a recent Japanese study, which investigated the impact of changes in body composition on survival in a large sample of HCC patients, demonstrated that sarcopenia and visceral adiposity were associated with mortality [16]. It is noteworthy is that about 40% of the patients in that study had previously received anticancer treatment, which can affect body composition [17,18]. Therefore, to better understand the role of body compositional changes on patients’ prognosis, we examined the associations in an untreated sample.
Another challenge was that baselines of untreated HCC patients were heterogeneous and these factors might have affected the quantity of muscle and fat. For example, as sarcopenia is an age- and sex-related change, elderly and women are more frequently affected [1]. In addition, the presence of cirrhosis and the degree of liver dysfunction affect the sarcopenic status, even without malignancy [2]. There is no doubt that patients with more advanced cancer experience “cancer cachexia,” loss of muscle mass and body fat. Therefore, it should be clarified that poor outcomes in sarcopenic patients may be due to sarcopenia itself or due to other factors, which indirectly induce sarcopenia, before we introduce emerging anti-sarcopenic drugs to HCC patients.
After we performed survival analyses for our sample of untreated HCC patients, the IPTW method was employed to reduce the confounding effects of other risk factors. IPTW analysis is a weighting method based on propensity scores and is generally considered to be a superior statistical methodology for the adjustment of potential confounders in observational studies when there are not enough patients for matching [21]. The presence of sarcopenia, which was associated with poor overall survival in the univariable analysis, was shown to increase the risk of death by 18% in the multivariable analysis, although this increase was not statistically significant. However, subsequent IPTW analysis indicated that the presence of sarcopenia was a statistically significant risk factor for overall survival.
In addition to sarcopenia, we included other assessments of change in body composition, such as skeletal muscle mass to total fat area ratio and VSR. While skeletal muscle mass to total fat area ratio did not predict survival, patients with high VSR had higher mortality. In fact, recent studies demonstrated that visceral adiposity, represented by CT-measured VSR values, was associated with poor prognosis in various malignancies, such as colorectal cancer [22], melanoma [23], breast cancer [24], and esophageal cancer [25]. However, some other studies found that high visceral fat did not predict poor outcome [26,27]. After reviewing this literature, we decided to analyze the clinical significance of VSR using the IPTW method and the results indicated that high VSR was not associated with a lower survival rate.
The determination of the independent association of sarcopenia on survival among HCC patients had important implication for anti-sarcopenic treatment. In 2013, a randomized phase 2 trial which compared the effect of selective androgen receptor modulator therapy versus placebo in the treatment of cancer cachexia found that the lean body mass of patients in the treatment group significantly increased without serious toxic effects [28]. Studies which evaluate survival are underway for patients with non-small cell lung cancer [29]. A recent study by Sinclair et al. [30] demonstrated that testosterone therapy increased muscle mass in cirrhotic male patients without HCC, but no improvement in survival was observed. Our study results, which demonstrate the effect of sarcopenia on the survival of HCC patients regardless of cirrhotic status, may justify further studies investigating the use of anti-sarcopenic drugs in patients with HCC.
There are several advantages of our study. First, an experienced radiologist directly measured skeletal muscle mass and abdominal fat area with a dedicated workstation, in addition to detailed manual tracing, to maximize precision. Second, we employed rigorous statistical methodology to verify the effect of changes in body composition on survival, adjusting for tumor stage, liver dysfunction, and cirrhotic status.
Although this study had some limitations, which are inherent to retrospective studies, we tried to overcome some of these challenges through the application of rigorous statistical methodology. It is also important to consider the cutoff values for sarcopenia. Because the prognostic cutoffs for sarcopenia were specific to our patients, who had relatively leaner body composition than Western patients; further studies are needed to demonstrate whether these cutoffs are applicable to non-Asian HCC patients.
In conclusion, we demonstrated that the presence of sarcopenia was associated with overall survival in HCC patients, independent of tumor stage, degree of liver dysfunction, or cirrhotic status. The presence of sarcopenia can be easily determined by a single slice of a CT scan during routine diagnostic evaluation. Additional studies are needed to demonstrate whether anti-sarcopenic treatment in HCC patients prolongs the survival.
Electronic Supplementary Material
Supplementary materials are available at Cancer Research and Treatment website (http://www.e-crt.org).
Notes
Conflict of interest relevant to this article was not reported.
Acknowledgements
This work was funded in part by the Ministry of Science, Information & Communication Technology and Future Planning of Republic of Korea (Bio·Medical Technology Development Project No. 2016M3A9E8941665). The funder has had no role in the writing of this paper or the decision to submit the paper for publication.