Aberrant Epigenetic Modifications of LPHN2 Function as a Potential Cisplatin-Specific Biomarker for Human Gastrointestinal Cancer
Article information
Abstract
Purpose
Epigenetic alterations of specific genes have recently been identified as diagnostic biomarkers for human cancers. However, there are currently no standardized epigenetic biomarkers for drug sensitivity in human gastrointestinal cancer. Therefore, the aim of this study is to identify a novel epigenetic biomarker in gastrointestinal cancer.
Materials and Methods
Using bisulfite sequencing and pyrosequencing analysis, DNA methylation patterns of gastric, colon primary tissues and their cancer cells were analyzed, and histone modifications were analyzed using chromatin immunoprecipitation assay. In addition, cancer cells were exposed to cisplatin and treated with a DNA methyltransferase inhibitor.
Results
We report that in human gastric and colon cancers, latrophilin 2 (LPHN2) is silenced by epigenetic modifications, including CpG island methylation and aberrant histone modifications. We also confirmed that LPHN2 was silenced by DNA hypermethylation in primary gastric and colon tumor tissues compared to their normal counterparts. Interestingly, we found that cancer cells with methylated LPHN2 showed higher sensitivity to cisplatin. Also, 5-aza- 2′-deoxycytidine combined with cisplatin decreased the cytotoxicity of cisplatin in cancer cells with methylated LPHN2. In addition, LPHN2 knockdown in cancer cells with high LPHN2 expression sensitized these cells to the anti-proliferative effects of cisplatin.
Conclusion
In human gastrointestinal cancer, we found that LPHN2 is regulated by epigenetic modifications, and that cancer cells with lower LPHN2 expression show higher sensitivity to cisplatin. Therefore, the methylation status of LPHN2 is a potential novel epigenetic biomarker for cisplatin treatment in human gastric and colon cancers.
Introduction
Aberrant gene function and altered patterns of gene expression are typical features among various cancers [1]. In particular, epigenetic modifications, defined as heritable changes in gene expression not caused by changes in the DNA sequence, are increasingly identified as hallmarks of human cancers [1,2]. DNA methyltransferases (DNMTs) hypermethylate CpG islands, resulting in transcriptional silencing of various genes [3]. DNMTs catalyze the transfer of a methyl group to the carbon 5 position of cytosine residues in CpG dinucleotides. In addition to DNA methylation, histone modifications also help to organize the nuclear architecture in regulation of gene expression and gene activities [3]. Thus, DNA methylation cooperates with histone modifications to silence tumor suppressor genes during tumorigenesis [4].
Incidence and mortality of gastrointestinal cancers, including gastric and colon cancer, have increased globally [5,6]. Recent genome-wide epigenomic modification studies have reported various genes that are frequently inactivated by epigenetic modifications in gastric and colon cancer [7,8]. Interestingly, epigenetic modifications are being recognized as new therapeutic targets for treatment and prognosis of gastrointestinal cancers [9,10]. However, there are no standardized epigenetic markers which can serve as novel indicators for the chemosensitivity of human gastrointestinal cancer.
In this study, we found that latrophilin 2 (LPHN2), a member of the latrophilin subfamily of G-protein coupled receptors [11], is transcriptionally inactivated by DNA methylation and histone modifications in human gastric and colon cancer cells. Cancer cells with methylated LPHN2 showed higher sensitivity to cisplatin compared to cells without methylation, suggesting that the methylation status of LPHN2 may serve as a novel epigenetic biomarker for cisplatin chemosensitivity. The LPHN2 methylation status does not confer differential sensitivity to other chemotherapeutic agents; therefore, we propose that epigenetic modification of LPHN2 is a promising cisplatin-specific biomarker.
Materials and Methods
1. Cell culture
Eleven human gastric cancer cell lines and 15 human colon cancer cell lines were obtained from the Korea Cancer Cell Bank (Seoul, Korea). Cells were cultured in RPMI 1640 media supplemented with 10% fetal bovine serum and gentamicin (10 μg/mL) [12]. HCT116 and DKO cells, which were generous gifts from Dr. B. Vogelstein (Johns Hopkins University) [13], were cultured in McCoy’s 5A media.
2. Primary human gastric tissues
Twenty-four primary human gastric tumor tissues, ten primary human colorectal tumor tissues, and their matching normal tissues were obtained from Seoul National University Hospital. The study protocol was reviewed and approved by the Institutional Review Board of Seoul National University Hospital. After surgical removal, tissues were immediately frozen in liquid nitrogen and stored at –80°C until use.
3. Reverse transcription polymerase chain reaction (RT-PCR)and quantitative real-time RT-PCR
Total RNA was prepared using the TRI Reagent (Molecular Research Center, Cincinnati, OH) in accordance with the manufacturer’s instructions as previously described [14]. Briefly, cDNA was synthesized from 2 μg of total RNA using ImProm-II reverse transcriptase (Promega, Madison, WI) and amplified by RT-PCR using HotStart Taq (Qiagen, Valencia, CA) and gene-specific primers. 18S ribosomal RNA was used as an internal RT-PCR control. For quantitative real-time RT-PCR (qRT-PCR), cDNAs were amplified using Premix Ex Taq (TaKaRa, Tokyo, Japan), SYBR Green I (Molecular Probes, Eugene, OR), and a Step One Plus system (Applied Biosystems, Foster City, CA).
4. Bisulfite genomic sequencing analyses and pyrosequencing
Genomic DNA (gDNA) was isolated using the QIAamp DNA mini kit (Qiagen), and 1 μg gDNA was modified using the EpiTect Bisulfite Kit (Qiagen) according to the manufacturer’s instructions [15]. Sodium bisulfite-modified DNA was amplified using specific primer sets. PCR products were gelpurified and cloned into TA cloning vectors (RBC Bioscience, Taipei, Taiwan). Inserted PCR fragments of individual clones were then sequenced. For pyrosequencing analyses, bisulfite-modified gDNA was amplified using biotinylated primers specific for the LPHN2 CpG island. Preparation of single-stranded DNA template, annealing to the pyrosequencing primer, and pyrosequencing were performed using PyroGold Q96 SQA reagents with a PyroMark ID pyrosequencer (Qiagen) according to the manufacturer’s protocol. Pyrosequencing was performed using PyroGold Q96 SQA reagents with a PyroMark ID pyrosequencer (Qiagen) according to the manufacturer’s protocol [15].
5. Chromatin immunoprecipitation
Chromatin immunoprecipitation (ChIP) assays were performed as previously described [16]. Differences in DNA enrichment for ChIP samples were determined by qPCR using 2.5% of the precipitated sample DNA and 0.02% of the input DNA. PCR primers used for ChIP are available upon request. Briefly, cells were cross-linked with 1% formaldehyde for 10 minutes and incubated for 5 minutes at room temperature with 0.125 M glycine to terminate the reaction. Nuclei were prepared, digested with 50 U micrococcal nuclease for 15 minutes at 37°C, and sonicated to yield chromatin fragments (200-400 bp). The precleared chromatin was incubated overnight at 4°C with H3K4me3 (07-473, Millipore, Billerica, MA), H3K27me2 (07-452, Millipore), H3K9me3 (Ab8898, Abcam, Cambridge, MA), followed by incubation with protein A agarose (Millipore), which was pre-equilibrated with sonicated salmon sperm DNA and bovine serum albumin. Immunoprecipitated material was washed extensively, and the crosslinks were reversed. DNA from the eluted chromatin was purified by phenol extraction and ethanol precipitation.
6. Drug treatment and siRNA transfection
5-Aza-2'-deoxycytidine (5-Aza-CdR) was obtained from Sigma. Cells were seeded 24 hours before treatment and drugs were administered as noted in the figure legends. Predesigned siRNAs specific for LPHN2 were purchased from M-biotech (Hanam, Korea) and control siRNAs with scrambled sequences were obtained from Qiagen. To confirm whether LPHN2 expression affects chemosensitivity, siLPHN2 was transfected into DKO, SNU484, and SW480 cells for 8 hours using Lipofectamine 2000 (Invitrogen, Carlsbad, CA) according to the manufacturer’s instructions. Cells were subsequently plated into 96-well plates and cell viability assays were performed in the presence of cisplatin.
7. Cell growth inhibition assays
Tetrazolium dye (MTT; Sigma-Aldrich, St. Louis, MO) assays were used to evaluate the inhibitory effect of cisplatin or 5-Aza-CdR on cell growth. Cells were seeded in 96-well plates, incubated for 24 hours, and treated with cisplatin alone or in combination with 500 nM 5-Aza-CdR for 72 hours at 37°C. After drug treatment, MTT solution was added to each well and cells were incubated for 4 hours at 37°C before removal of the media. Cells were then treated with dimethyl sulfoxide (Sigma) and the absorbance of the converted dye in living cells was measured using a microplate reader (Versa-Max, Molecular Devices, Sunnyvale, CA) at a wavelength of 540 nm. Six replicate wells were used for each analysis and three independent experiments were performed.
Results
1. Epigenetic silencing of LPHN2 in human gastric and colorectal cancer cells
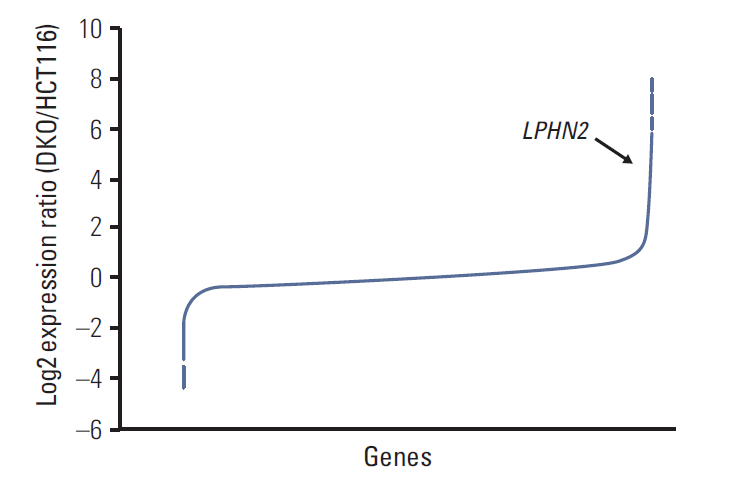
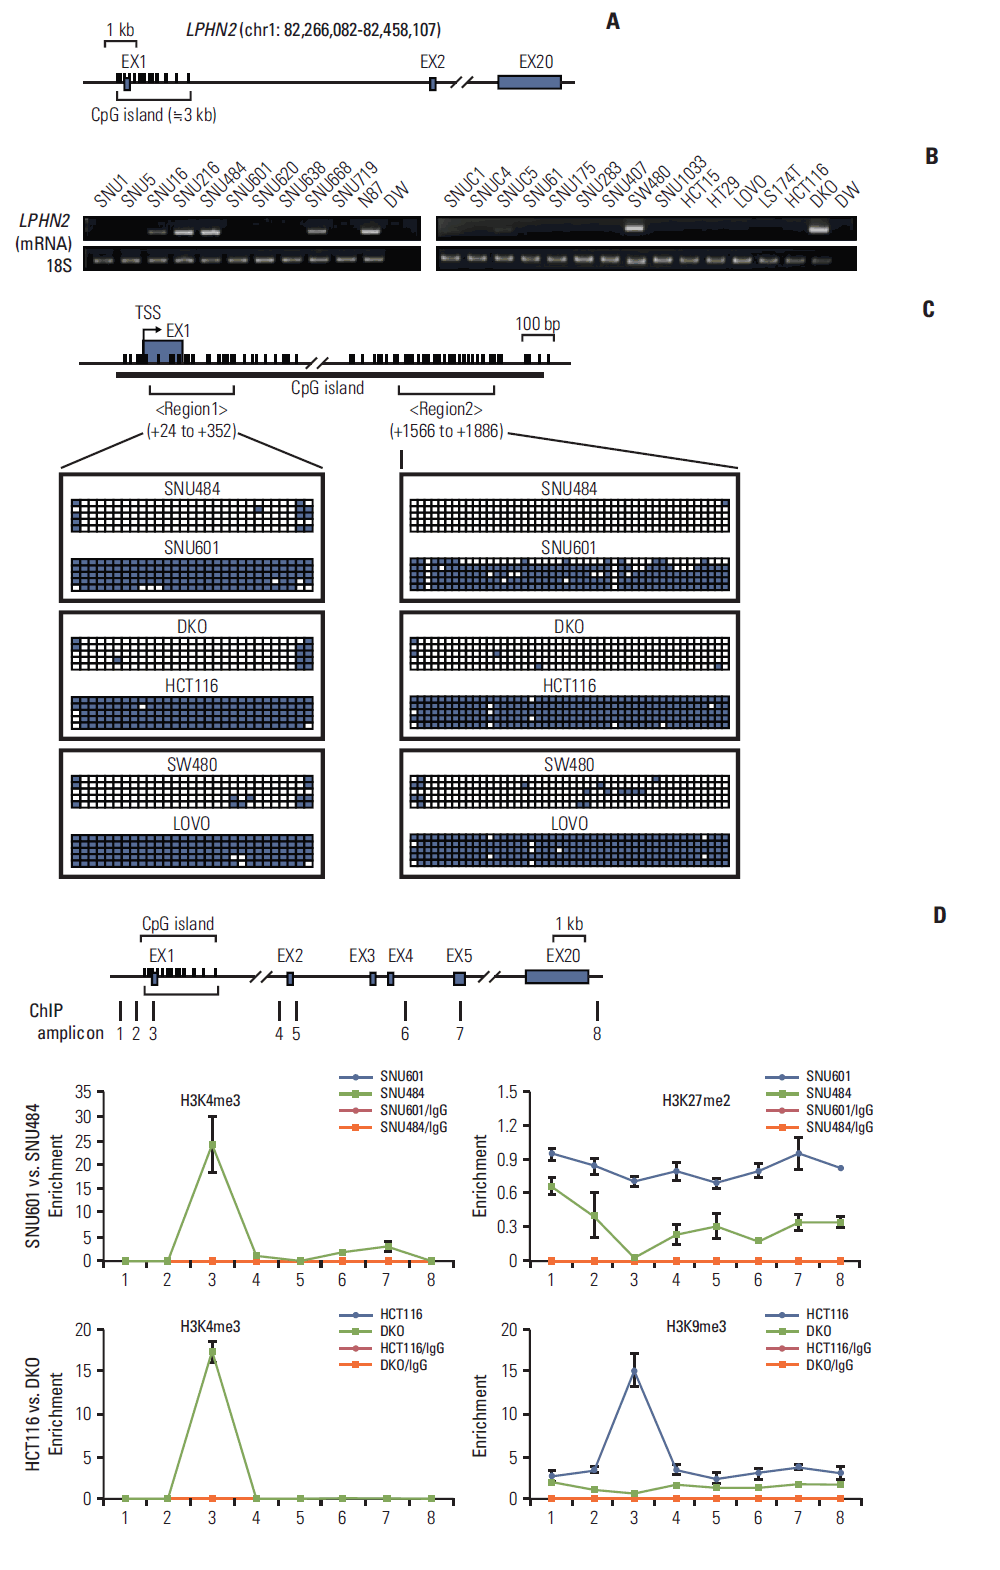
To identify novel genes silenced by DNA methylation, we compared the expression profile of HCT116 cells with that of DKO cells, which are DNMT1/DNMT3B double knockout HCT116 cells [13]. By comparing microarray expression data sets, we found 1,164 genes (log2 fold change > 2) whose expression was responsive to DNMT1/DNMT3B double knockout (Fig. 1). Among 1,164 differentially-expressed genes, 782 genes, including latrophilin (LPHN), a neuronal adhesion G-protein-coupled receptor (GPCR) [17], were up-regulated in DKO cells compared to control HCT116 cells (Fig. 1). Interestingly, we found that LPHN2 was silenced in six gastric and 13 colorectal cancer cell lines, respectively (Fig. 2A and B). LPHN2 has a CpG island located in the promoter and exon 1 region (Fig. 2A), therefore we investigated the question of whether DNA methylation is responsible for transcriptional silencing of LPHN2. In bisulfite sequencing analyses of the two CpG-rich regions within the LPHN2 CpG island, we found that SNU601 gastric cancer cells and HCT116, LOVO colon cancer cells, which show low LPHN2 expression, have heavily methylated CpG sites (Fig. 2C). In contrast, SNU484 gastric cancer cells and DKO and SW480, two colon cancer cells that express high levels of LPHN2, have no DNA methylation in the same region (Fig. 2C).

Microarray analyses of mRNA expression in HCT116 and DKO cells. Microarray analyses were performed in HCT116 cells and DNMT1/DNMT3B double knockout derivative DKO cells. Microarray data results are shown as the log2 expression ratio of genes between HCT116 and DKO. The black arrow indicates LPHN2.

DNA methylation and histone modifications of LPHN2 in human gastric and colon cancer cells. (A) Schematic representation of LPHN2. LPHN2 exons are indicated by gray boxes. Vertical bars represent each CpG site. The CpG island is indicated according to University of California Santa Cruz (UCSC) genome browser. (B) LPHN2 mRNA from 11 gastric cancer cell lines (left panel) and 15 colorectal cancer cell lines (right panel) was analyzed by reverse transcription polymerase chain reaction (RT-PCR). 18S ribosomal RNA served as an internal control. DW, distilled water. (C) Bisulfite genomic sequencing analyses of the LPHN2 CpG islands in SNU601, SNU484, HCT116, DKO, LOVO, and SW480 cells. Each row of squares denotes a single plasmid cloned and sequenced from polymerase chain reaction products amplified from bisulfitetreated gDNA. Open and filled squares represent unmethylated and methylated CpG sites, respectively. TSS, transcriptional start site. (D) Characterization of chromatin modification patterns around LPHN2. Chromatin immunoprecipitation (ChIP) assays were performed in SNU601, SNU484, HCT116, and DKO cells using antibodies specific for the active histone marker H3K4me3 and the inactive histone markers H3K27me2 and H3K9me3. Enrichment was measured using quantitative real-time RT-PCR. Error bars represent the standard error of the mean for triplicate chromatin preparations.
Histone modifications cooperate with DNA methylation in regulation of gene expression [18]. Therefore, we investigated the question of whether the transcriptional silencing observed in SNU601 and HCT116 cells was associated with histone modifications. In our ChIP experiments, consistent with LPHN2 mRNA expression levels (Fig. 2B), SNU601 and HCT116 cells were enriched for repressive histone marks, H3K27 di-methylation (H3K27me2) or H3K9 tri-methylation (H3K9me3), with low levels of active histone marks, H3K4 tri-methylation (H3K4me3) (blue line) (Fig. 2D). In addition, results of the ChIP assay from SNU484 and DKO cells showing high LPHN2 expression showed the opposite tendency compared to SNU601 and HCT116 cells (green line) (Fig. 2D). Taken together, these data suggest that widespread transcriptional silencing of LPHN2 may be caused by epigenetic alterations in human gastric and colon cancer cells.
2. Demethylation of the LPHN2 CpG island restores LPHN2 expression
To determine whether transcriptional silencing of LPHN2 was induced by de novo CpG methylation of the LPHN2 promoter region, cells were treated with the demethylating agent 5-Aza-CdR. LPHN2 expression was restored in a dose and time-dependent manner after treatment of SNU601 and HCT116 cells with 5-Aza-CdR (Fig. 3A and B).

Restoration of LPHN2 expression after treatment with 5-aza-2'-deoxycytidine (5-Aza-CdR). (A) SNU601 and HCT116 cells were treated with dimethyl sulfoxide (DMSO) or 5-Aza-CdR for 4 days. LPHN2 mRNA expression was measured using quantitative real-time reverse transcription polymerase chain reaction (qRT-PCR). Each value was normalized to 18S ribosomal RNA. Error bars represent the standard deviation (SD) for three independent RNA preparations. (B) SNU601 and HCT116 cells were treated with 5 μM 5-Aza-CdR for 5 days. LPHN2 mRNA and 18S ribosomal RNA expression was analyzed by reverse transcription polymerase chain reaction at the indicated times. DW, distilled water. (C) After treatment with DMSO or 500 nM 5-Aza-CdR, the quantitative methylation status of LPHN2 in SNU601 and HCT116 cells was determined by pyrosequencing. The location of analyzed CpG sites corresponding to the pyrosequencing primer set is indicated by arrows. Error bars represent the SD for three independent preparations of bisulfite-treated gDNA. *p < 0.05 using Student’s t tests. (D) Dynamics of histone modifications after 5-Aza-CdR treatment in SNU601 cells. Chromatin was prepared from SNU601 cells treated with DMSO or 5-Aza-CdR (500 nM) for 4 days. Enrichment of the active histone mark (H3K4me3) and inactive histone mark (H3K27me2) was measured using qRT-PCR. Data are presented as the mean±standard error of the mean for three independent chromatin preparations. 5aza, 5-aza-2'-deoxycytidine.
To confirm that reactivation of LPHN2 was the result of demethylation of LPHN2 CpG islands, the methylation status of the LPHN2 promoter region was analyzed using pyrosequencing analyses after treatment of SNU601 and HCT116 cells with 5-Aza-CdR. As shown in Fig. 3C, treatment with 500 nM 5-Aza-CdR reduced DNA methylation at the LPHN2 CpG islands in SNU601 and HCT116 cells (Fig. 3C).
Next, because histone modifications were also involved in epigenetic regulation of gene expression [19], we hypothesized that treatment with 5-Aza-CdR could dynamically affect histone modifications. Consistent with transcriptional reactivation and demethylation, results of ChIP assays showed enrichment of active histone markers (H3K4me3) near the LPHN2 coding region in SNU601 cells after 5-Aza-CdR treatment (Fig. 3D, left). Interestingly, inactive histone marks (H3K27me2) were also significantly enriched after treatment with 5-Aza-CdR (Fig. 3D, right), supporting the previous finding that promoter regions of methylated genes are frequently enriched by bivalent histone modifications in human cancer cells [20].
In summary, LPHN2 mRNA expression was restored after 5-Aza-CdR treatment, followed by demethylation of the heavily methylated CpG island of the LPHN2 promoter region. In addition, treatment with 5-Aza-CdR can dynamically affect histone modifications near the LPHN2 coding region.
3. Methylation status and LPHN2 mRNA levels in primary gastric and colon tumor tissues
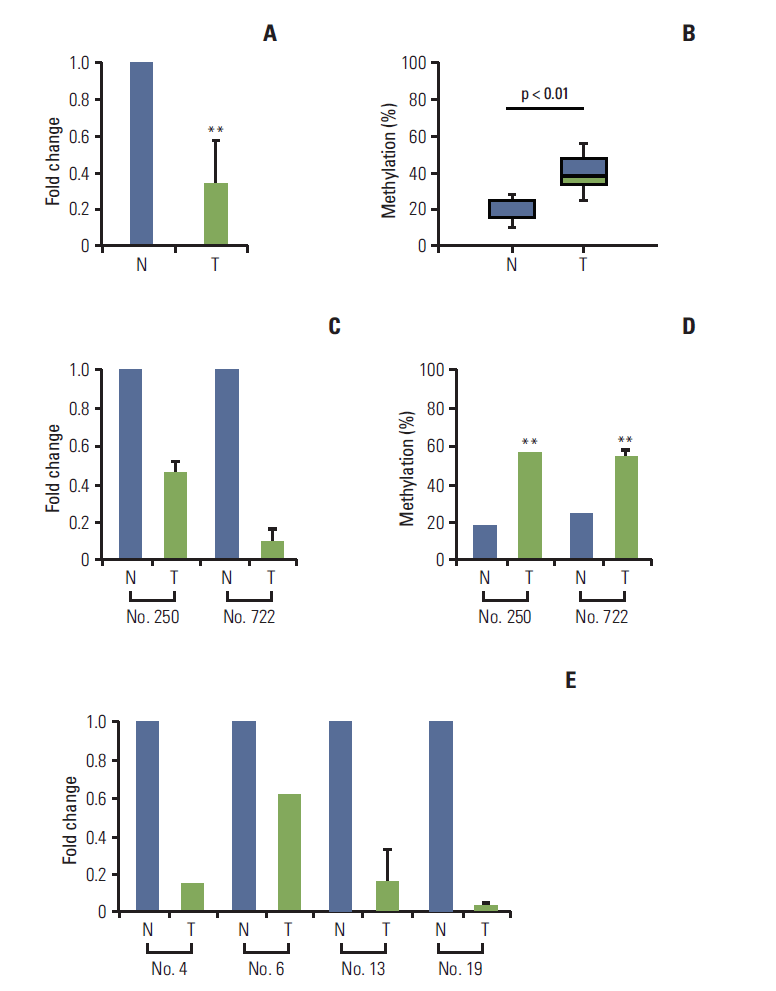
To determine whether DNA methylation-mediated transcriptional silencing of LPHN2 also occurs in human primary gastric tissue, analysis of LPHN2 mRNA expression and methylation status was performed using qRT-PCR and pyrosequencing. Compared with their normal counterparts, 18 of 24 primary gastric tissues (75%) showed low endogenous levels of LPHN2 mRNA (Fig. 4A).

Loss of LPHN2 expression in human gastric and colon primary tissues. mRNA expression in primary gastric tissues was analyzed using quantitative real-time reverse transcription polymerase chain reaction (qRT-PCR) and the methylation status of LPHN2 was confirmed via pyrosequencing analyses. Loss of LPHN2 mRNA expression was shown in 18 of 24 primary gastric tissues. (A) A summary of LPHN2 expression in 18 primary gastric tissues compared with normal tissues presented as fold change of relative mRNA expression. (B) Among 18 primary gastric tissues, nine of 18 showed hypermethylation of LPHN2 CpG islands compared to normal control tissues. The methylation ratio percentage is also presented as a box plot. (C) LPHN2 expression levels in primary gastric tissues were analyzed using qRT-PCR. LPHN2 expression was normalized to 18S ribosomal RNA and is shown as fold change relative to their normal tissue samples. Data are expressed as the mean±standard deivation. (D) Bisulfite-treated gDNAs from patient No. 250 and No. 722 were used to determine the methylation status of the LPHN2 promoter region using pyrosequencing analyses. (E) LPHN2 expression levels in primary colon tissues were analyzed by qRT-PCR and are shown as fold change relative to their normal tissue samples. N, normal tissue; T, tumor tissue. **p < 0.01 using Student’s t test.
Among these 18 primary gastric tissues, nine of 18 tissues (50%) have hypermethylated LPHN2 CpG islands (Fig. 4B). LPHN2 methylation in primary human gastric cancer tissues was also confirmed (Fig. 4C and D). These results indicate that transcription of LPHN2 is regulated by DNA methylation in human gastric cancer tissues. Similar results were obtained with human colon tumor tissues (Fig. 4E and data not shown).
4. Cancer cells with LPHN2 methylation exhibit higher sensitivity to cisplatin
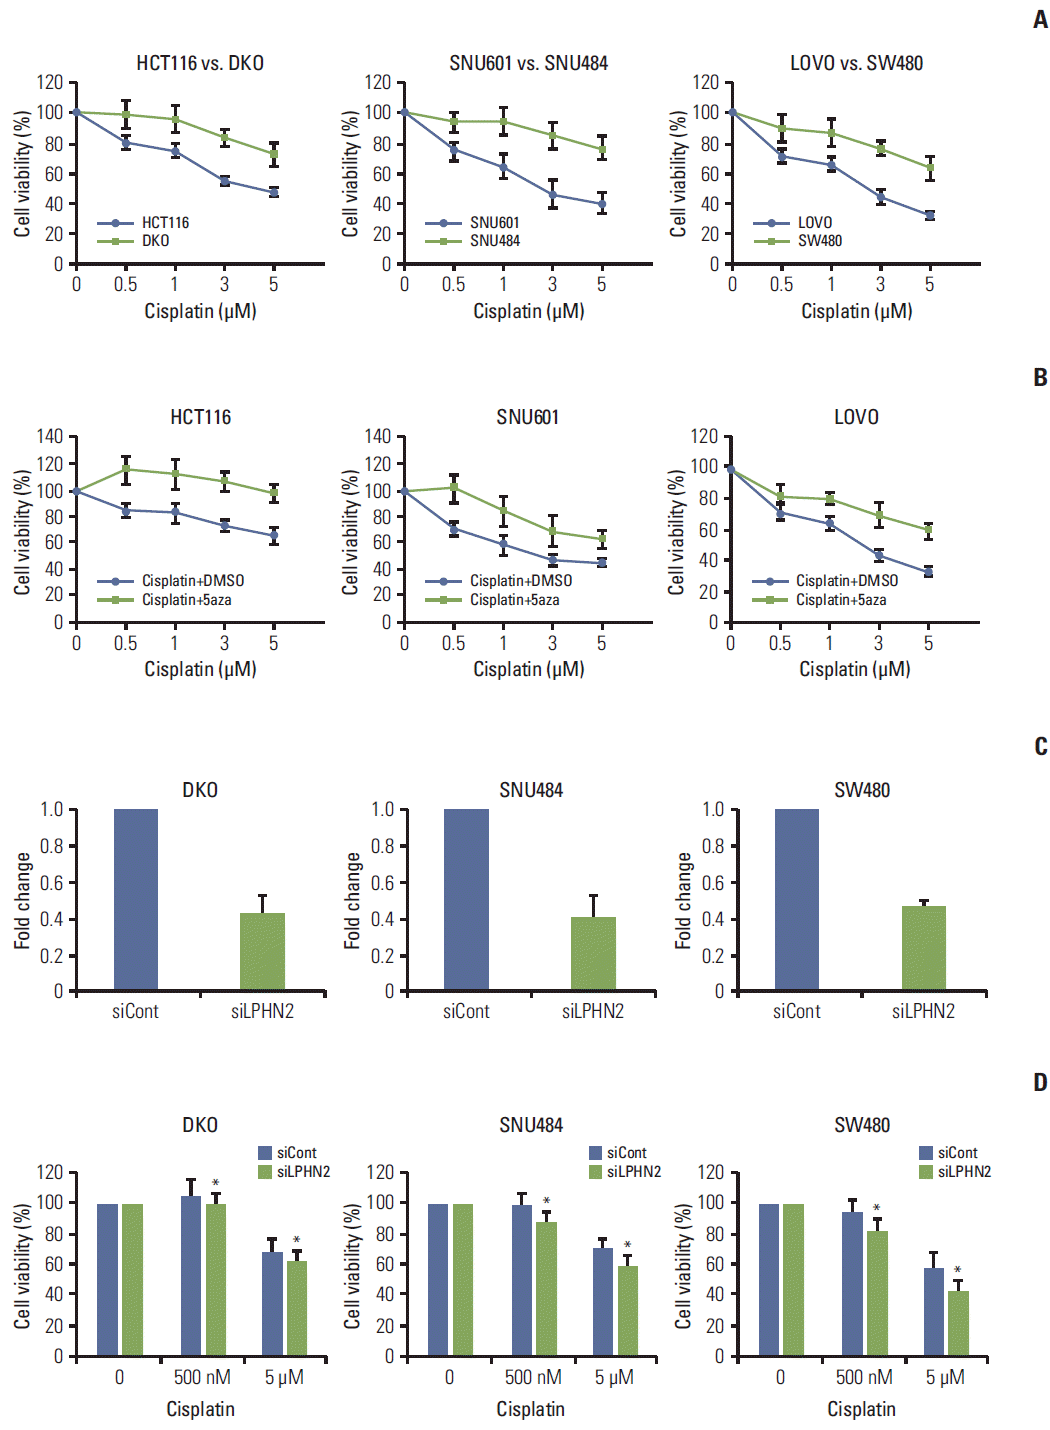
Next, we examined the question of whether LPHN2 methylation status could influence the chemosensitivity of cancer cells. First, HCT116 and DKO cells were exposed to increasing concentrations of cisplatin and cell viability was measured after 72 hours. Interestingly, DKO cells without LPHN2 methylation were more resistant to cisplatin than their parental HCT116 cells, with methylated LPHN2 (Fig. 5A, left panel). The LPHN2 methylation status and drug sensitivity to cisplatin were also compared in two gastric cancer cell lines (SNU601 and SNU484) and two colon cancer cell lines (LOVO and SW480). SNU601 and LOVO cells show a LPHN2 methylation pattern similar to that of HCT116 cells, whereas SNU484 and SW480 cells show a methylation pattern similar to that of DKO cells (Fig. 2). As expected, our results in SNU601 and LOVO cells were similar to results in HCT116 cells, and those in SNU484 and SW480 were similar to the results obtained in DKO cells (Fig. 5A, middle and right panels).

Methylation status of LPHN2 determines the differential response to cisplatin. (A) Cells were treated with increasing concentrations of cisplatin (0.5, 1, 3, or 5 μM) for 72 hours. Cell viability was confirmed using MTT assays. Cell viability is expressed as a percentage relative to untreated cells. Data represent the mean±standard deviation (SD) of three independent experiments. (B) Cells were treated with dimethyl sulfoxide or 500 nM 5-aza-2'-deoxycytidine in combination with different doses of cisplatin (0.5, 1, 3, or 5 μM). The number of viable cells was measured after 72 hours. Data are expressed as the mean±SD (n=3). (C, D) Cells were transfected with control or LPHN2-specific siRNAs for 8 hours. Cells were plated in 96-well plates, followed by cisplatin treatment (0.5 μM or 5 μM) for 72 hours. LPHN2 expression (C) and cell viability (D) were measured using quantitative real-time reverse transcription polymerase chain reaction and MTT assays, respectively. Error bars represent the SD (n=3, *p < 0.05). 5aza, 5-aza-2'-deoxycytidine.
Next, we investigated the combined effect of cisplatin and 5-Aza-CdR on the viability of HCT116, SNU601, and LOVO cells with methylated LPHN2. Treatment of cells with this drug combination had an attenuated inhibitory effect on cell growth compared with cisplatin only (Fig. 5B), suggesting that the methylation status of the genome may influence the chemosensitivity of cancer cells to cisplatin.
To further examine whether LPHN2 expression is responsible for the inhibitory effect of cisplatin on cell growth, knock down of LPHN2 expression was performed using LPHN2-directed siRNA (Fig. 5C). Cell viability was assessed after treatment with cisplatin for 72 hours (Fig. 5D). As shown in Fig. 5D, reduction of LPHN2 expression enhanced the anti-proliferative effects of cisplatin in DKO, SNU484, and SW480 cells. Taken together, these results suggest that the LPHN2 methylation status shows strong correlation with cancer cell chemosensitivity to cisplatin.
Discussion
LPHN, a neuronal adhesion GPCR, can stimulate neuronal exocytosis in vertebrates [11]. The LPHN gene family consists of LPHN1, LPHN2, and LPHN3 [17]. Among these, genetic alterations of LPHN2, which is believed to be a p53 target gene [21], are frequently observed in various human cancers [22,23]. In the current study, we observed DNA methylationmediated transcriptional silencing of LPHN2 in human gastric and colon cancer.
In comparison of microarray expression data sets, differential expression of LPHN2 was identified in HCT116 cells and DKO cells, the DNMT1 and DNMT3B double knockout derivative of HCT116 cells (Fig. 1). High LPHN2 expression in DKO cells, but not HCT116 cells, could be a presumed restoration of silenced genes mediated by the lack of DNMTs in DKO cells [13]. Results of our bisulfite sequencing analyses confirmed that gastrointestinal cancer cells with undetectable LPHN2 expression have hypermethylated LPHN2 CpG islands (Fig. 2). In addition, treatment with 5-Aza-CdR induced activation of methylated LPHN2 and altered histone modifications around the LPHN2 promoter (Fig. 3). LPHN2 methylation in primary human gastric cancer tissues was also confirmed (Fig. 4C and D), suggesting that DNA methylation-mediated transcriptional silencing of LPHN2 is a cancer-specific epigenetic event. Similar results were obtained with human colon tumor tissues (Fig. 4E and data not shown).
What is the functional significance underlying the DNA methylation-mediated transcriptional loss of LPHN2 in human cells? According to recent studies, increasing evidence indicates that the DNA methylation status can influence the anti-proliferative effects of DNA-damaging agents [24,25]. In addition, cancer cells showing compatibility with DNA methylation and repressive histone modifications can be used as a potential target for epigenetic therapies [10]. Interestingly, we found that cancer cells expressing high levels of LPHN2 were more resistant to cisplatin treatment than HCT116, SNU601, and LOVO cells, with methylated LPHN2 (Fig. 5). In addition, combined treatment with cisplatin and 5-Aza-CdR overcame the cytotoxicity of cisplatin in cancer cells with methylated LPHN2. siRNA-mediated down-regulation of LPHN2 expression increased the anti-proliferative effects of cisplatin in cancer cells expressing high levels of LPHN2 (Fig. 5C and D). However, the LPHN2 methylation status did not affect differential sensitivity to other chemotherapeutic drugs (data not shown). Therefore, our results strongly suggest that the methylation status of LPHN2 is a potential novel epigenetic biomarker for cisplatin treatment in patients with gastrointestinal cancer. However, further studies are required for evaluation of more sophisticated mechanisms regarding the effects of LPHN2 transcription level on cisplatin sensitivity.
In conclusion, we identified the molecular mechanism for transcriptional silencing of LPHN2. Our data highlight its functional role as an epigenetic biomarker for cisplatin treatment in gastrointestinal cancer.
Conclusion
We propose that epigenetic alterations induce transcriptional inactivation of LPHN2, which intensifies the response to cisplatin in human gastric and colon cancers. Thus, the methylation status of LPHN2 is a potential novel epigenetic biomarker for cisplatin treatment in human gastric and colon cancers.
Notes
Conflict of interest relevant to this article was not reported.
Acknowledgements
The authors are grateful to all members of our group for their helpful advice. This research was supported by a grant from the National R&D Program for Cancer Control(MOHW, 0720540), the Basic Science Research Program(MOE, NRF-2011-0021123), the Mid-career Researcher Program(MSIP, NRF-2013R1A2A2A01009297), and the Korea Health Technology R&D Project through the Korea Health Industry Development Institute (MOHW, HI14C1277),Republic of Korea.