A Study of Relationship of Atheroembolic Risk Factors with Postoperative Recovery in Renal Function after Partial Nephrectomy in Patients Staged T1-2 Renal Cell Carcinoma during Median 4-Year Follow-up
Article information
Abstract
Purpose
The objective of this study is to evaluate the relationship of atheroembolic risk factors with postoperative recovery of renal function after on-clamp partial nephrectomy (PN) with warm ischemia in patients with staged T1-2 renal cell carcinoma (RCC).
Materials and Methods
A total of 234 patients from 2004 to 2012 were included, and their clinicopathologic and operative parameters, including atheroembolic risk factors were reviewed retrospectively. Renal function, as determined by estimated glomerular filtration rate (eGFR) and measurement of serum creatinine level (Cr) at each scheduled follow-up for a median four years, was compared between the high-risk (HR) group (n=49, ≥ five risk factors) and the low-risk (LR) group (n=185, < five risk factors).
Results
Except for baseline renal function and number of risk factors for atheroembolism, differences in characteristics between groups were comparatively insignificant. At 3 months after the operation, Cr and eGFR differed significantly between the two groups (p < 0.05), but no differences were observed afterward. Significant deterioration from baseline in Cr and eGFR was observed in both groups at 1 month after the operation, with a greater change in the HR group (p < 0.05). From measurement to measurement, significantly faster deterioration in Cr and eGFR was observed in the HR group than in the LR group until 6 months after the operation (Cr: LR, 0.02 mg/dL and HR, 0.13 mg/dL; eGFR: LR, 1.50 mL/min/1.73 m2 and HR, 6.38 mL/min/1.73 m2; p < 0.05).
Conclusion
The presence of atheroembolic risk factors may negatively influence postoperative recovery of renal function after PN in patients with localized RCC.
Introduction
With recent advancements in diagnostic modalities and surgical techniques, a paradigm shift in treatment of small localized renal cell carcinoma (RCC) has resulted in replacement of radical nephrectomy (RN) with partial nephrectomy (PN) as standard of care [1,2], as PN has a similar clinical outcome but better preserves renal function, which reduces the postoperative risk of chronic kidney disease (CKD), defined as an estimated glomerular filtration rate [eGFR] < 60 mL/min/1.73 m2) and renal insufficiency [3,4].
Many factors influencing renal function after PN have been identified, including age; gender; baseline renal function; the presence of an underlying chronic disease such as hypertension, diabetes, or atherosclerosis; serum albumin and calcium; operative factors such as ischemia type and time; size of renal mass; and so forth [2,5-8]. Of all these factors, ischemia type and time are among the most important. The off-clamp method is known to be the best procedure for performing PN within an acceptably short time without causing ischemic renal injury [5,6]; however, it has the disadvantages of limited indication and posing multiple procedural difficulties. Another method of PN, the most widely used, is the on-clamp procedure, in which renal vessels are clamped for temporary prevention of blood flow into the affected kidney, facilitating renal repair. However, the clamp must be removed within 30 min due to the risk of postoperative injury to renal function [2,6].
While dissecting the renal hilum to expose renal vessels for clamping, clinicians frequently encounter atherosclerosis in these vessels, especially in elderly or severely obese patients. Dispersal of atherosclerotic plaques into the small and medium end arterioles of the affected kidney after declamping can cause ischemic infarction related to renal insufficiency; this was first reported in 1957 by Thurlbeck and Castleman [9] and remains an important intraoperative concern. Since then, the diagnostic entity known as atheroembolic renal disease has become well established, with multiple risk factors including male gender, age greater than 60 years, white racial background, hypertension, history of smoking, diabetes mellitus, and any type of atherosclerotic vascular disease; it commonly manifests as renal dysfunction in atherosclerotic patients or those at severe risk of atherosclerosis after vascular procedures such as angiography or vascular surgery [10]. Mayo and Swartz [11] reported that the risk of incidentally suspected atheroembolism increased when the number of atheroembolic risk factors was ≥ 5 among the identifiable substantive risk factors, suggestive physical findings, and supporting laboratory findings. They also suggested atherosclerotic cardiovascular disease, anticoagulant or thrombolytic therapy, angiography or angioplasty, vascular surgery, cardiopulmonary resuscitation, hypertension, diabetes, smoking history, hypercholesterolemia, age over 55 years, and male sex as substantive risk factors. Therefore, in this study, the effects of preoperative risk of atheroembolic renal disease on postoperative renal function were investigated in patients with localized RCC who underwent on-clamp PN with warm ischemia. This risk was evaluated according to the number of risk factors; patients with more than five risk factors were assigned to the high-risk (HR) group, and those with fewer than five were assigned to the low-risk (LR) group.
Materials and Methods
Approval of the study was obtained from the Institutional Review Board (IRB) of Seoul National University Hospital (No. 1302-116-471). Records of patients who underwent open PN between January 2004 and December 2012 were selected from the institutional RCC database of the Urology Department of Seoul National University Hospital. Patients’ written consent was not requested, as the IRB exempted the study from this procedure.
After exclusion of patients with a solitary kidney, metastatic RCC, bilateral RCC, any previous history of dialysis or renal surgery, or baseline CKD, 234 patients with clinically localized RCC and no signs of metastasis who underwent onclamp open PN with warm ischemia were included in this study; all surgeries were performed with curative intent by a single surgeon. All patients were followed up over at least 12 months and had disease-free resection margins of more than 2 mm.
Clinicopathologic, demographic, and intraoperative parameters, including baseline parameters of renal function and atheroembolic risk factors, were reviewed retrospectively. The baseline atheroembolic risk factors examined were diabetes; hypertension; hypercholesterolemia; male gender; age over 55 years; smoking history; body mass index ≥ 30 kg/m2; history of any type of atherosclerotic vascular disease, such as ischemic cardiac disease, cerebrovascular disease, abdominal aortic aneurysm, or peripheral vascular disease; history of vascular medical procedure; and antithrombolytic medication. Renal function was determined by eGFR, calculated using the Modification of Diet in Renal Disease (MDRD) equation based on routine measurements of serum creatinine (Cr) taken at baseline and at 1, 3, 6, 9, 12, 24, 36, 48, and 60 months after the operation [12]. Tumor appearance in the kidney was described using the criteria of the R.E.N.A.L. nephrometry score [13].
All statistical analyses were performed by two medical statisticians (A.Y. and K.M.K.) under the supervision of a third medical statistician (B.H.N.). Variables of the CKD and non-CKD groups at the last follow-up after PN were compared using a chi-square test or independent t test, as appropriate. After prequalification of baseline clinicopathological parameters with univariate analysis, significant factors were evaluated using logistic regression analysis to determine the association of the independent variables with CKD development.
The patients were grouped according to their number of risk factors for atheroembolism: more than five (HR) or fewer than five (LR) [10,11]. Comparisons between the LR and HR groups were performed using the chi-square test for qualitative variables and the independent t test or Wilcoxon ranksum test for quantitative variables as appropriate. Renal function, as measured using changes in serum Cr and eGFR from baseline and from the previously measured value, was compared between the HR and LR groups at each follow-up. The proportional-odds model was used to determine the odds ratios of magnitude of change in serum Cr and eGFR to risk of atheroembolic renal disease. All statistical analyses were performed by a specialist statistician (A.Y.) using Stata release 9.2 (Stata Corp., College Station, TX). The null hypothesis of no difference was rejected if the two-tailed p-value was less than 0.05.
Results
Overall mean age of 234 patients was 54.5±11.9 years; there were 168 men and 68 women. The mean tumor diameter was 2.9±1.3 cm, and the mean ischemia time was 29.7±11.8 minutes. During the mean follow-up period of 60.4±16.4 months, 15 patients (6.4%) developed postoperative CKD, in which the HR group (12.2%) had a significantly higher rate of about 2.4 times that of the LR group (4.9%) (Table 1).
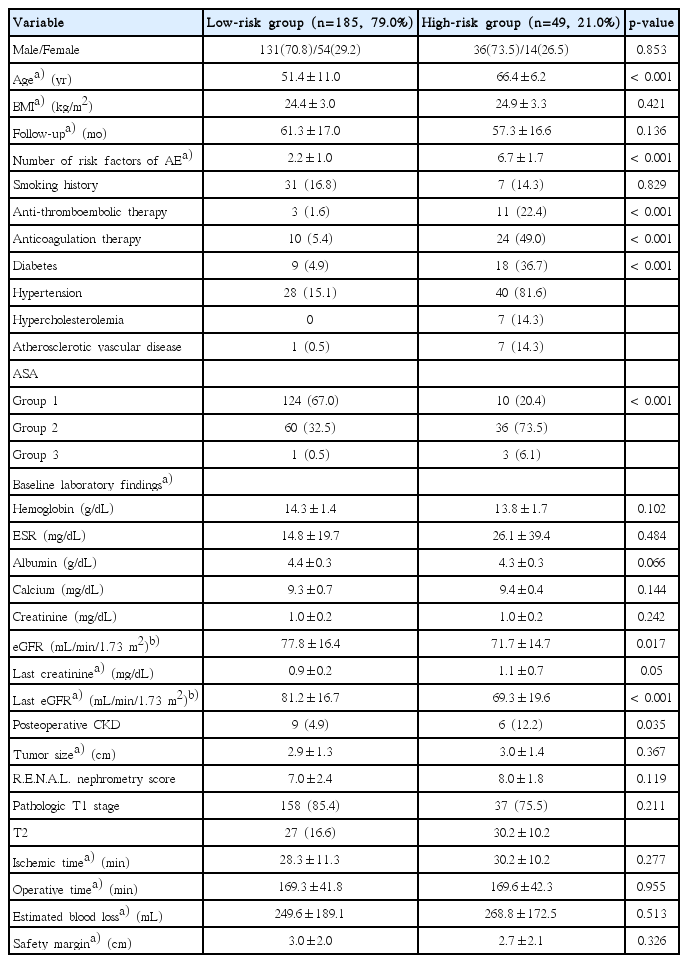
Baseline demographics of low- and high-risk atheroembolism groups
The LR group consisted of 185 patients (79.1%) with a mean of 2.2±1.0 risk factors for atheroembolic renal disease, and the HR group consisted of 49 patients (20.1%) with a mean of 6.7±1.7 risk factors. The HR group showed more underlying diseases, had undergone more medical procedures, and was older in comparison with the LR group (p < 0.001) (Table 1). Baseline eGFR was significantly lower in the HR group than in the LR group (LR, 77.8±16.4 mL/min/1.73 m2; HR, 71.7±14.7 mL/min/1.73 m2; p=0.017), although there was no significant difference in baseline serum Cr (p=0.242). At the end of the 5-year follow-up period, both Cr and eGFR were significantly different between the groups (Cr: LR, 0.9±0.2 mg/dL; HR, 1.1±0.7 mg/dL; p=0.05 and eGFR: LR, 81.2±16.7 mL/min/1.73 m2; HR, 69.3±19.6 mL/min/1.73 m2; p < 0.001).
Renal function, as measured by the mean values of Cr and eGFR, deteriorated from the first month of follow-up to the ninth month, with a significant difference between groups, after which they recovered to around baseline values (Fig. 1). Statistical comparison of changes in Cr and eGFR from baseline showed a significant difference between the two groups at 3-month follow-up (Cr: LR, 0.06±0.17 mg/dL; HR, 0.22±0.16 mg/dL; p=0.023 and eGFR: LR, –5.0±12.6 mL/min/1.73 m2; HR, –12.9±8.4 mL/min/1.73 m2; p=0.050) (not shown in tables, Fig. 1). As measured by changes in Cr and eGFR from the previously measured value, the worst renal function was observed between 3 and 6 months after the operation (Fig. 2). As shown in Fig. 2, changes in Cr and eGFR from 3 to 6 months after the operation differed more between the LR and HR groups than any other changes from measurement to measurement (Cr: LR, –0.02±0.11 mg/dL; HR, –0.13±0.16 mg/dL; p=0.043 and eGFR: LR, 1.50±10.22 mL/min/1.73 m2; HR, 6.38±10.06 mL/min/1.73 m2; p=0.036).
Mean creatinine (Cr) levels (A) and estimated glomerular filtration rate (eGFR) calculated using the Modification of Diet in Renal Disease (MDRD) equation (B) at the time of the postoperative follow-up of the high-risk and low-risk groups of atheroembolism are shown along with their comparative p-values for each follow-up month. sCr, serum creatinine; RF, risk factors.
Postoperative changes in the mean creatinine (Cr) levels (A) and estimated glomerular filtration rate (eGFR) calculated using the Modification of Diet in Renal Disease (MDRD) equation (B) differences compared to the baseline values are shown along with the comparative p-values for each follow-up month between high- and low-risk groups of atheroembolism. sCr, serum creatinine; RF, risk factors.
For the HR group, the odds ratio of Cr to risk of atheroembolic renal disease decreased from 1 to 3 months after the operation (from 0.58 to 0.15) compared with the LR group, while that of eGFR to risk of atheroembolic renal disease increased (from 1.57 to 3.69) (Table 2). As postoperative changes in Cr became greater and therefore worse, the risk of atheroembolic renal disease increased proportionally and was greatest at 3 months after the operation; this was not significant (p > 0.05) (Table 3). By 6 months after the operation, changes in Cr (LR, –0.03±0.14 mg/dL; HR, 0.14±0.75 mg/dL; p=0.113) and eGFR (LR, –1.4±15.7 mL/min/1.73 m2; HR, –0.7±15.5 mL/min/1.73 m2; p=0.776) were not significantly different between groups (not shown in the tables).

Correlation analysis between atheroembolic risk and severities of postoperative renal functional change via serum creatinine and eGFR-MDRD

Proportional odds model of postoperative serum creatinine and eGFR-MDRD change to their baseline values in relation to atheroembolic risks
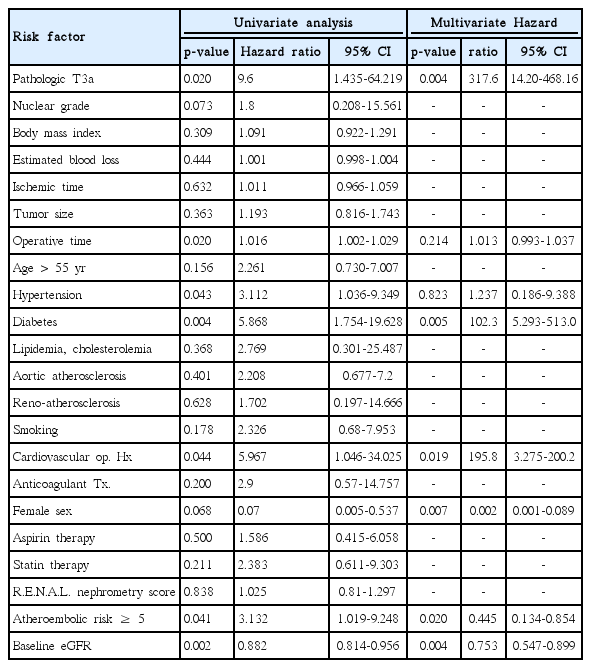
Additional logistic regression analysis of the risk factors for development of CKD showed diabetes (hazard ratio, 102.3), female gender (hazard ratio, 0.035), pathologic T3a (hazard ratio, 317.6), cardiovascular operative history (hazard ratio, 195.8), baseline eGFR (hazard ratio, 0.753), and number of atheroembolic risks ≥ 5 (hazard ratio, 0.445) as significant risk factors (p < 0.05) (Table 4).
Logistic regression analysis of risk factors for development of chronic kidney disease after partial nephrectomy with warm ischemia
Discussion
Confirmation that the prognosis of PN is similar to that of RN led to a change in the guidelines for treatment of localized RCC, and as a result of surgeons’ universal focus on postoperative quality of life, postoperative preservation of renal function is now considered much more important than previously [4]. Multiple studies have found risk factors influencing postoperative renal function similar to our results with significant diabetes, gender, preoperative eGFR and pathologic T stage and attempted to evaluate measures to protect against them and encourage early recovery [2]. Atherosclerosis is one such factor, and the effect of the vascular clamping procedure on atherosclerotic renal vessels has become an interesting subject for urologists interested in renal function outcome after PN [14,15]. In this study with 234 patients, multivariate analysis of postoperative CKD showed that, from among multiple atheroembolic risks for development of CKD after PN, diabetes (hazard ratio, 102.3), female gender (hazard ratio, 0.035), pathologic stage T3a (hazard ratio, 317.6), cardiovascular operative history (hazard ratio, 195.8), baseline eGFR (hazard ratio, 0.753), and ≥ 5 atheroembolic risks (hazard ratio, 0.445) were significant risk factors (Table 4). The number of atheroembolic risks ≥ 5 proved to be a significant independent risk factor and its inverse hazard ratio showed that there were multiple other risk factors in the analysis that needed to be correlated with the number of atheroembolic risks and all atheroembolic risk factors altogether produced an inverse hazard ratio. However, univariate analysis showed a hazard ratio of 3.132 which should be considered for the hazard ratio of atheroembolic risk > 5 independently significant for the risk factor for renal functional recovery after PN.
Because the on-clamp procedure with warm ischemia is the most frequently used method of PN, and the number of RCC patients older than 60 years undergoing PN has increased, clinicians using this method now encounter sclerotic renal vessels more frequently, and the possibility of breakdown and dispersal of atherosclerotic plaques causing postoperative atheroembolic renal infarction and renal insufficiency is drawing increasing attention and concern. With the aim of determining the effect of risk factors for atheroembolic renal disease on postoperative recovery of renal function, this study examined two groups of patients, who were classified as being at high or low risk of the disease according to number of risk factors [10,16,17].
Approximately 76%-77% of cases of atheroembolic renal disease may arise as complications of vascular procedures [9,10,16-18]. Manual manipulation of a vessel during a vascular procedure may cause small cholesterol crystals to fracture off ruptured atherosclerotic plaques from proximal regions of the vasculature, which may result in development of a peripheral embolism [9]. Such microemboli are commonly associated with development of multifocal ischemic lesions, leading to reversible or irreversible organ dysfunctions such as acute or chronic renal insufficiency [11]. Thus, recognition and avoidance of factors and procedures that may precipitate or perpetuate this disease is critical.
In this study, multivariate analysis of renal function after PN showed that only diabetes, gender, pathologic stage T3a, cardiovascular operative history, baseline eGFR, and ≥ 5 atheroembolic risks were significant risk factors, whereas other atheroembolic risk factors such as hypertension, age, smoking, and hyperlipidemia were not (Table 4). However, when the patients were grouped based on the aggregate number of atheroembolic risks, the postoperative renal functional recovery and the incidence of CKD development differed significantly. In this study, in the HR group, 49 patients (20.1%) underwent manipulation of sclerotic renal vessels during the warm-ischemia procedure, and postoperative CKD incidence (n=6, 12.2%) was 2.5 times higher compared with the LR group (n=9, 4.9%) (Table 1).
The on-clamp method of PN can cause spontaneous dislodging of atheromatous material as a result of blood reperfusing the kidneys at high pressure after declamping of the renal arteries. Renal atheroembolism, that is, occlusion of renal arterioles and glomerular capillaries by cholesterol crystals originating from atheromatous plaques of the renal arteries, may result in temporary renal dysfunction or permanent failure [9,10,16].
As currently understood, the course of atheroembolic renal disease begins with acute onset within 1 week of an event that causes massive migration of cholesterol crystals in the bloodstream, resulting in microcrystalline angiitis of small arterioles of 150-200 mm in diameter [11,16]. The subacute phase begins within two to four weeks of the initial event and involves recurrent embolic showers and inflammatory endothelial reactions [2,3,7,11,15], followed by a chronic, slowly progressive phase of nephroangiosclerosis or ischemic nephropathy [10,19]. Thus, progressive renal dysfunction develops in a stepwise manner over a period of several weeks after the inciting event. Shortly after the cholesterol crystals become lodged an arteriole, polymorphonuclear leukocytes and eosinophils infiltrate the affected arteriole [6,10,15]. Thrombus formation then occurs, along with endothelial proliferation and intimal fibrosis, leading to arteriolar obstruction. The time between the triggering event and the onset of renal insufficiency suggests a causal role for recurrent embolic showers and inflammatory endothelial reactions [20]. In this study, because of the great variability among renal inflammatory reactions, Cr or eGFR was not measured during the first month after the operation. After PN, renal function should be monitored closely for 1 month after surgery with regular follow-up afterward for monitoring of recovery or deterioration [4,8,10].
In this study, despite comparatively insignificant differences in characteristics of renal mass including size, location, appearance, and operative parameters including ischemia time between groups, the HR group showed greater deterioration and slower recovery of renal function postoperatively than the LR group (Fig. 1). The degree of atherosclerosis of renal arteries might be presumed to affect the risk of atheroembolism resulting from the vascular clamping procedure and thus the postoperative recovery of renal function and the recovery patterns of the two groups were clearly different. Thus, a tentative explanation for this difference might be that patients in the HR group were more likely to suffer atheroembolic plaque dislodgment into the small and medium renal arterioles during the clamping procedure, resulting in parenchymal ischemia and causing more aggressive renal deterioration.
Similar patterns of change in renal function were observed in the HR and LR groups. Renal function showed deterioration until 6 months after the operation, with the greatest decline from 1 to 3 months (Fig. 1). From 6 months onward, the rates of change slowed down in both groups, and changes in renal function from measurement to measurement became similar between the groups. The last measurements of Cr and eGFR showed that renal function had recovered to around baseline levels in both groups.
Initial deterioration of renal function after PN may continue into the early sixth month as a result of the inflammatory healing process of injured renal parenchyma and the loss of the parenchyma removed in the operation. A variety of inflammatory factors and cytokines will be secreted in the process of repairing the renal damage contralateral kidney and the remnant of the affected one must compensate for the loss of function resulting from the nephrectomy. Therefore, until 6 months after the operation, all possible renal protective measures should be considered, and all nephrotoxic medical therapies and imaging work-ups using nephrotoxic contrast dye should be avoided, especially in patients at high risk of atheroembolism.
After 5 years, renal function in both groups had eventually recovered to approximately or slightly less than that at baseline (Figs. 1 and 2). There are two possible explanations for this. First, in cases in which the contralateral renal function was normal, the contralateral kidney likely compensated for the postoperative loss of renal function [21,22]. Second, the preoperative and postoperative remnant kidney volume and removed kidney volume have been shown to affect the recovery of renal function [23-25]. However, in this study, the majority of our patients had a renal tumor less than 4 cm in diameter; in addition, there was an insignificant difference in safety margin of less than 5 mm in both groups (not in tables; LR, 3.0±2.1 mm vs. HR, 2.7±2.1 mm; p=0.654). Therefore, overall renal function might not have been significantly affected.
Based on this study, one conclusion regarding surgical technique might be that use of other methods, such as off-clamp procedures, to induce warm ischemia without causing mechanical trauma to sclerotic vessels is preferable, especially in HR atherosclerotic patients. Off-clamp procedures suggested in the literature include selective embolization of tumor-feeding renal arteries, enucleation, and tourniquet clamping for polar masses [2]. However, given their indication only in certain tumor types in particular locations and the risks they carry (massive intraoperative bleeding, major postoperative complications, difficulties in repairing the parenchyma and collecting system, violation of resection margin owing to insufficiently clear view of the area being operated on) [5], off-clamp methods are not widely used. Another suggestion for patients at high risk of atheroembolism is to restrict exposure to precipitating factors. In addition, the aim of medical intervention should be to provide optimal treatment of associated hypertension and cardiac dysfunction [10,18]. Some studies have also suggested the use of statin in patients at high risk of atheroembolic renal disease in order to stabilize and reduce plaque through lipid-lowering and anti-inflammatory mechanisms [17].
Our study has some limitations. First, although this is the first dedicated report on the risk of atheroembolism during recovery after PN, further randomized prospective studies with larger sample sizes are needed, which should include patients in whom atheroembolism has been confirmed by biopsy of the kidney or other regions. Second, the known risk factors for atheroembolic renal disease were examined in aggregate, and their individual effects on recovery of renal function and risk of atheroembolism were not assessed. Further studies should include correlation analysis or multivariate analysis of these factors, along with other potentially influential factors such as biochemical parameters, medications, and nutritional state. In addition, a more accurate tool for assessing renal function is needed.
Conclusion
The presence of risk factors for atheroembolic renal disease may negatively influence postoperative recovery of renal function after on-clamp PN with warm ischemia. Therefore, renal protective measures and thorough follow-up are recommended for 6 months after PN in patients at high risk of atheroembolism.
Notes
Conflict of interest relevant to this article was not reported.