Introduction
Gastric cancer is a common disease with > 1 million cases worldwide in 2020, ranking fifth in incidence and fourth in mortality [1]. In Korea, due to screening gastroscopy, ~70% of the newly diagnosed gastric cancers are early gastric cancer (EGC), for which endoscopic resection (ER) represents an excellent treatment. Indeed, ER has a comparable overall survival to surgery, as well as additional benefits in terms of complications and hospital stay.
The most important factor in determining the initial treatment of EGC is lymph node metastasis (LNM). The absolute indication for ER for EGC is differentiated-type mucosal adenocarcinoma with a diameter ≤ 2 cm and without ulcerative findings [2,3]. The expanded criteria of ER are as follows: (1) differentiated-type mucosal cancer with a diameter > 2 cm and without ulceration, (2) differentiated-type mucosal cancer with ulceration and < 3 cm in diameter, (3) undifferentiated-type mucosal cancer with < 2 cm in diameter and without ulceration, and (4) differentiated-type SM1 submucosal cancer (< 500 μm from the muscularis mucosa) with < 3 cm in diameter. Recently, the Japanese Gastric Cancer Association (JGCA) published the 2nd edition of guidelines for ER of EGC, and endoscopic curability after ER was classified into four categories eCuraA, eCuraB, eCuraC-1, and eCuraC-2 [4]. Among them, eCuraC-2 requires surgical treatment because of the high risk of LNM. However, both the expanded criteria and the eCura system also tend to include ER indications too strictly, which has led to a demand for more sophisticated criteria. To accurately predict the subgroup in which endoscopic submucosal dissection (ESD) is feasible, it is important to identify risk factors for LNM in EGC [5–7].
The logistic regression (LR) model is the most well-known predictive model in the medical field [8,9]. Several studies have performed LR analysis for intramucosal gastric signet ring cell (SRC) cancer and have created a risk score system or nomogram before verifying it with a validation set [10,11]. Recently, the research on predictive models using artificial intelligence-driven machine learning methods in various fields of medicine [12–15]. One study compared several machine learning methods in poorly differentiated intramucosal gastric cancer [16]. Another study reported that XGBoost and support vector machine (SVM) models improved the prediction rate of non-curative resection in ESD patients [17].
Among machine learning methods, those belonging to the decision tree family are considered superior to other methods [18]. Decision tree methods have advantages in explainability, as well as improved performance through bagging and boosting methods. Bagging is a method to make predictions through voting after constructing each tree model by extracting the training data differently through bootstrap sampling several times. The random forest model is representative of bagging tree model [19]. Among boosting methods, which are considered to have superior performance compared to the bagging method, a gradient boosting machine (GBM) is a representative method of learning by assigning a higher weight to misclassified samples, while XGBoost and lightGBM are models known to implement this method. In particular, the XGBoost model shows an advantage in explaining the prediction process because it can identify the features that have a strong influence on the model prediction among each feature using a method called SHapley Additive exPlanations (SHAP) [20,21].
However, no previous research has developed and validated a model for predicting LNM in EGC using the latest high-performance machine learning techniques and applied it to clinical practice. Therefore, we constructed a model for predicting LNM in EGC using LR and GBM models, evaluating the performance in internal and external validation cohorts and comparing it to the expanded criteria.
Materials and Methods
1. Patients and data collection
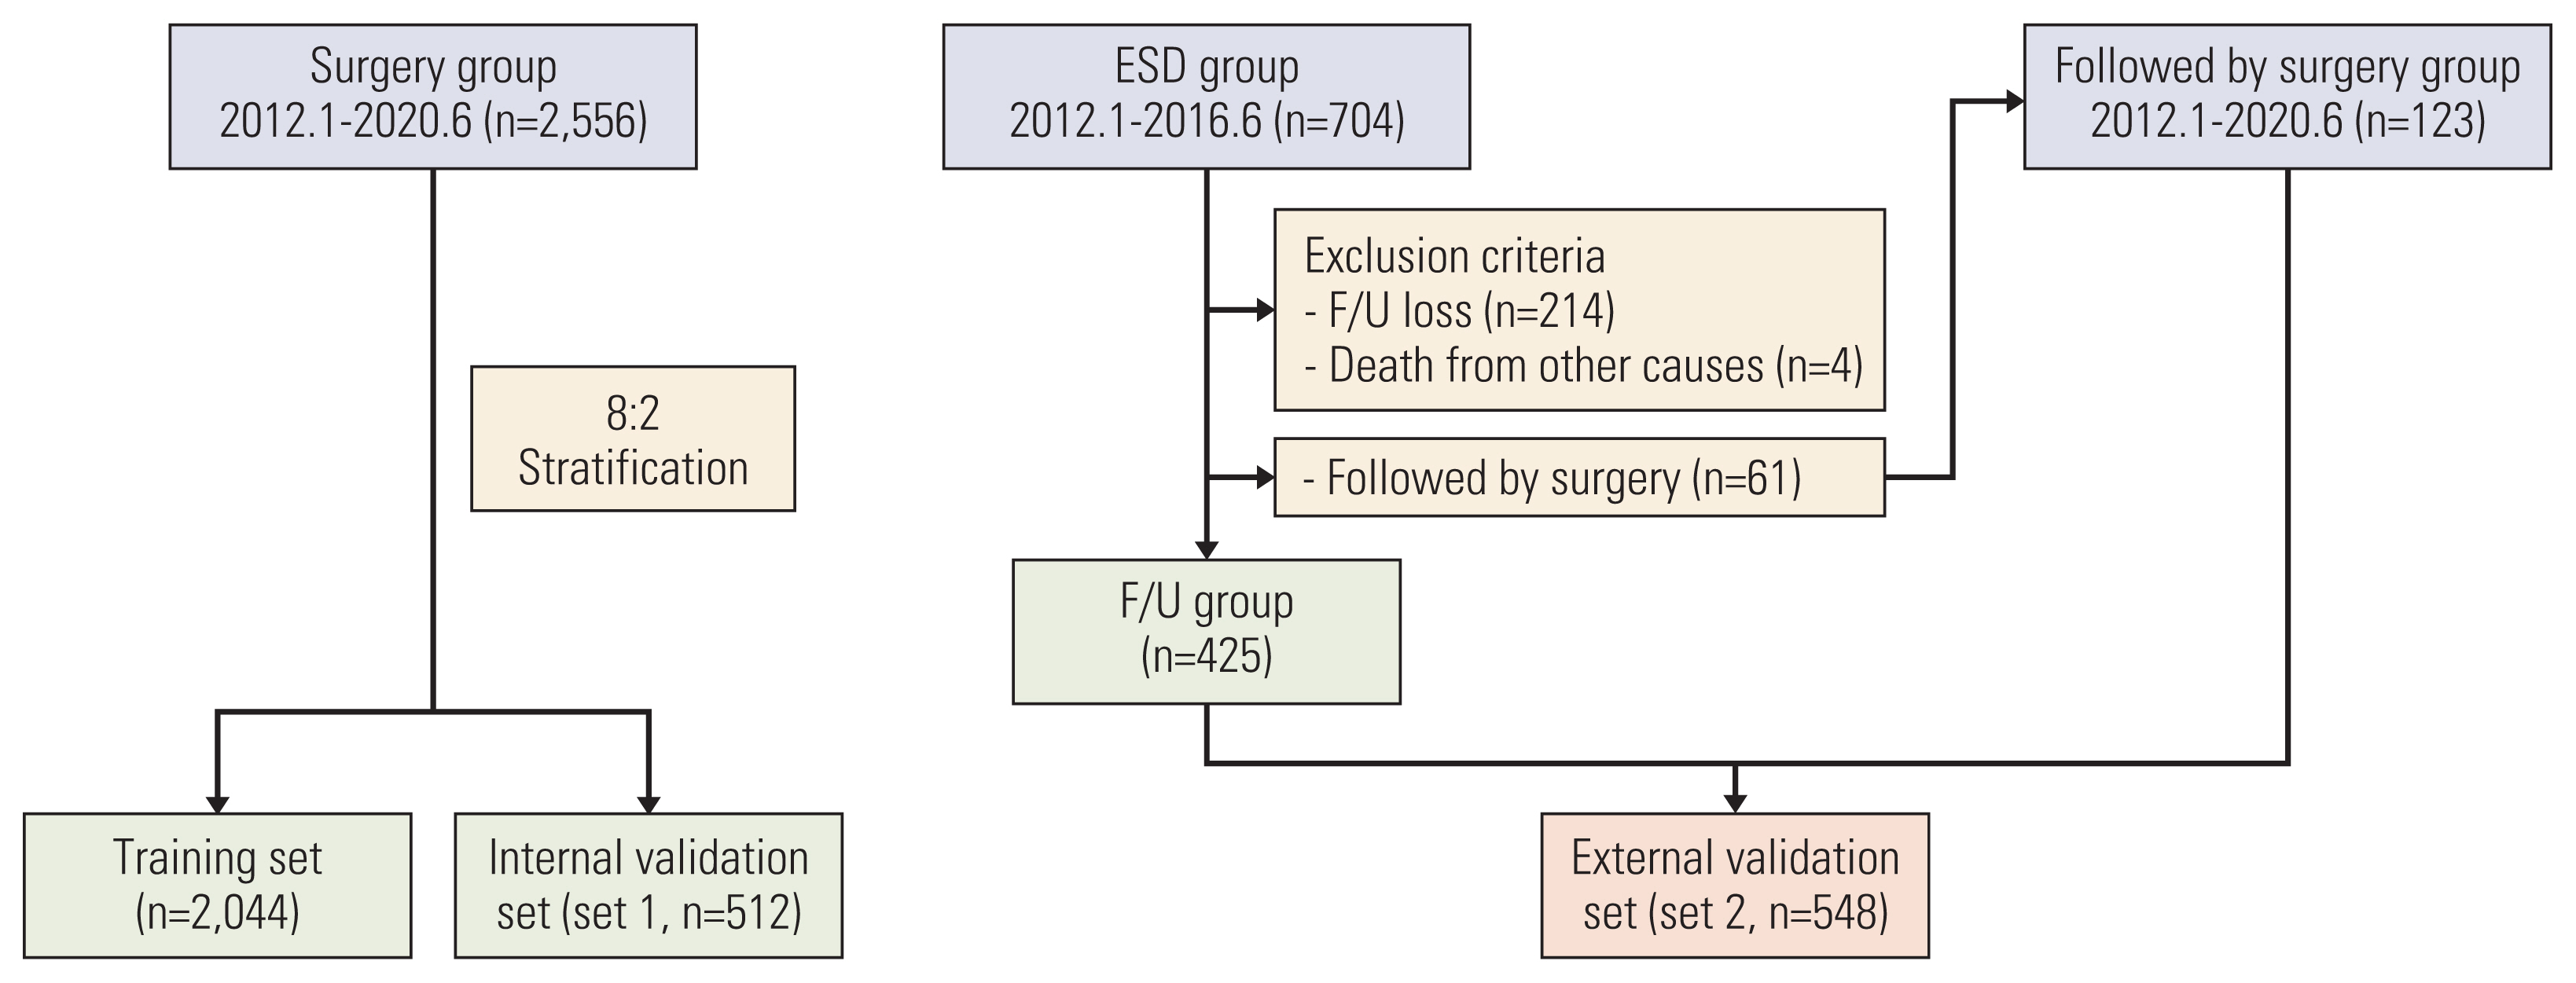
To train and validate the predictive models, we included the clinicopathological data of 2,556 patients who underwent gastrectomy for EGC at Seoul National University Bundang Hospital from January 2012 to June 2020. Furthermore, 704 patients who underwent ESD for EGC between January 2012 and June 2016, and 123 patients who underwent gastrectomy within 6 months of ESD from 2012–2020 were retrospectively reviewed.
The 2,556 patients with EGC who underwent surgery were stratified so that there was no significant difference in features between the two groups before dividing them into a training set (n=2,044) and an internal validation set (set 1, n=512) at a ratio of 8:2. In the external validation set (set 2, n=548), among 704 patients who underwent ESD for EGC during the same period, 214 subjects who did not meet the 5-year follow-up period or were lost to follow-up, 61 patients who underwent radical gastrectomy within 6 months and had complete but non-curative resection of ESD followed by surgery, and four patients who died from other causes within 5 years were excluded. A total of 425 patients were included in set 2; these included 424 with no LNM or distant metastasis on computed tomography (CT) and no abnormal findings during endoscopic follow-up for 5 years, and one patient (0.2%) with LNM confirmed during follow-up. Patients with metachronous gastric cancer confirmed during the 5-year follow-up were included. A further 123 patients who underwent surgery within 6 months of ESD for complete but non-curative resection of EGC (eCuraC-2) were included in set 2.
2. Prediction model development
Two machine learning algorithms, namely the LR model and GBM model, were constructed to predict LNM in EGC. The training set (n=2,044) was used to train the two models, validation was performed using set 1 (n=512), and the model was tested with set 2 (n=548). The process of model development is illustrated in Fig. 1.
Age, sex, cancer size, depth, location, differentiation, lymphovascular invasion (LVI), perineural invasion, and ulcers were used as features to construct the two predictive models. Age was divided into four groups: < 45, 45 to < 60, 60 to < 75, and ≥ 75 years. Depth was divided into mucosa (M), submucosa 1 (SM1) (< 500 μm), and submucosa 2 (SM2) (≥ 500 μm). Regarding differentiation, well and moderately differentiated adenocarcinomas were classified as “differentiated,” while poorly differentiated adenocarcinoma, poorly cohesive carcinoma (SRC or others), and mixed carcinomas were classified as “undifferentiated.” In addition, gastric carcinoma with lymphoid stroma (GCLS) was classified as undifferentiated, micropapillary adenocarcinoma as differentiated, and mucinous adenocarcinoma as either differentiated or undifferentiated depending on the morphology of tumor cells regardless of the presence or absence of extracellular mucin. LVI, perineural invasion, and ulcers were pathologically defined.
First, using LR, univariate analysis was performed with each variable in the training dataset (n=2,044) as the independent variable and LNM as the dependent variable. Multivariable analysis was performed with nine variables, including age, sex, cancer size, depth, location, differentiation, LVI, perineural invasion, and ulcer as independent variables and LNM as a dependent variable.
Next, the training dataset was trained using the GBM method, in which age, sex, size, depth, location, differentiation, LVI, perineural invasion, and ulcer were used as features. To maximize the performance of the prediction model and prevent overfitting, the hyperparameters were adjusted using both the grid search method and the Bayesian optimization algorithm. A hyperparameter is a parameter that the developer can control in the model, such as the maximal depth and minimum child weight in the tree model. Using the SHAP value, we analyzed and listed the importance of features in predicting LNM in the GBM model.
3. Comparison with the Japanese eCura system of ESD
The two prediction models were compared with the eCuraC-2 in terms of accuracy, sensitivity (recall), specificity, positive predictive value (precision), negative predictive value, area under the receiver operating characteristic (ROC) curve (AUROC), area under the precision-recall curve (AUPRC), and F1-score in set 2. In both models, the threshold was the same as the sensitivity of the eCuraC-2, and the accuracy, sensitivity, and specificity were calculated. The performance of the two models was compared to that of the eCuraC-2 after their sensitivities were set to that of the eCuraC-2.
4. Development tool and statistics
The LR and GBM models were implemented using the Python scikit-learn package, including XGBoost, and statistical packages, including the Python SciPy package, were used for statistical analysis. We obtained the feature importance of the GBM model using the SHAP Python package to determine how each feature influences the decision. Among the training, internal validation, and external validation sets, continuous variables such as age, size, and total harvested lymph nodes were analyzed using ANOVA, and categorical variables were analyzed using the χ2 test. Statistical significance was set at p < 0.05.
Results
1. Study population
Fig. 1 shows the flowchart of the study. The clinicopathological characteristics of the training, internal validation (set 1), and external validation (set 2) groups are shown in Table 1. Regarding sex, there were 1,312 (64.2%) and 300 (58.6%) males in the training set and set 1, respectively, and 399 (72.8%) males in set 2 (p < 0.001). Regarding the depth of invasion, 1,156 (56.6%) and 286 (55.9%) patients had mucosal invasion in the training set and set 1, respectively, while 413 (75.4%) had mucosal invasion in set 2 (p < 0.001). Additionally, in the training set and set 1, the number of patients with SM2 (> 500 μm) invasion was 656 (32.2%) and 170 (33.2%), respectively, whereas it was 80 (14.6%) in set 2.
The number of patients with differentiated pathology was 1,053 (51.5%) and 256 (50.0%) in the training set and set 1, respectively, but it was 509 (92.9%) in set 2 (p < 0.001). Lymphatic invasion was present in 272 (13.3%) and 71 (13.9%) individuals in the training set and set 1 (p < 0.001), and 75 (13.7%) in set 2. Regarding size, the median tumor size was 2.25 cm (1.6–3.2) and 2.35 cm (1.6–3.33) in the training set and set 1, respectively, and was 1.4 cm (1.0–2.0) in set 2 (p < 0.001).
The median number of total lymph nodes harvested was 54 (42–69) and 56 (44–71) in the training set and set 1, respectively. LNM was positive in 257 (12.6%) and 64 (12.5%) patients in the training set and set 1, respectively, and in 24 (4.3%) in set 2 (p < 0.001). In set 2, 70 (12.8%) patients had metachronous recurrence during the follow-up period, of which 42 (7.7%) were adenomas and 28 (5.1%) were adenocarcinomas.
2. Features to predict LNM
Table 2 shows the relationship between each feature and LNM in the univariate and multivariable LR models and the odds ratios (ORs) of each clinicopathological feature. In univariate analysis, the top five features significantly correlated with LNM were LVI (OR, 11.86), SM2 (6.13), perineural invasion (3.44), size > 2 cm (2.61), and ulcer (2.32). In multivariable analysis, the significant features included a p-value of ≤ 0.05, age 45–59 years, age 60–74 years, age ≥ 75 years, SM2 invasion, undifferentiated histology, LVI, and size > 2 cm.
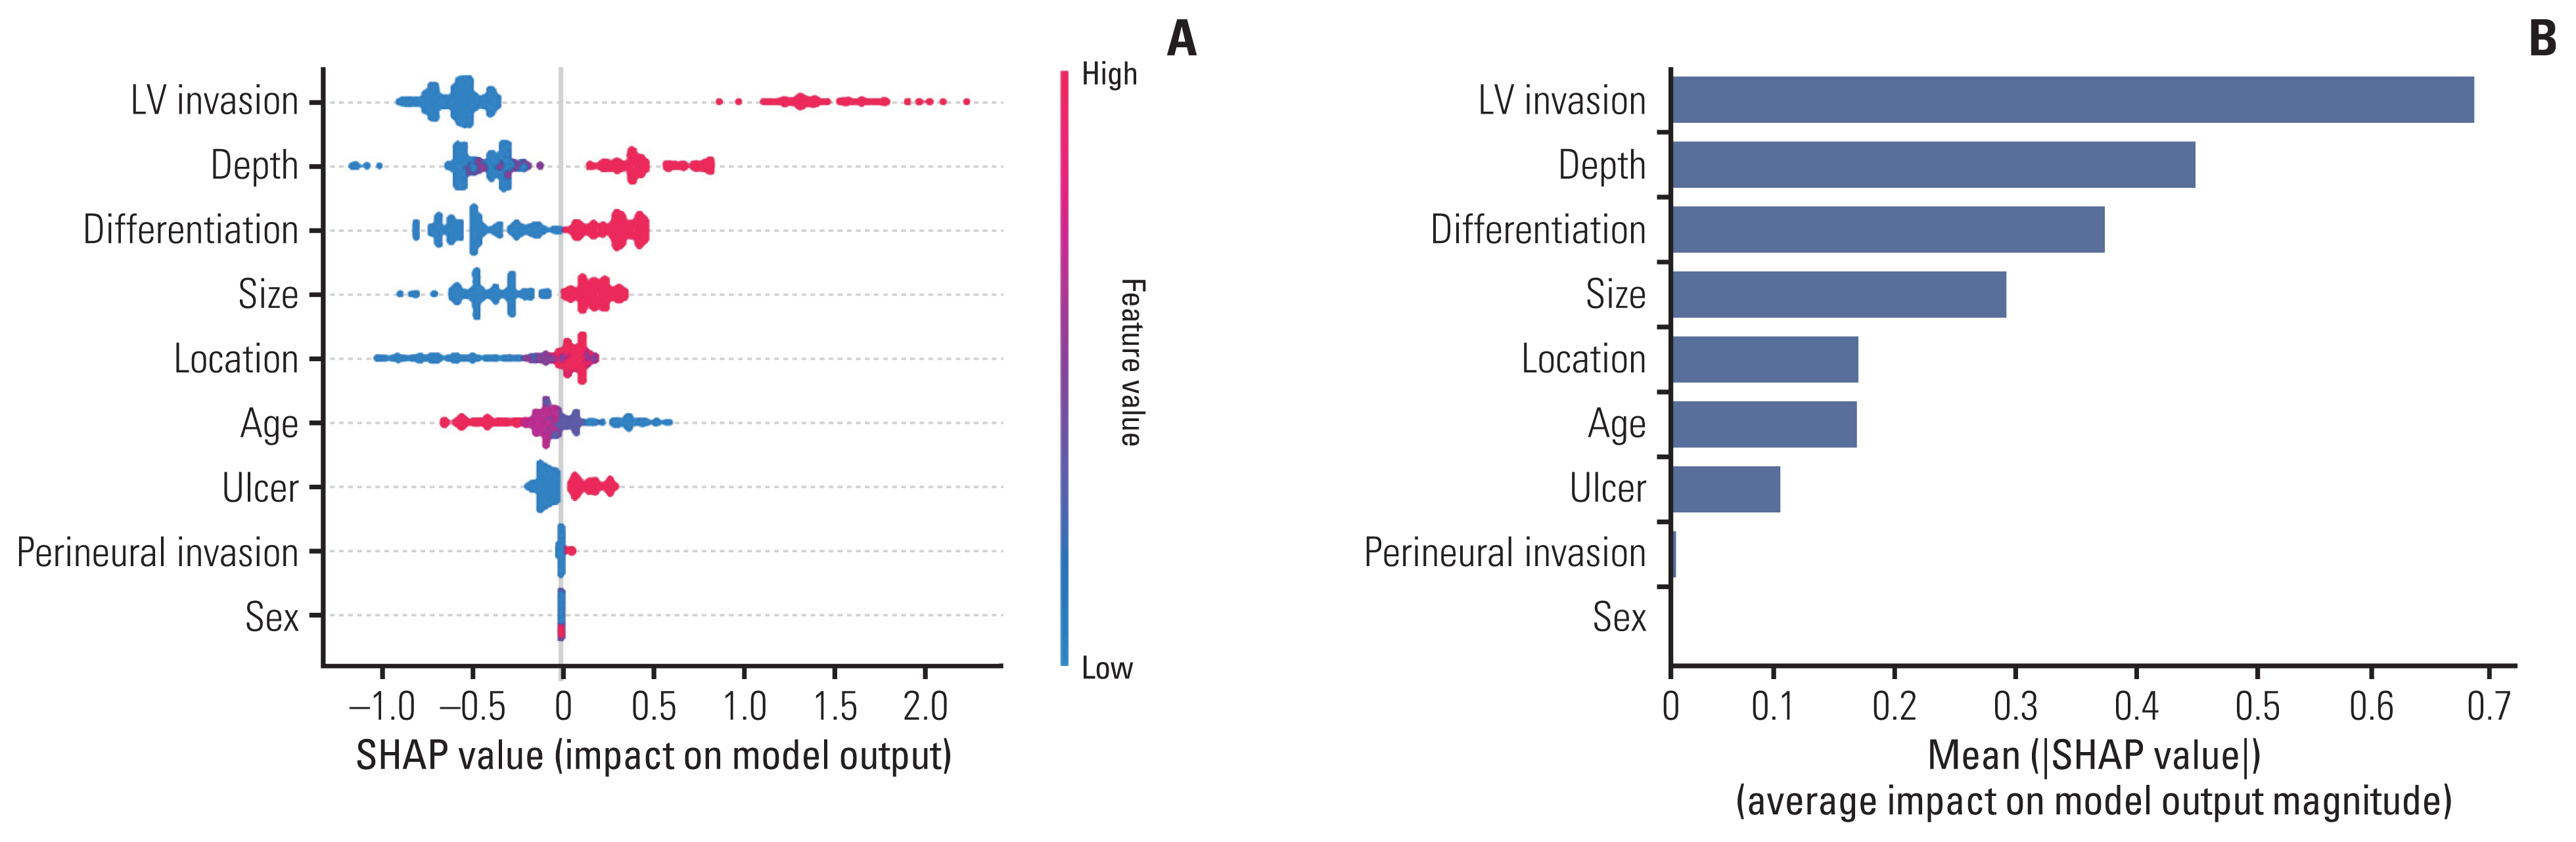
Feature importance was also analyzed in the GBM model. Although various criteria are used to derive feature importance in the XGBoost model, we used the SHAP value, and the results are shown in Fig. 2. The SHAP value explains the difference between the actual and predicted values, where the larger the value, the higher the probability that the LNM, the dependent variable, is positive.
As shown in Fig. 2A, regarding feature value, in the case of LVI, ulcer, and perineural invasion, negative is 0 and positive is 1; in the case of depth, 1 is mucosal invasion, 2 is SM1, 3 is SM2; regarding differentiation, 1 is defined as differentiated and 2 as undifferentiated; the upper, middle, and lower thirds were 1, 2, and 3, respectively; and the size was 1 for ≤ 2 cm and 2 for > 2 cm. In the case of LVI with the largest SHAP value, 1, can be interpreted as having a large effect on predicting LNM. As the depth increases, especially SM2, invasion predicts the presence of LNM. The order of feature importance was LVI, depth, differentiation, size, age, location, ulcer, perineural invasion, and sex (Fig. 2B).
3. Model testing and performance evaluation
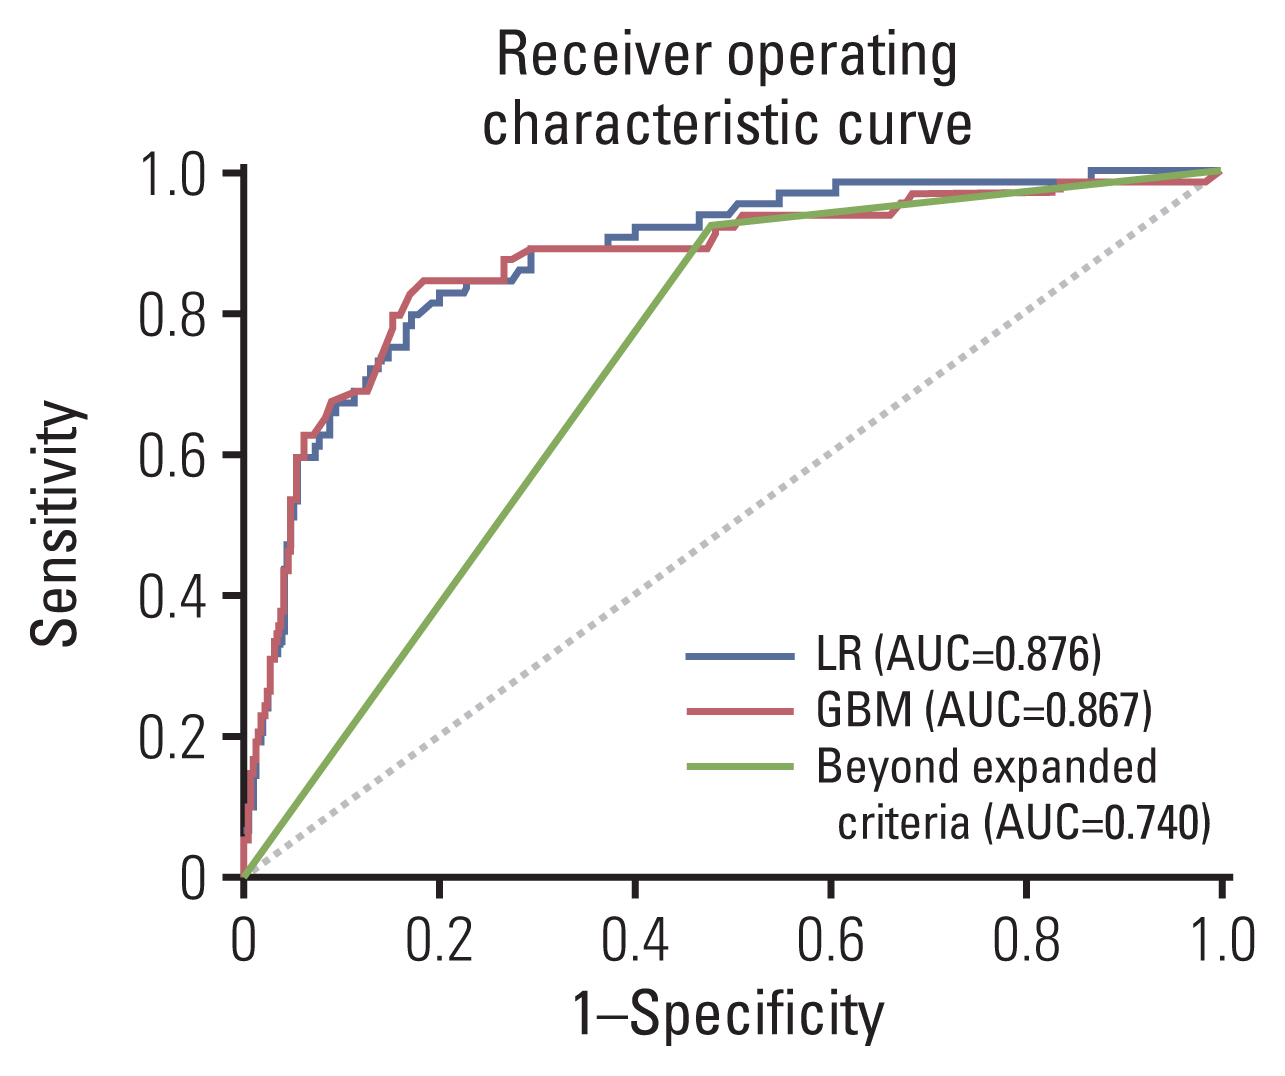
Table 3 shows the performances of the LR, GBM, and JGCA guidelines (beyond the expanded criteria or eCuraC-2) in sets 1 and 2. In set 1, the accuracy, recall (sensitivity), precision, AUROC, AUPRC, and F1-score were 0.555, 0.922, 0.209, 0.740, 0.163, and 0.341, respectively, in beyond the expanded criteria. When the sensitivity was set to 0.922 to match that of beyond the expanded criteria, these performance metrics were 0.617, 0.922, 0.236, 0.876, 0.403, and 0.376 in the LR model, and 0.566, 0.922, 0.214, 0.867, 0.421, and 0.347 in the GBM model, respectively. The ROC curves of the two predictive models and beyond the expanded criteria are shown in Fig. 3.
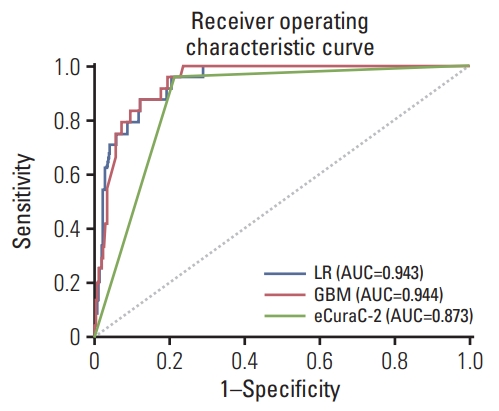
Next, the performances of the two models were compared with that of the eCuraC-2 system in set 2. When the patients in set 2 were classified according to the Japanese eCura system, 414 were classified as either eCuraA, eCuraB, or eCuraC-1, and 134 patients were classified as eCuraC-2. When predicting LNM risk using the eCuraC-2, the accuracy, sensitivity, specificity, AUROC, AUPRC, and F1-score were 0.796, 0.958, 0.788, 0.873, 0.166, and 0.292, respectively. In the LR and GBM models, when the sensitivity was set to 0.958 to match that of eCuraC-2, the accuracy and specificity were 0.803 (95% confidence interval [CI], 0.787 to 0.806) and 0.796 (95% CI, 0.787 to 0.798) in LR, and 0.810 (95% CI, 0.794 to 0.814) and 0.803 (95% CI, 0.795 to 0.805) in GBM, respectively (Table 3). The ROC curves of the two predictive models and eCuraC-2 are shown in Fig. 4.
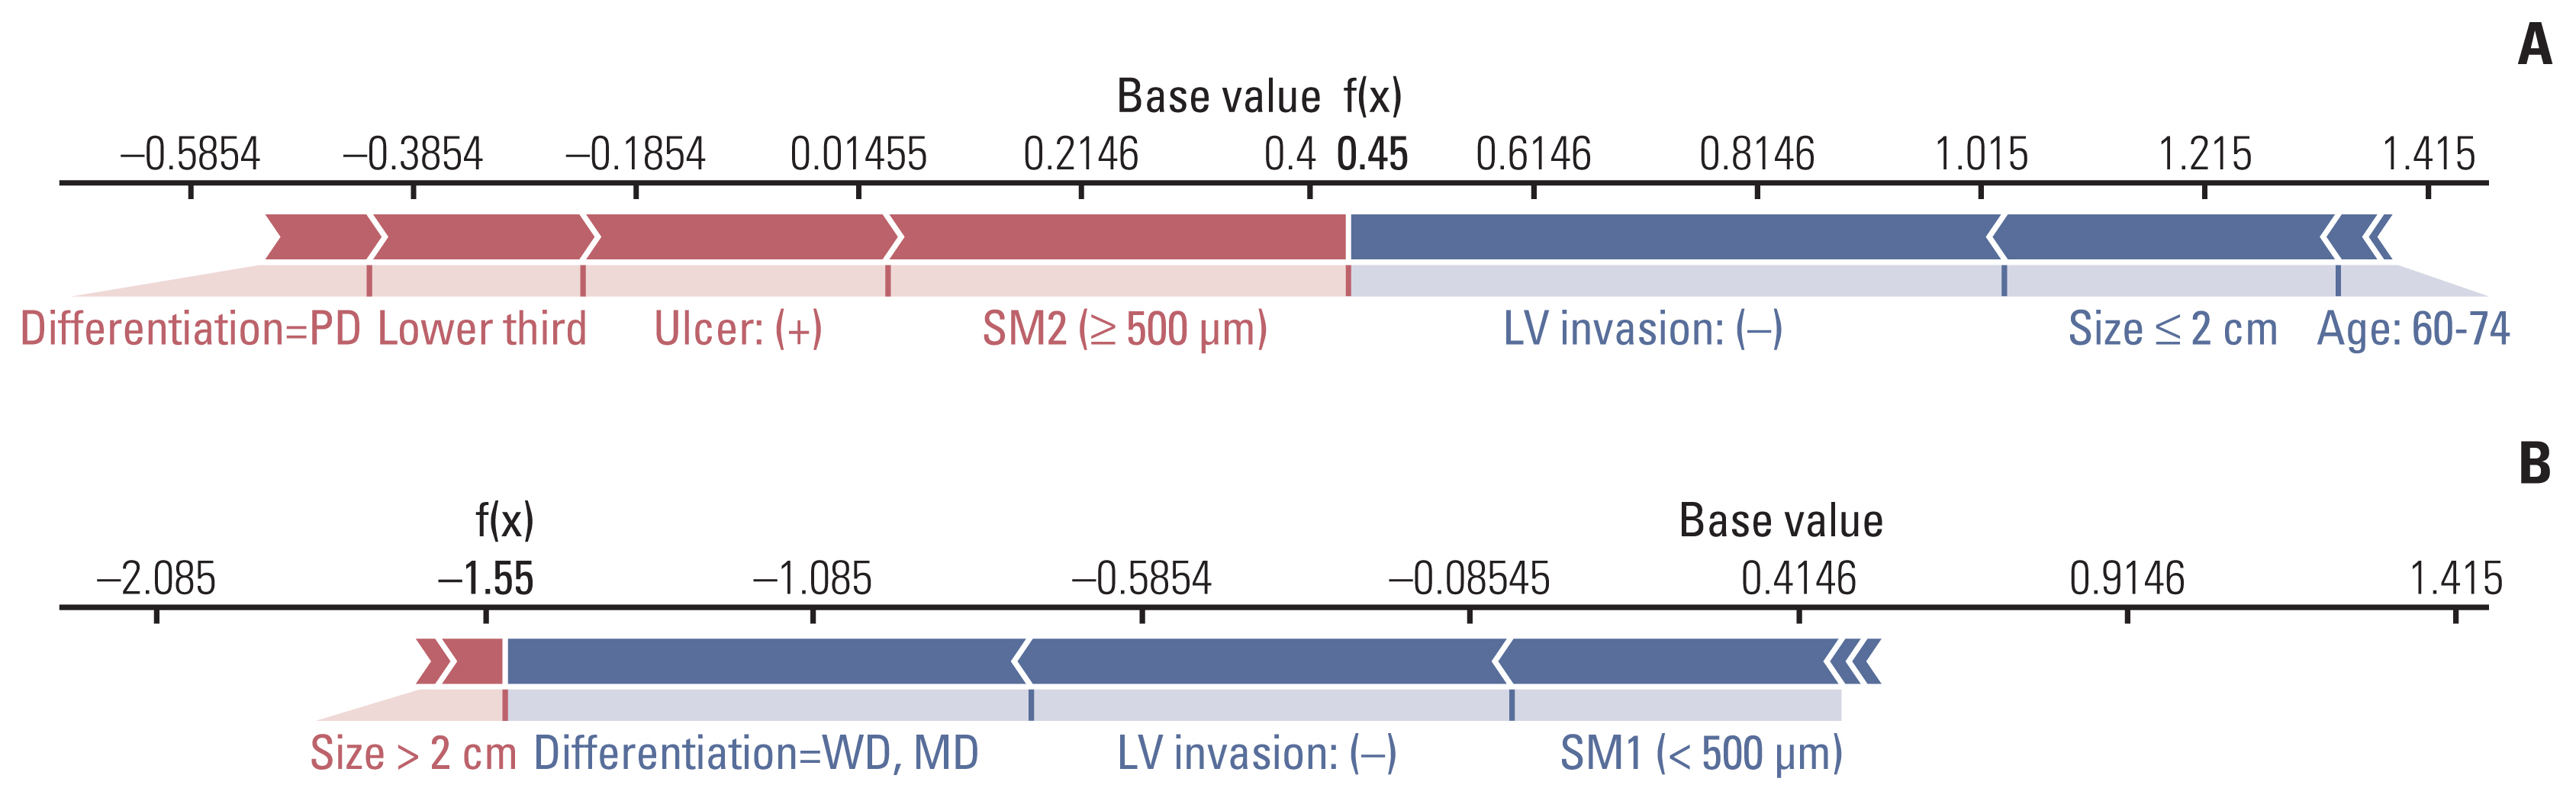
Typical cases used for predicting LNM using the GBM model are presented in Fig. 5. In patient #1 (Fig. 5A), SM2 invasion and ulcer positivity had a significant effect on predicting LNM as positive and LVI negative, while size < 2 cm influenced predicting LNM as negative; therefore, LNM was predicted, and then confirmed, as positive. Similarly, in patient #2 (Fig. 5B), a size > 2 cm affected the prediction of LNM as positive, but in differentiated tumors, LVI was negative; as SM1 invasion has a greater effect on predicting LNM as negative, LNM was predicted as negative, but was not reported after gastrectomy.
Additionally, subgroup analysis was conducted with ESD followed by surgery (n=123), a subset of set 2, to compare the performance of the GBM model with that of eCuraC-2. When the subgroup was classified using the eCura system, 12 patients belonged to either eCura A, B, or C-1, while 111 patients belonged to eCuraC-2. When LNM was predicted using the eCura system, the accuracy, sensitivity, specificity, and AUROC were 0.268 (0.211–0.284), 0.957 (0.803–0.998), 0.110 (0.075–0.119), and 0.533 (0.478–0.582). When the sensitivity of the LR and GBM models was set to 0.957, the sensitivity of eCuraC-2 and the specificities of the LR and GBM models were 0.170 (0.132–0.179) and 0.190 (0.151–0.199), respectively (S1 Table, S2 Fig.).
Discussion
Here, we evaluated the performance of prediction models including GBM to predict LNM in EGC. To the best of our knowledge, this is the first study to conduct external validation of a model for predicting LNM in EGC using a machine learning method in patients with EGC who underwent ESD followed by gastrectomy. Our findings suggest that the predictive model implemented using machine learning can accurately predict LNM risk in EGC. We also performed analysis using machine learning methods other than LR and GBM including SVM, Random Forest, Lasso, and Elastic Net models (S3 Fig.). To summarize, GBM, LR, and Lasso showed comparable performances to LR and GBM, while SVM and Elastic Net showed lower performance results.
To date, several studies conducted a retrospective analysis of clinicopathological data for patients who underwent gastrectomy to explore the risk factors of LNM in EGC using LR [22–24]. Recently, one study conducted on 2,348 patients in five major tertiary medical centers comparing six machine learning technologies reported that XGBoost showed the best performance to predict LNM in EGC [25]. In contrast, we constructed a model for predicting LNM in EGC using the GBM method with all pathologic data. Only one study has used the GBM method to evaluate a model for predicting the risk of death within 10 years in patients with colorectal cancer, in which the AUROC and accuracy were acceptable at 0.84 and 0.83, respectively [26]. Another study employed a deep learning method to create a model to determine the risk of LNM in T1 colorectal cancer [27]. In the current study, unlike previous studies, only patients who were followed up after ER were used to estimate LNM, and the model was developed by dividing the patient group into training and validation cohorts. Patients who had undergone gastrectomy as an initial treatment for EGC were included in the internal validation set (set 1), while those who underwent ESD as the initial treatment were used as the external validation set (set 2) to compare the performance of the GBM method with the existing JGCA guidelines (conventional expanded criteria and recent eCura system).
LVI, depth, size, ulcer, and differentiation have been consistently considered risk factors for LNM in EGC [5,6]. Except for LVI, the other four features are included in the classic expanded criteria. Even when analyzed using univariate and multivariate LR in this study, the results were consistent with those of previous studies, as shown in Table 2. Additionally, in the GBM method, the features that had a significant influence on predicting LNM in the predictive model, in order of importance, were LVI, depth, differentiation, size, age, location, and ulcer (Fig. 2), which is consistent with the LR model. Specifically, the younger the age, the higher the probability of LNM, which is consistent with the results of the LR model. In contrast, perineural invasion and sex had less influence than the other features.
Both GBM and LR models showed better performance than JGCA guidelines in terms of AUPRC (Table 3). The GBM method showed high performance (AUROC: 0.867 and 0.943 in set 1 and set 2, respectively), but the LR model showed the highest accuracy in set 1 (0.617, 0.566, and 0.555 in LR, GBM, and beyond the expanded criteria, respectively). When the sensitivity was matched to the value of the expanded criteria (0.922) to minimize missing patients with LNM by maximizing the sensitivity to detect LNM, the specificities of LR, GBM, and beyond the expanded criteria were 0.574, 0.516, and 0.502, respectively. However, patients who receive ER as an initial treatment (set 2) is a clinical situation that requires the prediction of LNM risk, and in set 2, the GBM model showed the highest accuracy (0.803, 0.810, and 0.796 for LR, GBM, and eCuraC-2, respectively). When the sensitivity was matched to that of eCuraC-2 (0.958), the specificities of LR, GBM, and eCuraC-2 were 0.796, 0.803, and 0.788, respectively. Despite a slight difference, the specificity of GBM was higher than the upper limit (0.790) of the specificity 95% CI of eCuraC-2.
Set 2 comprised two heterogeneous groups of patients who were followed up after ESD (n=425) and those who underwent gastrectomy within 6 months after complete but non-curative resection (n=123). In clinical practice, it is difficult to decide whether additional surgery should be performed in cases that are beyond the expanded criteria or eCuraC-2, but show complete resection or horizontal margin positive. In such cases, additional surgery should be performed according to the current guidelines; however, the LNM risk is low and unnecessary surgery can be avoided if an individualized approach can be applied. Therefore, subgroup analysis was performed for patients who underwent gastrectomy within 6 months of ESD (n=123), and GBM showed better performance than eCuraC-2 (accuracy: 0.333 and 0.268 in GBM and eCuraC-2, respectively). When the sensitivity was equal to that of eCuraC-2, the specificity of the GBM model was significantly higher (0.190 vs. 0.110). In the clinical setting, the GBM model may be more useful to determine LNM risk and the need for additional surgery (S1 Table, S2 Fig.).
The patients in set 2 had a shallow depth, good differentiation, and small tumor size compared to the training set and set 1 (Table 1). The LR, GBM, and JGCA guidelines outperformed set 2 compared to set 1, which can be attributed to the lower prevalence of LNM in set 2 (Table 3). Moreover, 70 patients (12.8%) with metachronous recurrence were included in set 2 because metachronous recurrence was considered separate to LNM of the primary lesion [28]; selection bias may occur when patients with metachronous recurrence are excluded.
This study has several limitations. First, despite the relatively large number of subjects, this was a single-center retrospective study, and data supplementation through collaborative research with other institutions is warranted in the future. Second, GBM model was trained and validated on the class imbalanced data, where the minority class of LNM positive accounts for as few as 12.5% and 4.3% in set 1 and set 2, respectively. To overcome the class imbalance, data-level methods for machine learning were conducted by oversampling using Synthetic Minority Over-sampling Technique (SMOTE). However, when the GBM analysis was performed with SMOTE applied, a significant decrease in precision and specificity was observed both in set 1 and set 2 (data not shown). Third, rare pathologic subtypes including GCLS, micropapillary adenocarcinoma, and mucinous adenocarcinoma were included in the analyses. When these minor pathologic subtypes were all excluded and reanalyzed, the performances were not substantially different but appears to be slightly worse (S4 Table). Fourth, in set 2, after initial ESD, lymph node and distant metastases were confirmed in the follow-up group through CT. In this study, LNM was confirmed on CT in one of 425 patients (0.24%) in the follow-up group after ESD. Since most studies used the data of patients who underwent surgery only, few studies were found that evaluated patients who underwent ESD and followed up without surgery for the prediction of LNM risk. One recent study reported that the incidence LNM confirmed on CT was 0.27% (4 of 1,491) in such patients, which is comparable to our findings [29]. However, although CT is currently the optimal means to confirm metastasis, the sensitivity of CT for microscopic lymph node metastases may not be sufficient. Fifth, our proposed predictive model is a bit complex and has limitations in applying in clinical practice.
Nevertheless, our study has several strengths. First, the model was tested as an external validation set in the patient group that received ESD as the initial treatment, with the aim to develop a model to assist clinical decision-making in such patients. That is, if the risk of LNM can be accurately predicted from clinical and pathological findings after ESD, unnecessary additional surgery can be avoided. Second, by applying the JGCA guidelines (beyond expanded criteria and eCuraC-2), which are used to decide the need for additional surgery after ESD, to the internal and external validation sets, their effectiveness was analyzed and compared to that of the predictive models using machine learning methods. Third, we used the GBM (the best performing machine learning method), conducted preprocessing (e.g., feature selection and label encoding), and fine-tuned hyperparameters to maximize the performance and prevent overfitting to ultimately develop a predictive model that can be applied to actual practice [30].
In conclusion, the GBM model showed a good performance that was comparable with the JGCA guideline criteria (conventional expanded criteria and recent eCura system) in predicting LNM risk in EGC in both internal and external validation sets. Thus, the GBM model may represent a substitute for the Japanese eCura system in clinical practice. Further studies are warranted to clarify the usefulness of the GBM model.