Introduction
Regorafenib inhibits multiple protein kinases including vascular endothelial growth factor receptors, KIT, RET, RAF-1, BRAF, TIE2, FGF receptors, and platelet-derived growth factor receptors [1,2]. The clinical benefit of regorafenib in the treatment-refractory colorectal cancer was shown in phase III studies [3,4]. In the CORRECT and the CONCUR trial, regorafenib showed improved overall survival (OS) compared to placebo in patients with metastatic colorectal cancer who had progressed after standard therapies [3,4]. The objective response rate of regorafenib was 1% in the CORRECT trial and 4% in the CONCUR trial [3,4].
As only a subset of patients derives clinical benefit from regorafenib, predictive biomarker of its therapeutic benefit needs to be identified. In a retrospective exploratory analysis of the CORRECT trial, investigators analyzed circulating DNA and protein biomarkers to predict the clinical activity of regorafenib [5]. While baseline plasma DNA concentration was a prognostic factor, the clinical benefit of regorafenib was not affected by baseline plasma DNA concentration [5]. In addition, the clinical benefit of regorafenib was consistent regardless of KRAS and PIK3CA mutation status of plasma circulating tumor DNA (ctDNA) using BEAMing technology [5]. Currently, there is no identified predictive biomarker for regorafenib.
ctDNA is rapidly emerging as a valuable non-invasive tool for real-time monitoring of tumor characteristics including mutational profile, tumor heterogeneity, and tumor burden in cancer patients [6,7]. Moreover, early change of ctDNA is associated with therapeutic response in metastatic colorectal cancer during palliative chemotherapy [8,9]. However, most studies were performed in earlier lines of metastatic setting and there is no data whether the changes of ctDNA are associated with treatment outcome of regorafenib.
Comprehensive analysis of ctDNA using a serial plasma samples can provide a better understanding of how tumors respond to treatment. The purpose of this study was to investigate ctDNA dynamics during regorafenib treatment and to identify its association with treatment outcome in patients with metastatic colorectal cancer.
Materials and Methods
1. Patients and treatment
This study included patients enrolled in a prospective biomarker study entitled “Identification of Predictive Biomarker of Regorafenib in Refractory Colorectal Cancer: A Prospective Explorative Study (ClinicalTrial.gov Identifier: NCT01996969, Registration date: November 27 2013)”. Patients with metastatic colorectal cancer who were refractory to standard therapies (fluoropyrimidine, oxaliplatin, and irinotecan) were eligible for the current study. Prior treatment with bevacizumab or cetuximab was not mandatory. Other main inclusion criteria were age ≥ 20 years; pathologically proven colorectal adenocarcinoma; adequate tissue for gene sequencing; and Eastern Cooperative Oncology Group performance status 0 or 1.
Patients received oral regorafenib 160 mg once daily for the first 3 weeks of each 4-week cycle and were treated until disease progression, death, unacceptable toxicity, or decision by the treating physician. Regorafenib was provided by Bayer Pharma AG (Berlin, Germany). Response evaluation using contrast-enhanced computed tomography was repeated every 2 cycles and tumor response was determined according to the Response Evaluation Criteria in Solid Tumor (RECIST) ver. 1.1.
From October 2013 to January 2015, a total of 117 patients were enrolled in this prospective biomarker study. Among the 117 patients, seven patients were not evaluable for response (4 patients lost to follow-up, two withdrew consent, and one without extracranial measurable lesion) and a total of 110 patients were included in the present biomarker analysis (S1 Fig.).
2. Blood sample collection and library preparation
Blood samples were obtained at baseline, at the first tumor response evaluation after 2 cycles of treatment, and at the time of disease progression. Blood samples were centrifuged with Ficoll solution at 1,500 ×g for 15 minutes. Plasma was then separated by centrifugation at 16,000 ×g for 10 minutes to remove cell debris, after which 1-mL aliquots were placed in Eppendorf tubes and stored at −80°C before DNA extraction. This protocol was performed within 20 min of blood collection to prevent cell-free DNA (cfDNA) degradation and release of genomic DNA from dying blood cells. cfDNA was isolated according to the manufacturer’s instructions from 2–4 mL plasma using a Maxwell RSC ccfDNA Plasma Kit (Promega, Madison, WI) and quantified using a 4200 TapeStation (Agilent Technologies, Santa Clara, CA). Peripheral blood mononuclear cell (PBMC) were separated following this protocol. Genomic DNA was isolated from PBMC using a QIAamp DNA Mini Kit (Qiagen, Valencia, CA).
3. Targeted deep sequencing and bioinformatics analysis
A DNA NGS library was constructed using IMBdx NGS DNA Library Prep Kit. Solution-based target enrichment was performed at IMBdx, Inc. (Seoul, Korea), using an AlphaLiquid 100 target capture panel which includes 106 genes (S2 Table). The total length was approximately 0.39 MB. Captured DNA libraries were sequenced using an Illumina NextSeq 550 platform (Illumina, San Diego, CA) in 2×150 bp paired-end mode. All sequencing reads from the samples were generated in fastq format. The fastq files were trimmed for adaptor sequences and aligned to the human reference genome (hg38) using Burrows-Wheeler Aligner (v0.7.17) “mem” algorithm. Initial variant calls were compiled for the AlphaLiquid 100 target regions using VarDict [10], then a series of IMBdx in-house filtering steps were applied. The single nucleotide variants (SNVs) and insertions/deletions (INDELs) with at least 0.5% variant allele frequency (VAF) and six alternative reads were considered a somatic variant call. A few unsatisfied variants were rescued that appeared high VAF in other time points. The somatic variants were distinguished from germline variants and clonal hematopoiesis of indeterminate potential variants in the matched PBMC sample.
The variant calls were annotated using SnpEff [11], SnpSift [12], and VEP [13] for functional effect prediction and tagging information from various databases. In the end, somatic but known as (likely) benign, synonymous, or intronic variants were filtered out. For copy number amplification (CNA) detection, the reference depth profile was pre-built using 50 normal samples. Then, for each sample of interest, CNA calling was performed per each gene assessing statistical significance supporting amplification compared to the normal cohort. Amplification was defined as copy number (CN) ≥ 6 and CN gain as CN ≥ 4. All bioinformatic analysis was performed by a bioinformatician (H.R.) blinded to clinical information. The sequencing coverage and quality statistics for each sample are summarized in S3 Table.
Previous studies in small lung cancer and pancreatic adenocarcinoma revealed that maximum VAF or mean VAF of ctDNA is correlated with tumor burden [14,15]. Since maximum VAF does not reflect tumor heterogeneity and the level of mean VAF could be biased by mutations with low VAF, we hypothesized that the sum of VAF is more likely to reflect the overall ctDNA burden at each time point in a single patient.
4. Statistical analysis
Progression-free survival (PFS) was calculated from the date of regorafenib initiation to the first date of disease progression or death from any cause. Data from patients who were free of progression or lost to follow-up were censored at the date of the last follow-up visit for PFS. OS was calculated from the date of regorafenib initiation to the date of death from any cause. Tumor response was evaluated according to RECIST ver. 1.1. Disease control rate was defined as a combined proportion of complete response, partial response, and stable disease. Categorical variables were compared by chi-square test or Fisher’s exact test, and continuous variables were compared using the independent-samples t test. For variables that did not show a normal distribution, statistics were performed through a log transformation. These variants included cfDNA concentration, VAF change, and sum (VAF) change. In the analysis of VAF change of each gene and PFS, relative VAF change was calculated by dividing follow-up VAF by baseline VAF. If a specific variant was detected only in one of the two time-points, the VAF of the undetected time-point was set at 0.1% in order to enable log transformation of the VAF change values. Although a VAF of 0.5% cutoff was used for somatic variant calls, a few unsatisfied variants below 0.5% had been rescued. Therefore, a VAF of 0.1% for undetected variants was chosen to give the lowest VAF value among the samples. PFS and OS were analyzed using the Kaplan-Meier method, and comparisons were made using the log-rank tests. To adjust for baseline characteristics, Cox proportional hazard analysis of PFS and OS was performed in a forward stepwise method including the following covariates: age, sex, tumor location, liver metastasis, lung metastasis, and prior use of monoclonal antibodies (cetuximab, bevacizumab, or both). cfDNA concentration in a continuous variable (in a log transformation) was also used as a covariate in the multivariate analyses. Two-sided p-values less than 0.05 were considered statistically significant. Statistical analysis was performed using SPSS software for Windows, ver. 20.0 (IBM Corp., Armonk, NY).
The primary aim of the main prospective biomarker study was to identify a predictive biomarker of regorafenib using the tissue next-generation sequencing (NGS) data. Assuming the prevalence of the predictive biomarker as 33.3% and the disease control rate of the biomarker positive group as 60% and the negative group as 30%, 93 patients were required with an alpha error of 0.05 and a power of 80%. A total of 117 patients were needed assuming a 20% dropout rate. Analysis of ctDNA was an exploratory sub-study and correction for multiple hypothesis testing was not planned.
Results
1. Patient characteristics and regorafenib treatment
A total of 110 patients were included in this ctDNA biomarker study. The baseline characteristics are summarized in Table 1. In brief, the primary tumor location was proximal colon (from the cecum to the transverse colon) in 21 patients (19.1%), distal colon (from the descending colon to the sigmoid colon) in 44 patients (40.0%), and rectum in 45 patients (40.9%). Patients had received median three lines of palliative chemotherapy. Sixty-eight patients (61.8%) had initial metastatic colorectal cancer and 42 patients (38.2%) had relapsed metastatic colorectal cancer. All patients had received prior chemotherapy including fluoropyrimidine, oxaliplatin, and irinotecan.
All patients received regorafenib per protocol. There was no complete response, four patients had a partial response (3.6%), 72 had stable disease (65.5%), and 34 had progressive disease (30.9%) as the best overall response. The disease control rate was 69.1%. With a median follow-up duration of 9.4 months, there were 109 progression-free survival (PFS) events and 105 death events. The median PFS was 5.2 months, and the median OS was 9.4 months.
2. Baseline ctDNA profile and survival
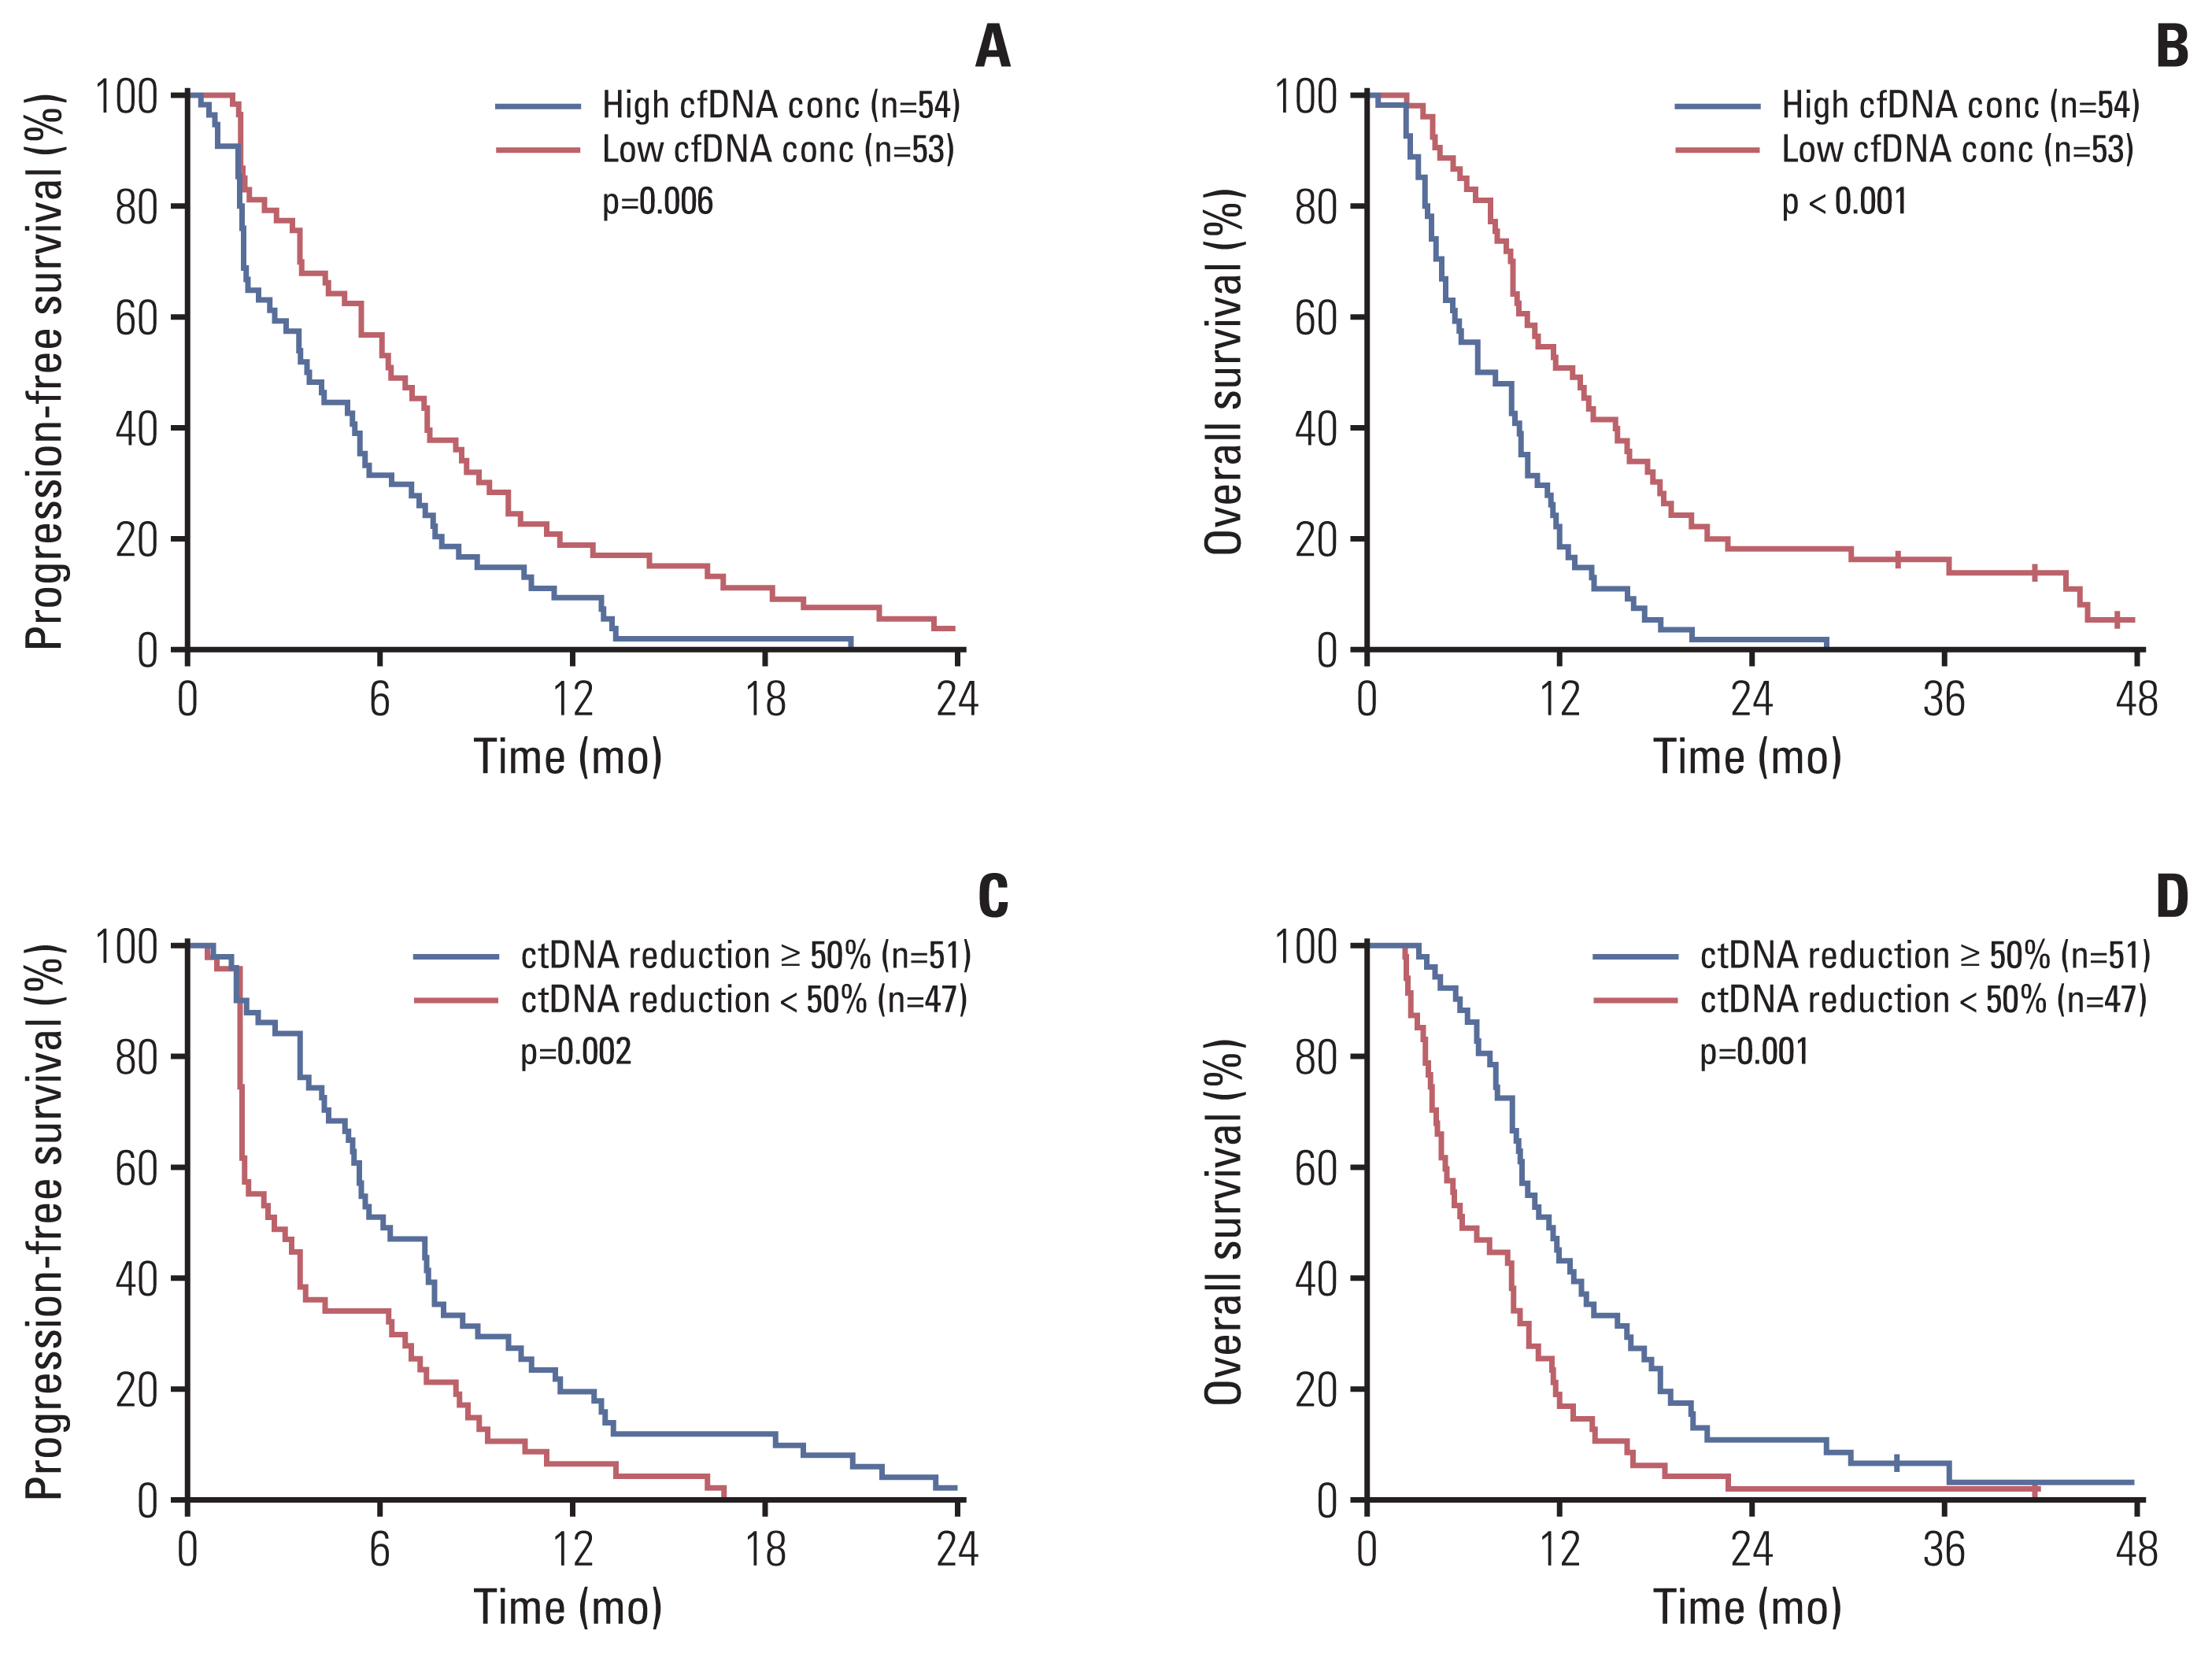
From baseline blood samples cfDNA was successfully analyzed in 107 patients (97.3%). The median baseline cfDNA concentration was 7.85 ng/mL (range, 1.17 to 194.4). Baseline cfDNA concentration was associated with survival. Univariate Cox proportional hazard analysis revealed that cfDNA concentration (in log transformation) at baseline is correlated with PFS (hazard ratio [HR], 2.09; 95% confidence interval [CI], 1.45 to 3.01; p < 0.001) and OS (HR, 2.81; 95% CI, 1.93 to 4.09; p < 0.001). When dichotomized by the median concentration, patients with higher cfDNA concentration had poor PFS (median, 3.7 vs. 6.3 months; p=0.006) and OS (median, 6.9 vs. 12.8 months; p < 0.001) compared to those with lower cfDNA concentration (Fig. 1A and B).
In 107 patients who had baseline cfDNA analysis, a total of 710 mutations (SNVs and INDELs) were identified. The median numbers of mutations per patient were 6 (range, 0 to 42). Among the 107 patients who had detectable baseline cfDNA, at least one mutation was detected in 101 patients (94.4%). Mutation was most frequently found in TP53 (76.6%) followed by APC (75.7%), KRAS (43.0%), PIK3CA (17.8%), and SMAD4 (17.8%). BRAF mutation was found in 8.4% of patients and NRAS was detected in 3.7% of patients (S4 Table).
We next evaluated the influence of gene mutation on survival. Genes with alteration frequency of over 10% were analyzed. Patients with TP53 mutation in the baseline ctDNA had shorter PFS (4.3 vs. 7.7 months, p=0.007) and OS (9.0 vs. 16.2 months, p=0.001) compared to wild type patients. KRAS mutation was associated with poor OS (9.1 vs. 11.6 months, p=0.017) and had a tendency of poor PFS (3.5 vs. 6.3 months, p=0.072). PIK3CA mutation or BRAF mutation was not associated with PFS or OS. However, TP53 mutation or KRAS mutation was not associated with PFS or OS in the multivariate analysis using the Cox proportional hazard model adjusting for baseline covariates. Multivariate analysis revealed high baseline cfDNA concentration (adjusted HR, 2.21; 95% CI, 1.54 to 3.17; p < 0.001) and lung metastasis (adjusted HR, 1.63; 95% CI, 1.09 to 2.43; p=0.018) as an independent negative factor for PFS (S5 Table). High baseline cfDNA concentration (adjusted HR, 3.44; 95% CI, 2.32 to 5.09; p < 0.001), lung metastasis (adjusted HR, 2.37; 95% CI, 1.53 to 3.68; p < 0.001), and female sex (adjusted HR, 1.58; 95% CI, 1.04 to 2.41; p=0.034) was an independent negative prognostic factor for OS (S6 Table).
A total of 46 CN gains in 23 genes (including 17 amplifications in 12 genes) were identified in the baseline ctDNA of 24 patients. Amplification was most frequently found in EGFR (3 patients, 2.8%) and FGFR1 (3 patients, 2.8%) followed by CCND2 (2 patients, 1.9%). Amplifications of other genes were detected only once (AKT1, ERBB2, FGFR2, FLT3, IGF1R, KRAS, MAPK3, MET, and MYC). Amplification of FGFR1 was associated with poor PFS (1.6 vs. 5.4 months, p=0.037) and OS (4.3 vs. 9.6 months, p=0.050) in the log-rank tests. However, this was not significant in the multivariate analysis.
3. ctDNA dynamics and survival
Among 110 patients, a follow-up blood sample after two cycles of regorafenib was performed in 106 patients with a median concentration of 31.47 ng/mL (3.67–1,136.25). One-hundred and four patients had detectable baseline and follow-up cfDNA. cfDNA concentration change was calculated by dividing follow-up cfDNA concentration by baseline cfDNA concentration. The median cfDNA concentration change was 4.24 ng/mL (range, 0.38 to 38.21). Changes in cfDNA concentration were not associated with PFS (p=0.67) or OS (p=0.48) in the univariate Cox proportional hazard analysis.
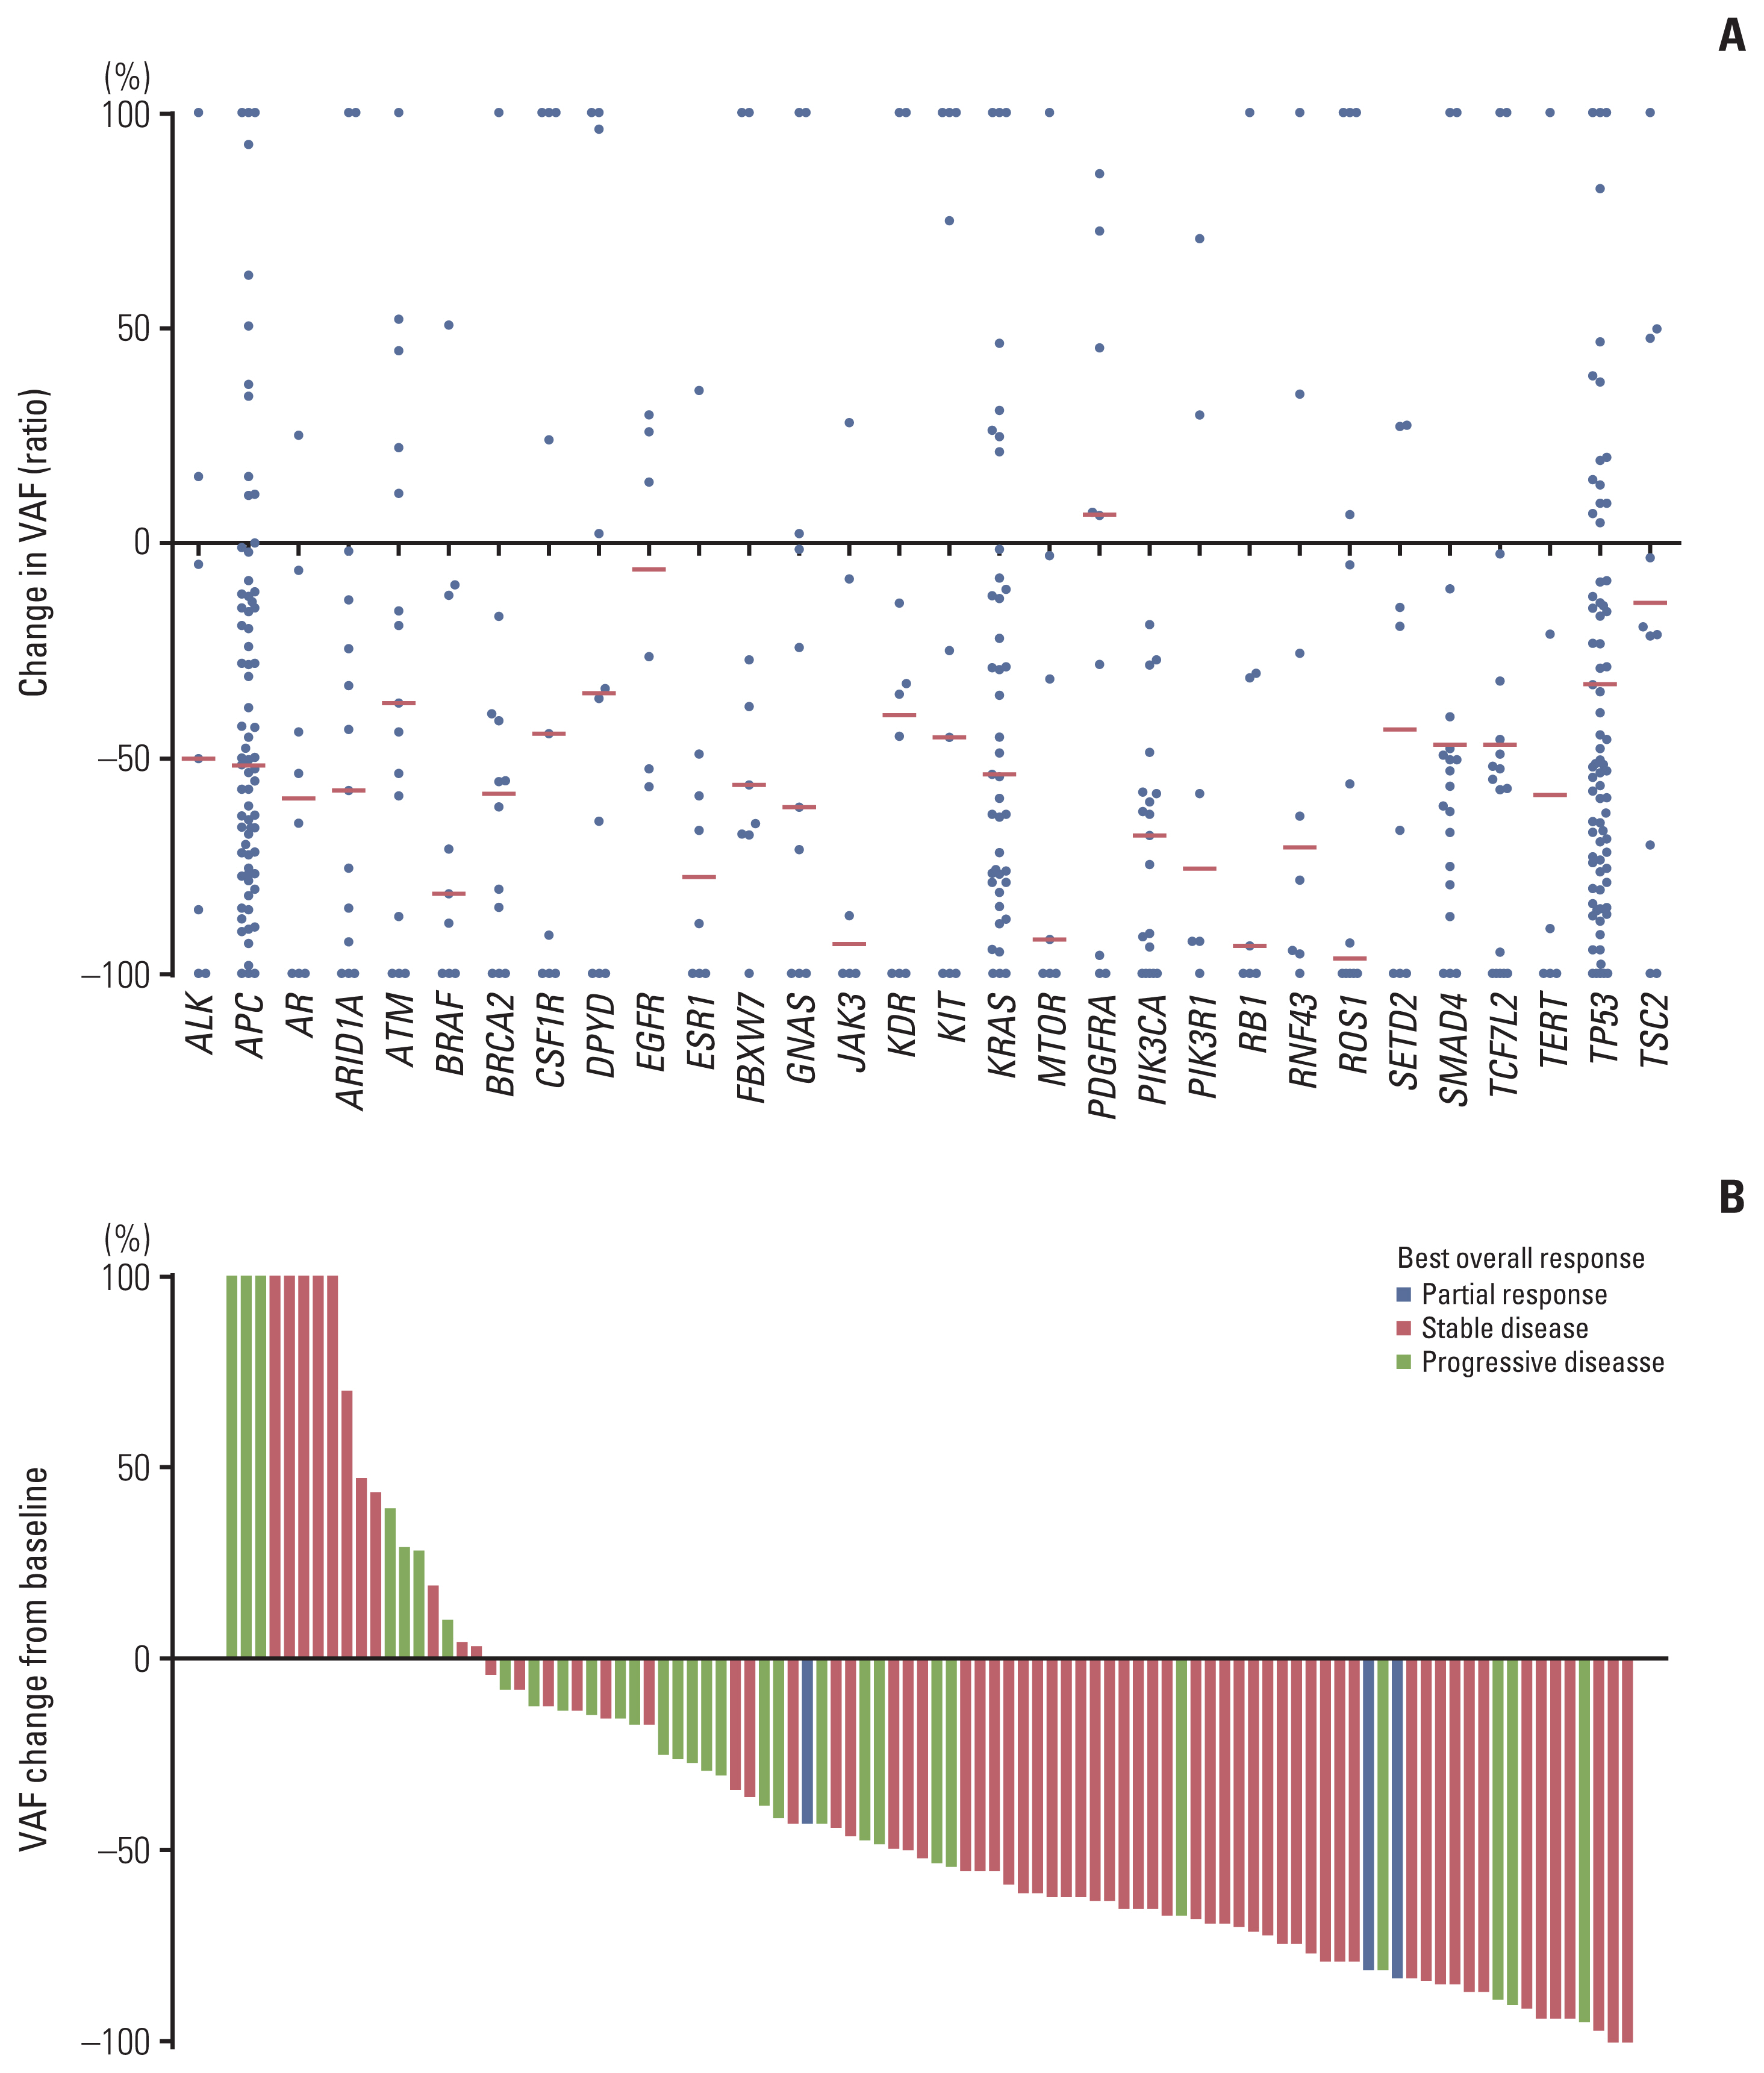
Among 104 patients with baseline and follow-up ctDNA, the mean VAF at baseline was 16.5% (615 variants) and 11.2% (513 variants) in the follow-up sample. This resulted in a mean VAF change of −5.19% (absolute value) and −31.6% (relative change). The relative change of VAF of each gene is shown in Fig. 2A (genes with alteration frequency over 5% were analyzed). Relative VAF change was calculated by dividing follow-up VAF by baseline VAF. VAF decreased markedly after 2 cycles of regorafenib in several genes, including BRAF, JAK3, MTOR, RB1, and ROS1. The correlation between VAF change of each gene and PFS was tested using the univariate Cox proportional hazard analysis. Decreases in VAF of TP53 (HR, 0.63; p=0.018), APC (HR, 0.57; p=0.004), TCF7L2 (HR, 0.41; p=0.020), and ROS1 (HR, 0.44; p=0.049) after treatment were associated with longer PFS (Fig. 3). This suggests that changes in VAF of genes reflecting tumor burden are associated with the clinical benefit. Correlation between VAF change and PFS of the entire gene could be found in the S7 Fig.
We next evaluated whether changes in the sum of VAF as a surrogate of relative overall ctDNA burden at each time point might predict regorafenib efficacy. The sum (VAF) of each sample was calculated by adding the VAF value of all altered genes. Among 101 patients who had at least one mutation at baseline, 98 patients (97.0%) had follow-up blood samples. Change in sum (VAF) was calculated by dividing the follow-up sum (VAF) by the baseline sum (VAF). Median sum (VAF) was 77.4% (range 0.6–492.8%) at baseline and 34.3% (range 0.0–305.6%) at follow-up. Fig. 2B shows waterfall plot of sum (VAF) change after 2 cycles of regorafenib (median, −52.6%; range, −100.0% to +1,539.0%). Among 98 patients, sum (VAF) decreased more than 50% in 51 patients (52.0%), decreased less than 50% in 29 patients (29.6%), and increased in 18 patients (18.4%). Univariate Cox proportional hazard analysis revealed that decrease in sum (VAF) was associated with longer PFS (HR, 0.56; 95% CI, 0.38 to 0.80; p=0.002) and OS (HR, 0.59; 95% CI, 0.41 to 0.85; p=0.004). Patients with a reduction in sum (VAF) of ≥ 50% after two cycles of regorafenib were associated with a significantly longer PFS (6.1 vs. 2.7 months, p=0.002) and OS (11.3 vs. 5.9 months, p=0.001) (Fig. 1C and D). Disease control rate was significantly higher in patients with a reduction of sum (VAF) ≥ 50% after two cycles of regorafenib (86.3% vs. 51.1%, p < 0.001) (Fig. 2B).
Along with sum (VAF), maximum VAF and mean VAF were associated with survival. Decrease of maximum VAF of ≥ 50% after two cycles of regorafenib were associated with longer PFS (6.1 vs. 3.1 months, p=0.005) and OS (10.4 vs. 6.8 months, p=0.005). Likewise, decrease of mean VAF of ≥ 50% after two cycles of regorafenib were associated with longer PFS (5.4 vs. 3.5 months, p=0.002) and OS (10.4 vs. 8.7 months, p=0.039). The sum (VAF) had the highest correlation with PFS and OS in the multivariate analysis among sum (VAF), maximum VAF, and mean VAF.
4. ctDNA at disease progression
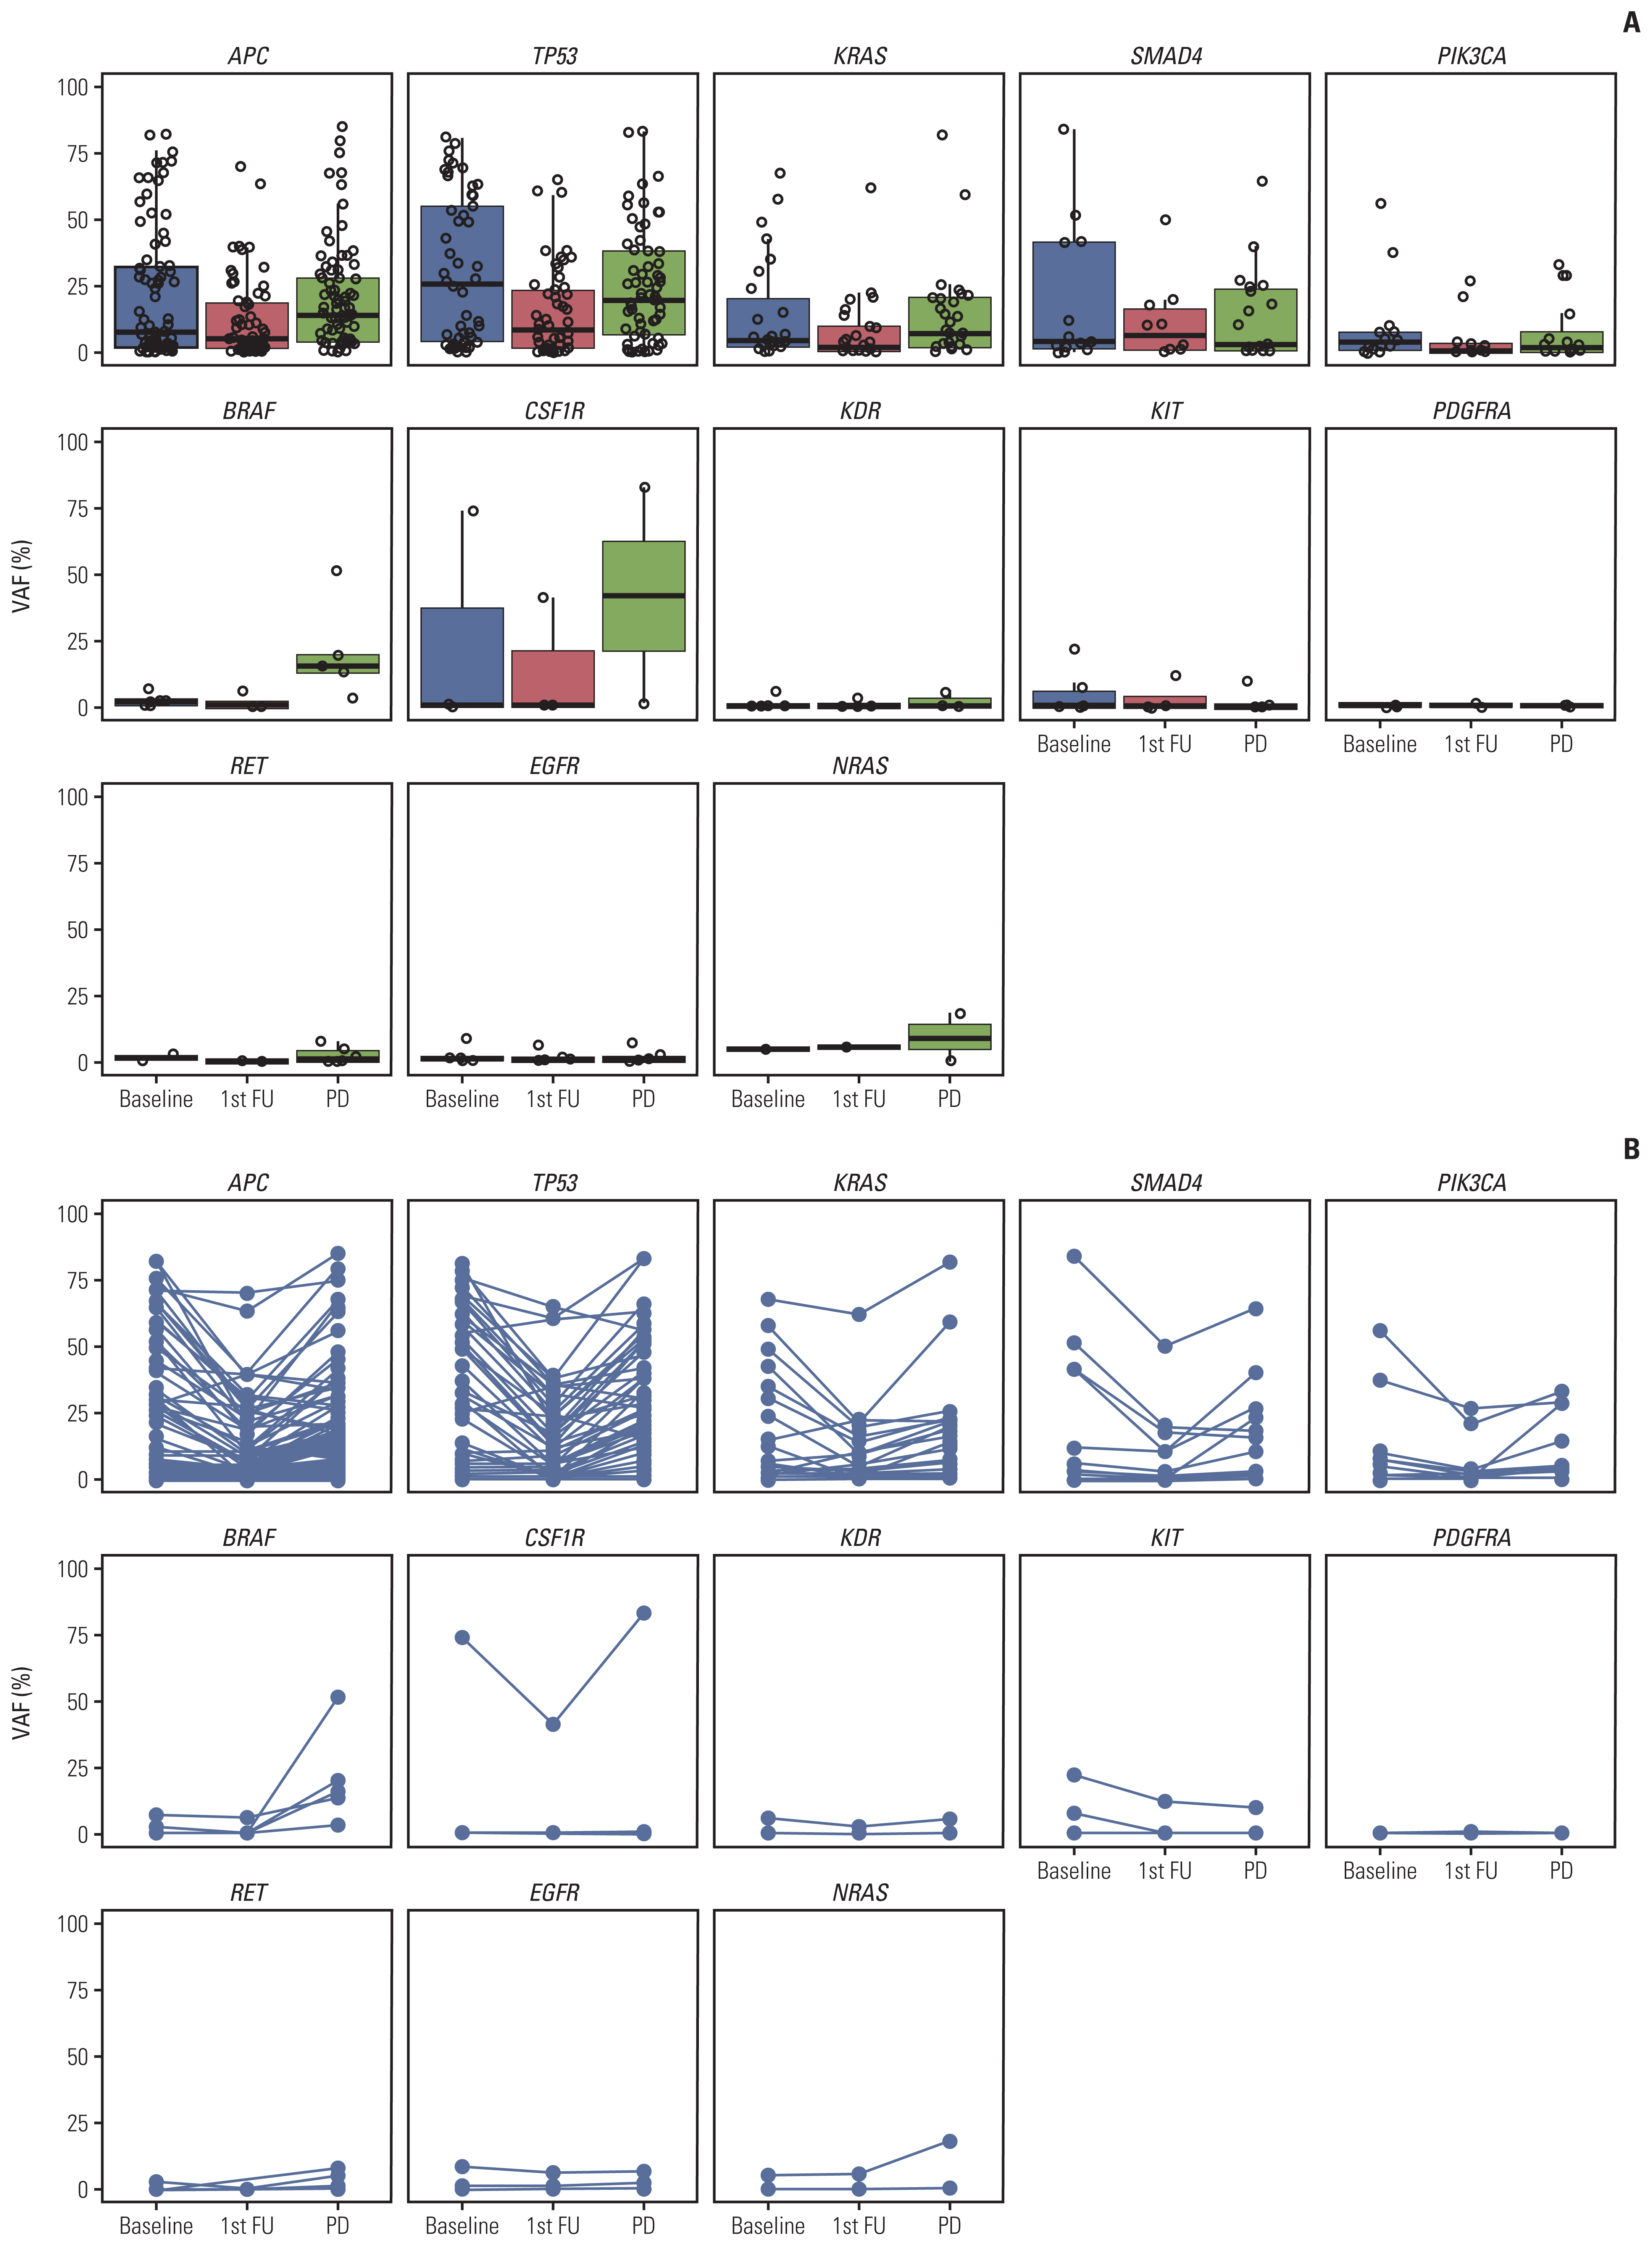
Among 110 patients, a blood sample at the time of radio-logical disease progression was acquired in 97 patients (88.1%). Seventy patients had blood samples from baseline, follow-up after 2 cycles, and at PD. In 25 patients who had PD after 2 cycles, 2nd cycle sample was identical to the PD sample. We were able to identify ctDNA dynamics using serial blood samples in 70 patients (Fig. 4). Mean VAF was 12.95%, 7.72%, and 11.58% at baseline, follow-up, and PD, respectively. Although the mean VAF level decreased after 2 months of regorafenib treatment, the VAF level elevated at disease progression. Fig. 4 shows the ctDNA dynamics of selected 14 genes. We selected five genes that are most frequently altered (APC, TP53, KRAS, SMAD4, and PIK3CA), seven genes that are associated with regorafenib (BRAF, CSF1R, FGFR1, KDR, KIT, PDGFR-B, and RET), and two additional genes associated with RAS-RAF-ERK pathway (EGFR and NRAS). Interestingly, the VAF level of BRAF increased markedly at disease progression. There were five patients with BRAF V600E mutation, and none of the patients used anti-BRAF treatment (encorafenib, vemurafenib, etc.) pre- or post-regorafenib treatment. The dynamics of entire genes could be found in the S8 Fig.
Discussion
Genetic and epigenetic alterations play an important role in the development of colorectal cancer [16]. In addition, genetic characteristics influence the choice of treatment. In the case of anti-EGFR treatment, RAS mutation is a predictive biomarker, and testing of RAS mutation is recommended in all patients diagnosed with metastatic colorectal cancer [17]. Advances in sequencing technology have enabled ctDNA analysis as a non-invasive tool to identify tumor heterogeneity and tumor burden [18,19]. Recent evidences show that ctDNA could be used to identify secondary resistance mechanisms to anti-EGFR therapy and to select patients for anti-EGFR re-challenge [20–22]. However, there is a paucity of data regarding ctDNA in colorectal cancer patients treated with regorafenib. This study was conducted to explore the ctDNA dynamics in metastatic colorectal cancer patients treated with regorafenib.
In this study, ctDNA was readily detectable in colorectal cancer patients treated with regorafenib. Most patients (94.4%) had detectable ctDNA mutation at baseline cfDNA. The profile of mutations identified in ctDNA was typical for colorectal cancer, which confirms that ctDNA sequencing could be used as a tool to identify change in genetic characteristics during treatment. In addition, baseline cfDNA concentration had a prognostic role that patients with higher baseline cfDNA concentration had poor PFS and OS. This is in line with previous studies reported by Wong et al. [23] showing a negative correlation between total cfDNA concentration and survival in colorectal cancer patients treated with regorafenib.
The main advantage of this study is that we were able to explore ctDNA dynamics by analyzing prospectively collected serial blood samples. We used an NGS panel that covers most of the important genes frequently mutated in colorectal cancer. After two cycles of regorafenib treatment, the VAF of ctDNA mutations decreased with a mean relative change of −31.6%. The dynamics of VAF reduction were different among each gene and VAF was markedly decreased in several genes (BRAF, JAK3, MTOR, RB1, and ROS1). It is possible that tumor cell clones harboring these mutations are more sensitive to regorafenib. While the change in cfDNA concentration was not associated with survival, changes in VAF of genes reflecting tumor burdens such as TP53 and APC were associated with the clinical benefit of regorafenib. We tried to identify dynamic changes of genes targeted by regorafenib (BRAF, CSF1R, FGFR1, KDR, KIT, PDGFR-B, and RET), but none of such genes were associated with outcome. Even though the clones harboring the aforementioned genes might be sensitive to regorafenib, it did not lead to an overall tumor response. This suggests that regorafenib efficacy in colorectal cancer is not associated with specific target gene mutation, which is not unexpected considering the multiple kinase inhibition and modest clinical activity of regorafenib.
We reasoned that the change of VAF of a patient’s entire mutation [sum (VAF)] could be a better surrogate for treatment outcome compared to the VAF change of a single gene (such as APC or TP53), maximum VAF, or mean VAF. The change in maximum VAF has the disadvantage that it does not reflect the minor clones, and the mean VAF has the disadvantage that it can be greatly affected by the minor clones. In this study, sum (VAF) had the highest correlation with PFS and OS in the multivariate analysis compared to maximum VAF or mean VAF. Reduction of sum (VAF) of ≥ 50% after two cycles of regorafenib was associated with a higher disease control rate, improved PFS, and longer OS. Previous studies have shown that reduction of ctDNA is associated with therapeutic response in metastatic colorectal cancer [8,9]. In a study involving 53 colorectal cancer patients receiving first-line chemotherapy, early change in ctDNA as measured by VAF of a single selected mutation per patient, predicted radiologic response and was associated with a trend for increased PFS [8]. PLACOL study evaluated ctDNA in 82 patients with metastatic colorectal cancer receiving first- or second-line chemotherapy and high baseline ctDNA concentration was associated with a shorter OS [9]. In addition, patients with a reduction in ctDNA concentration after chemotherapy were associated with a better objective response rate, and a longer PFS and OS [9].
In our previous study, we identified ctDNA clearance in metastatic colorectal cancer patients treated with 1st line chemotherapy. Using the same ctDNA analysis platform, ctDNA clearance after 1st line chemotherapy was observed in the majority (74.5%) of patients [24]. In contrast, such clearance in ctDNA was not observed with regorafenib in this study. It is most likely due to the modest efficacy of regorafenib compared with the higher response rate of 1st line cytotoxic chemotherapy. This clearly demonstrates that the reduction in ctDNA VAF or clearance has a good correlation with the objective response of treatment. Nevertheless, the magnitude of reduction in ctDNA after regorafenib treatment was predictive of a better outcome, suggesting that ctDNA VAF change is a more sensitive measurement of an anti-tumor effect than a radiological response.
Another important finding of our study was that ctDNA dynamics were different among each gene. At baseline, the VAF level of BRAF mutation was low in the majority of patients with BRAF mutation. VAF level of BRAF decreased after 2 months of regorafenib treatment. However, the VAF level of BRAF increased markedly at disease progression. Elevation of minor clones harboring BRAF mutation might have affected regorafenib resistance in these patients. We believe ctDNA could be used as a valuable non-invasive tool to monitor changes in tumor heterogeneity. In this study, we could not demonstrate clonal evolution following regorafenib treatment. One of the main reasons is that regorafenib is a multiple kinase inhibitor and their target genes are not the driver alterations in colorectal cancer.
In the real world, a high percentage of metastatic colorectal cancer patients receiving regorafenib have poor performance status due to increased tumor burden, and sequelae of previous systemic chemotherapy [25]. In addition, the added PFS and OS benefit of regorafenib is modest with a potential risk of adverse events. To date, this is the largest prospective study evaluating the clinical efficacy of serial ctDNA in metastatic colorectal cancer treated with regorafenib. Our study results show that ctDNA dynamics could be used as an early predictive marker and could be a valuable tool to identify tumor heterogeneity in metastatic colorectal cancer patients treated with regorafenib. We have performed whole exome sequencing with the archival tumor tissue. Integrating the tumor whole exome sequencing and blood targeted sequencing will be presented in the near future.
There are several limitations in this study. This was a single arm study without a control arm, and we were unable to examine the exact predictive or prognostic impact of our findings. However, it is unlikely that the decrease in VAF would be observed without treatment advocating the predictive value of the reduction in VAF after treatment. Another limitation is that we did not have a validation cohort, which requires prospectively collected serial samples. Our finding needs to be validated in future studies. It would be important to investigate if ctDNA analysis at earlier time points such as 1 week could also identify patients who are less likely to benefit from the treatment in the validation studies. Another important clinical question would be if an earlier switch to an alternative treatment such as trifluridine/tipiracil in the ctDNA non-responders could improve overall survival. The last limitation is that we focused on genetic mutations of ctDNA which was technically feasible. However, epigenetic changes also have an important role in colorectal cancer, and monitoring epigenetic changes in ctDNA is also under development. How it could enhance ctDNA monitoring will be explored in near future. Despite these limitations, we were able to show that ctDNA monitoring could be helpful in patients treated with regorafenib. We believe ctDNA monitoring merits further study in other drugs as well. It could be a sensitive early surrogate of efficacy and a non-invasive tool for elucidating clonal evolution during treatment. Currently, many ongoing clinical trials are incorporating ctDNA in its biomarker scheme.
In summary, we performed a comprehensive analysis of serial ctDNA in colorectal cancer patients treated with regorafenib and show that VAF changes dynamically after treatment. Reduction in ctDNA burden as estimated by sum (VAF) after treatment is an early predictive marker of treatment benefit.