Introduction
Treatment result of esophageal cancer, specifically the five-year survival rate, has improved from 4.3% in 1975-1979 to 14.2% in 1995-2000 [1]. However, compared to other cancers, prognosis of esophageal cancer remains dismal. Although surgery remains the mainstay of treatment, complicated anatomy and neighboring critical structures limit en-bloc resection. Efforts have been made to improve the curative potential of surgery, however, incidence of microscopically positive resection margin (MPRM) is not infrequent (range, 15 to 36.5%) [2-8]. The prognosis of patients with MPRM is considered inferior to that of patients with negative resection margin (NRM), which is defined as no cancer cells at the resection margin [4,5,7,8]. Therefore, many guidelines have suggested that postoperative radiotherapy (PORT) should be offered to patients with MPRM.
However, no randomized prospective study validating the role of PORT for esophageal cancer with MPRM has been reported. In addition, several prospective randomized trials have failed to provethe survival benefit of PORT after en-bloc resection [9-11]. This retrospective analysis was conducted to evaluate the role of PORT for patients with MPRM. As PORT was offered to patients with adverse risk factors after surgery if PORT was not limited by patient performance or preference, analysis was performed indirectly by comparing the treatment results of patients with MPRM with those of patients with NRM.
Materials and Methods
Review of the medical records identified 120 patients with squamous cell carcinoma of the esophagus who underwent curative esophageal resection followed by PORT from June 1984 to March 2008. Of these, 96 patients who had stage II, III disease based on American Joint Committee on Cancer 7th edition [12], no gross residual or metastasis after resection, and no double primary cancer were enrolled for analysis. Stage I patients were also excluded because PORT was not routinely applied to this subset of patients, thus, comparative analysis was not feasible. Six patients who received less than the prescribed dose due to refusal of the patient or poor recovery of postoperative performance were excluded. Therefore, 88 patients remained as a final cohort for this analysis. Preoperative stage was assessed by esophagogastroduodenoscopy, esophagogram, computed tomography (CT) scan of the chest and upper abdomen, and biochemical profile. After 2005, positron emission tomography-CT scan and endoscopic ultrasonography were added to the pre-operative work-up. Esophagectomy with thoracotomy (Ivor Lewis operation) and two-field lymphadenectomy were performed as standard surgical techniques.
PORT was initiated three to eight weeks after surgery. Patients received 45 to 69 Gy (median, 52.0 Gy) with 1.8-2.0 Gy/fraction, daily. Treatments were delivered five times per week. For patients receiving a radiation dose above 45 Gy, CT plan was performedin order to limit the spinal cord dose at 45 Gy.
Twelve patients underwent postoperative chemotherapy; six patients underwent sequential chemotherapy, and six patients underwent concurrent chemoradiotherapy (CRT). The chemotherapy regimen consisted of cisplatin and 5-fluorouracilin 10 patients, cisplatin alone in one patient, and capecitabine in the other patient.
After completion of treatment, patients were followed up at three-month intervals for the first two years and at six-month intervals thereafter. Physical examination and chest X-rays were checked at every visit and radiologic or nuclear imaging was checked periodically and whenever necessary. Toxicities were graded according to the Radiation Therapy Oncology Group (RTOG) criteria.
Recurrence of disease was defined as any clinical or radiographic evidence of relapse. Local recurrence was defined as a recurrence in the anastomosis site or original tumor bed. Regional recurrence was defined as metastasis to regional lymph nodes according to the American Joint Committee on Cancer 7th edition [12]. Overall survival (OS) was defined as the time from the date of surgery to either death or last follow-up. Disease-free survival (DFS) was defined as the time from the date of surgery to either detection of the first recurrence of disease or the last follow-up. Local control (LC) and regional control (RC) was calculated as the time between the date of surgery and the date of first evidence of either local or regional recurrence or last follow-up. Patients who died or were lost to follow up without evidence of local or regional relapse were censored for LC and RC.
The Kaplan-Meier method was used for survival analyses and the log-rank test was used to compare Kaplan-Meier events. Chi square test or Fisher's exact test was used to compare discrete variables in group A and group B. Multivariate analysis was performed with Cox proportional hazards model using a backward stepwise method. Parameters with p-value less than 0.05 were considered statistically significant. Statistical analysis was performed using SPSS software ver. 17.0 (SPSS Inc., Chicago, IL).
Results
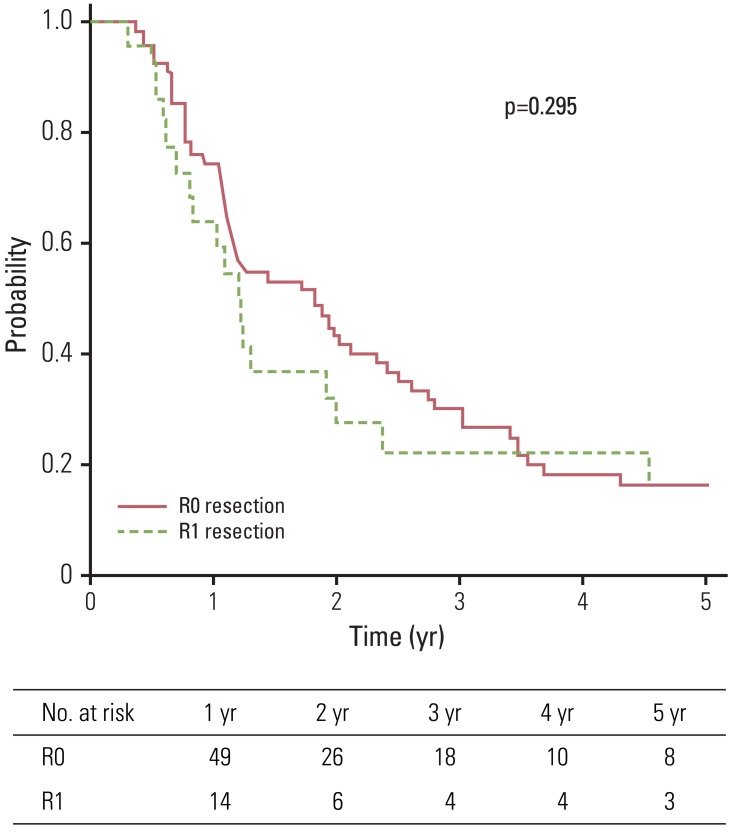
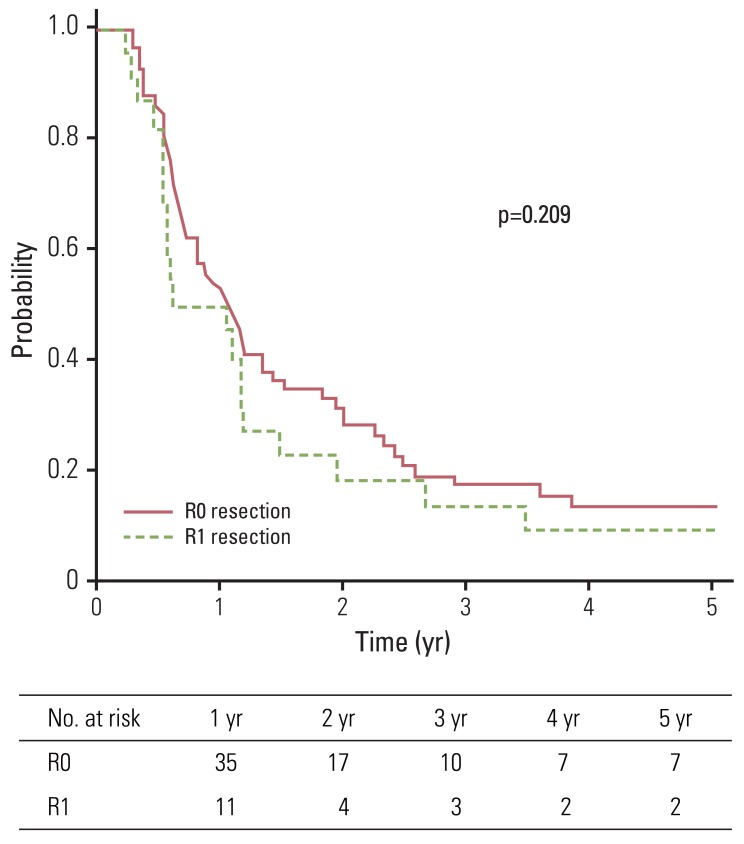
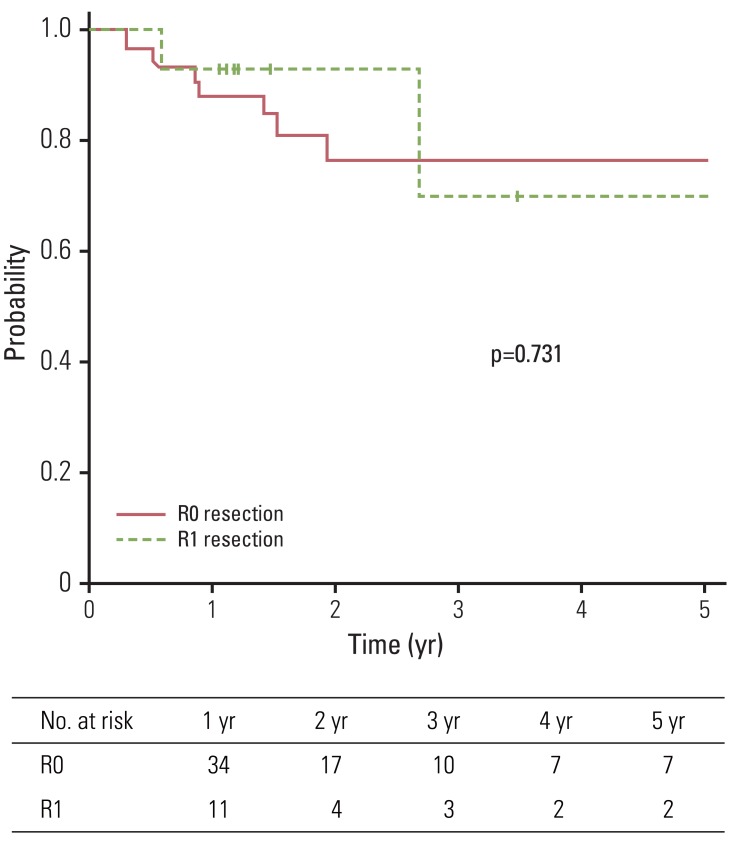
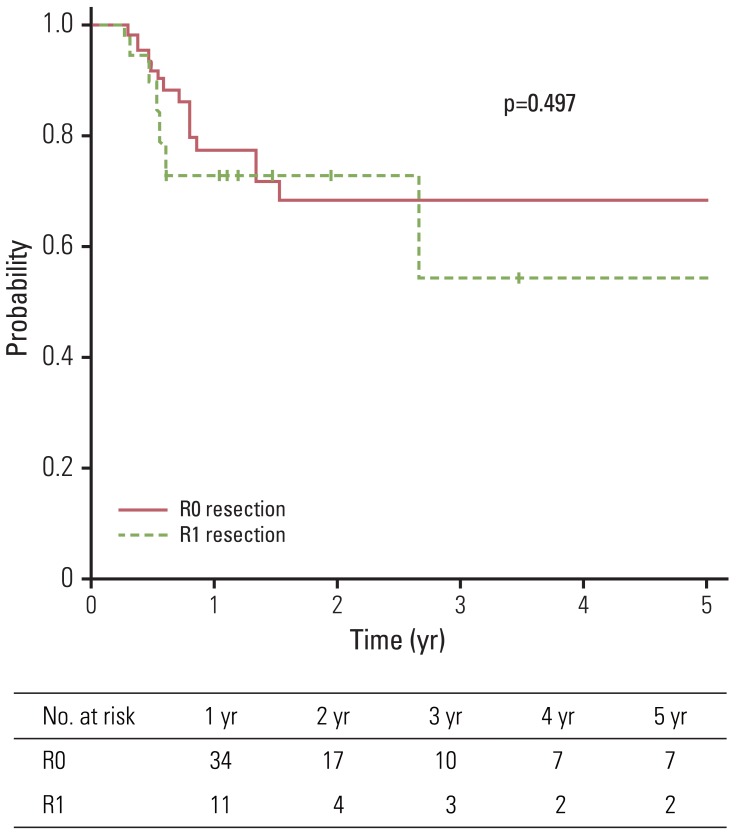
Median follow-up duration of all patients and living patients was 16 months (range, 4 to 115 months) and 68 months (range, 18 to 115 months), respectively. Two-year and five-year OS of all patients were 39.1% and 16.0%, respectively. Patients were divided into two groups according to microscopic residuum status: NRM (group A) and microscopic residuum (group B). A summary of the characteristics of patients and tumors is shown in Table 1. No statistically significant differences with regard to sex, age, performance status, tumor location, pathologic tumor stage, pathologic nodal stage, stage group, or the radiation dose were observed between the two groups. Five-year OS for group A and group B were 15.9% and 16.4%, respectively (Fig. 1). Five-year DFS and LC for the respective groups were 13.5%, 9.1% and 76.3%, 69.6%, respectively (Figs. 2 and 3). Five-year RC for group A and group B were 68.4% and 54.5%, respectively (Fig. 4). No statistically significant differences in terms of OS (p=0.295), DFS (p=0.209), LC (p=0.731), and RC (p=0.497) were observed between the two groups.
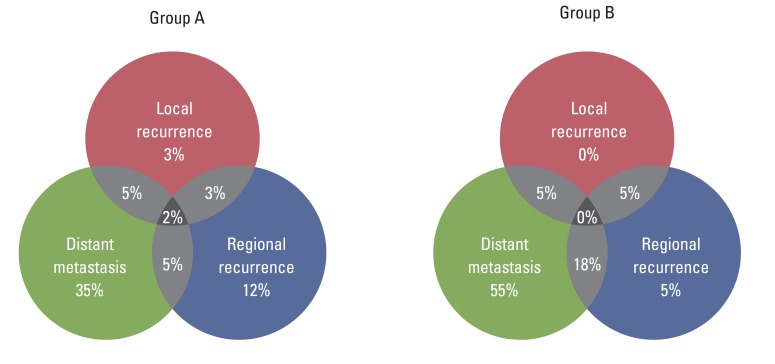
Overall, 63 recurrences were detected during follow-up. Distant metastasis was the dominant cause of failure (76%). Lung was the most frequent site of distant failure (20%), followed by bone (15%), liver (14%), pleura or pericardium (9%), and others (3%). Eleven patients had local recurrence and 21 patients had regional recurrence. No statistically significant differences in patterns of initial recurrence were observed between the two groups (p=0.252) (Fig. 5).
In univariate analysis (Table 2) and multivariate analysis, no prognostic factors were found to show an association with OS, DFS, LC, and RC. A summary of reported significant complications, defined as grade 3 or higher toxicity according to RTOG criteria, is shown in Table 3. One patient in group A died of gastric ulcer bleeding 19 months after PORT.
Discussion
Neoadjuvant CRT is a more favored approach to treatment of patients with locally advanced resectable esophageal cancer [13]. In a recent clinical trial, addition of this approach to surgery for patients with resectable disease was reported as beneficial [14]. However, a substantial number of esophageal cancer patients world wide still undergo upfront surgery [15]. Some of these patients have more extensive disease than anticipated by diagnostic workup before surgery. There are no established indications for adjuvant therapy after surgery. However, patients with MPRM by R1 resection were generally considered candidates for PORT [16]. Because of poor outcome of patients with MPRM, postoperative CRT is widely accepted not only in clinical practice but also in current guidelines for patients who have not undergone neoadjuvant radiotherapy [17]. However, survival benefit of this approach to patients with MPRM after surgery has not been thoroughly studied. To evaluate the effect of PORT in the MPRM group, direct comparison between surgery alone vs. PORT after surgery would be ideal. However, designing a randomized study with a surgery alone arm for patients with MPRM could lead to ethical issues, and, thus, such a study is practically not feasible. Therefore, the effect was evaluated indirectly by comparing the results with those of the NRM group.
The prognostic importance of MPRM after surgery in esophageal cancer has been reported by several investigators and the presence of microscopic residual disease is one of the strongest predictors of poor outcome [7,18-20]. Thus, in various studies, the prognosis of patients with MPRM in esophageal cancer has been consistently reported to be inferior to that of patients with NRM, regardless of preoperative therapy. Zafirellis et al. [7] reported the results of 156 prospectively collected patients with esophageal carcinoma undergoing surgery without adjuvant or neoadjuvant treatment. Microscopic residuum was found in 36.5% of the patients and their five-year survival was significantly inferior to that of patients with NRM (p<0.001 inmultivariate analysis). Hofstetter et al. [20] reported the single institution results of 994 patients who underwent curative esophagectomy. Various types of neoadjuvant therapies were offered in 53% of patients. Results of multivariate analysis revealed that R0 resection was the most significant factor for long-term survival (hazard ratio, 0.46; 95% confidence interval, 0.35 to 0.61; p=0.0001). Mulligan et al. [5] reported the results of 212 patients treated with either preoperative CRT and surgery or surgery alone. Five-year survival was significantly inferior for patients with MPRM (p<0.001 inmultivariate analysis). Kelsen et al. [4] reported the results of 443 patients treated with or without preoperative chemotherapy. Three-year survival was 29% for patients undergoing an R0 resection and 12% for patients undergoing a R1 resection (p<0.0001 inmultivariate analyses).
In contrast, results of our study showed that after PORT, difference in treatment results of patients with or without microscopic residuum was statistically insignificant in terms of OS, DFS, LC, RC, and failure pattern. These results would mean that PORT is at least effective for patients with MPRM. This finding is in contrast to results from other studies where adjuvant radiotherapy was not used (Table 4). However, in the current study, the results forthe NRM group were far from satisfactory. There could be several explanations for these results. First, in contrast to other studies, the current study excluded stage I patients, and more than half of the accrued patients had stage III disease. Five-year survival of surgically treated esophageal cancer was 34.8%, which is comparable with that reported in other studies, according to a previous report from our institution. However, five-year survival of stage III patients was only 14.9% [21]. Second, there could be a selection bias of patients with adverse prognostic factors who were referred for PORT. Third, most patients (90%) received radiotherapy alone and not concurrent CRT. Fourth, 34% of the patients received a radiation dose lower than 50 Gy, which is considered insufficient [22]. Finally, although it was not statistically significant, there was a trend toward improved survival for patients treated in the later period of accrual. Five-year survival for those treated in the 80's and 90's was 12%, whereas, that for those treated in the new millennium was 25% (p=0.096). This difference was marked for stage II patients, with 14% and 40% for the respective treatment period (p=0.044), whereas that for stage III patients was 10% and 12% for the respective treatment period (p=0.682, data not shown). As the current study enrolled more patients in the earlier period, treatment results of the patients would have been negatively influenced.
Poor outcome of the NRM group from potential bias is a shortcoming of our study. However, considering that insufficient dose of radiation and infrequent use of concurrent chemotherapy also affected survival of patients with MPRM, comparable outcomes of the MPRM group might be meaningful. Considering that a randomized study would not be readily conducted and that there is no currently available evidence, despite weakness of the study design, our study could provide a basis for the use of PORT in patients with MRPM. In addition, results ofthis study suggest that long-term survival is possible even for patients with MPRM after PORT.
Pattern of failure of the MRPM group also differed from that of other studies. In Kelsen et al.'s study [4], 41% of MPRM patients treated with surgery alone showed locoregional recurrence as the first site of failure. Mulligan et al. [5] reported that patients with margin involvement after surgery alone experienced local recurrence in 27% of cases. In contrast, in the current study, locoregional failure as the initial site of relapse was a mere 10% among patients treated with PORT for MPRM after surgery. These findings suggest a potential role of PORT in locoregional control.
Conclusion
In summary, after PORT, difference in treatment results of patients with or without microscopic residuum was statistically insignificant. In addition, long-term survival with locoregional control was achieved in some patients even with margin involvement. Thus, PORT may play a role, especially for patients with margin involvement. However, as treatment results are still far from satisfactory, further treatment intensification should be considered. Regarding the high incidence of both locoregional and distant failure, treatment intensification in the form of higher radiation dose in combination with chemotherapy should be considered.