Introduction
Esophageal cancer is the seventh most common malignancy and the sixth most common cause of cancer-related mortality globally [1]. Trimodality treatment (TMT) of chemoradiotherapy (CRT) followed by surgery is currently accepted as the standard treatment in locally advanced esophageal cancer [2–4]; however, some studies reported that surgical resection may be omitted without serious impact on survival in cases showing response to CRT [5,6]. This may be considered a reasonable approach considering the high rates of mortality and morbidity associated with surgical resection [2,7,8]. In addition, patients are often reluctant to undergo surgery after the completion of neoadjuvant CRT, especially when they show good clinical response to CRT, experience the disappearance of the main symptoms, or show incomplete recovery of performance after chemoradiation.
However, the term “response” includes a wide range of disease status in the real-world setting, from partial responses of a slight decrease in the disease status to complete disappearance of the tumor. Moreover, it may be difficult to evaluate the clinical response due to treatment-induced edema and esophagitis, which do not subside at the time of post-treatment reevaluation. Therefore, it is necessary to accurately define the criteria for “response”, which is complicated due to the individual variability among clinicians in interpreting treatment responses. To minimize these variations and possible confusion, the use of the criteria of “complete response” may be more reasonable and practical despite the controversy on the evaluation methods.
We assume that surgical resection may be omitted only in responders to CRT, because patients may miss the optimal timing for surgical resection and cure. However, there is a limited amount of available data on the survival benefit of esophagectomy in patients who show a clinically good response after CRT for locally advanced esophageal squamous cell carcinoma (ESCC), and the available results are not consistent [9–12]. Therefore, in this study, we evaluated the long-term effect of esophagectomy in patients with ESCC who received concurrent CRT followed by surgery (TMT) in terms of their clinical response to CRT.
Materials and Methods
1. Study population
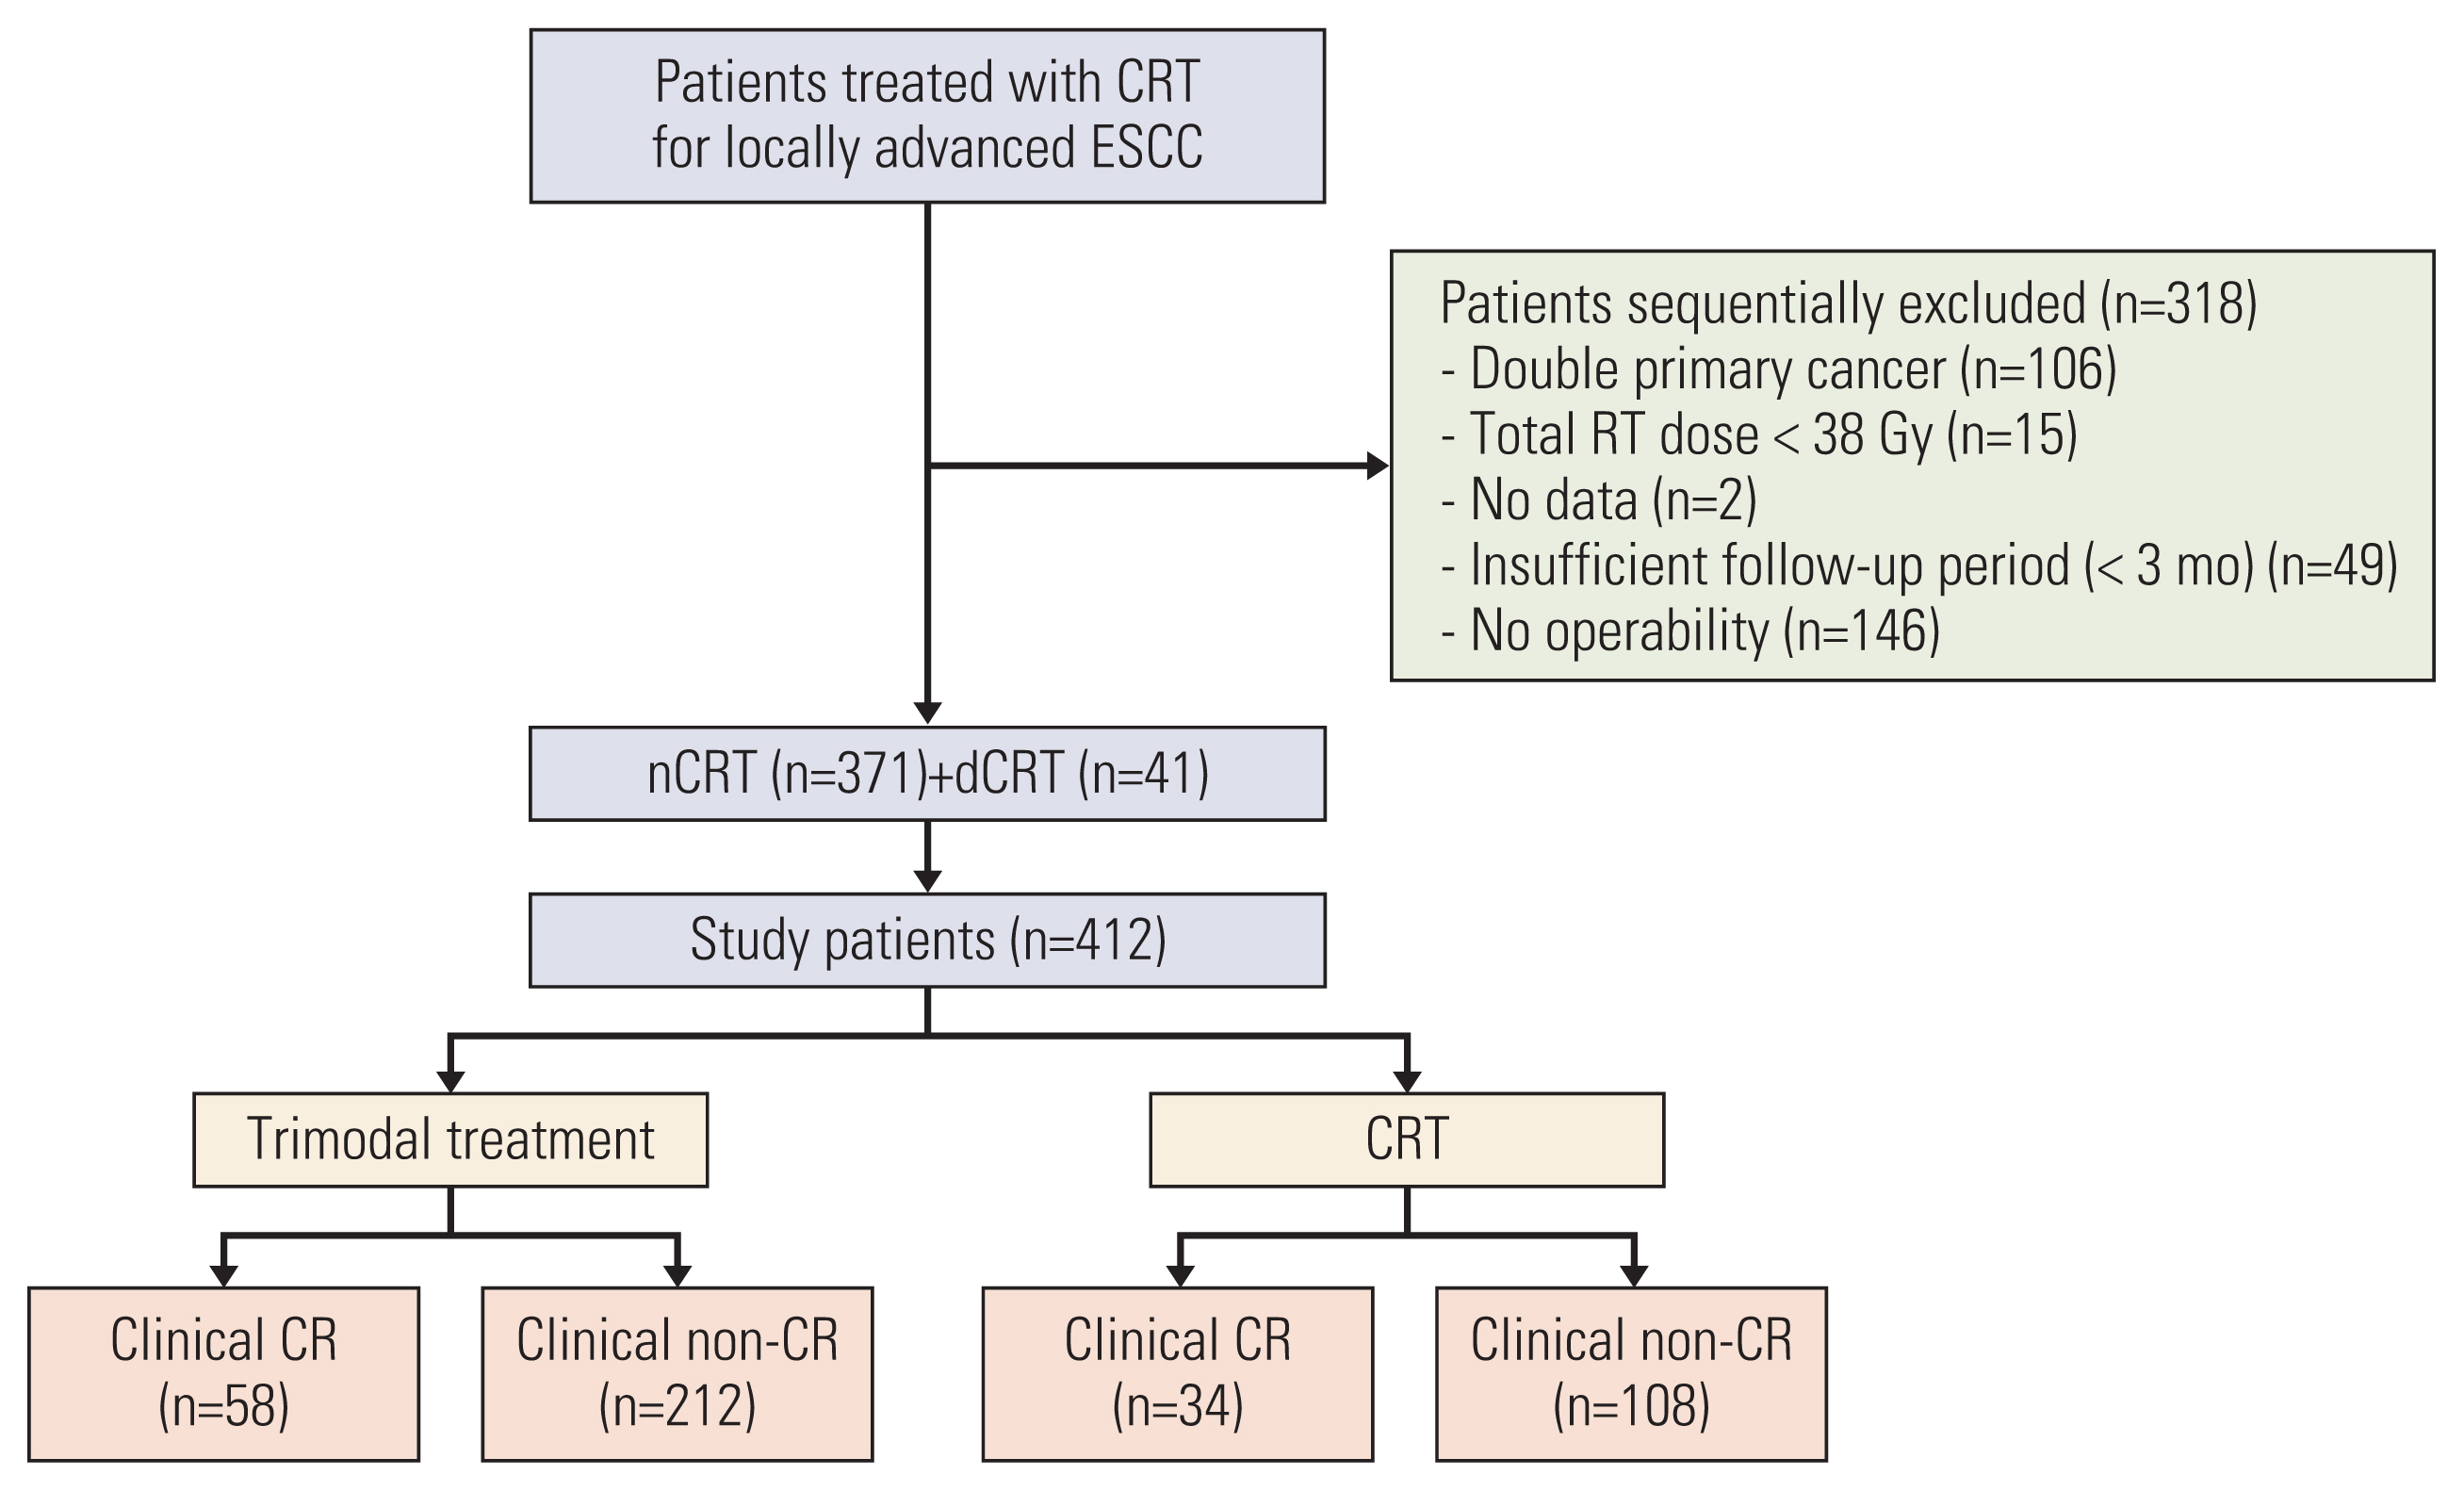
We identified 730 patients who were treated with TMT or CRT at our center between January 2005 and December 2015 for locally advanced esophageal cancer with squamous cell carcinoma. The inclusion criteria were as follows: (1) histologically confirmed resectable but advanced ESCC (cT2–4/anyN/M0 or anyT/N+/M0 stage), (2) medically operable status, (3) Eastern Cooperative Oncology Group (ECOG) performance status of ≤ 2, and (4) no history of thoracic surgery. The exclusion criteria were as follows: (1) double primary cancer, (2) suboptimal radiotherapy (RT) dose (< 38 Gy), and (3) insufficient follow-up duration (< 3 months) without oncologic event. Accordingly, 412 patients were included in this analysis (Fig. 1).
2. Evaluation
The initial diagnostic evaluation included detailed medical history, physical examination, laboratory blood analysis, esophagogastroduodenoscopy (EGD), endoscopic ultrasound, computed tomography (CT) scans of the chest and abdomen, esophagography, and positron emission tomography–CT (PET-CT) scan. Four weeks after the completion of CRT, treatment response was evaluated with EGD and biopsy, chest CT scan, and PET-CT.
Clinical complete response (cCR) after CRT was defined as the absence of residual tumor on endoscopy with biopsy and metabolic complete remission (CR) on PET scan. Metabolic CR was defined as the complete resolution of fluorodeoxyglucose uptake in the primary tumor and metastatic lymph nodes or indistinguishable initial tumor site from the surrounding tissue in cases of diffuse esophagitis with increased uptake within a radiation field.
After treatment, regular follow-up examinations were performed every 3 months during the first 2 years, and every 6 months thereafter until 5 years. Toxicities during and after treatment were evaluated using the Common Terminology Criteria for Adverse Events (ver. 4.03). Surgical complications were assessed by the Clavien-Dindo classification.
3. Treatment
Treatment strategies for locally advanced esophageal cancer were primarily determined by a multidisciplinary team. Several patients who could not be assessed by the multidisciplinary team were assessed by individual members of the multidisciplinary team, including thoracic surgeons, medical oncologists, gastroenterologists, and radiation oncologists.
The median prescribed radiation dose was 46 Gy for neoadjuvant treatment and 54 Gy for definitive CRT. LightSpeed RT (GE Medical Systems, Palo Alto, CA) was used for CT simulation with intravenous contrast enhancement. The gross tumor volume (GTV) was delineated on each slice of the acquired CT images and was assisted by the information from PET-CT, chest CT, and EGD. During the period of 3D treatment, primary tumor and mediastinal lymph node were treated with margins of 5 cm in the cranio-caudal direction and 2 cm in the lateral direction. The supraclavicular lymph nodes were included when the GTV existed in the upper thoracic esophagus, and the celiac trunk was included when the GTV was in the mid or distal thoracic esophagus. After the introduction of intensity-modulated radiotherapy (IMRT), the clinical target volume (CTV) margin was reduced to 3 cm in the S-I direction and 1 cm in the radial direction. The planning target volume margin was 7 mm in the radial direction and 10 mm in the cranio-caudal expansion of the CTV.
All patients were treated with capecitabine-cisplatin (XP) or 5-fluorouracil–cisplatin (FP) chemotherapy for concurrent CRT. For XP chemotherapy, patients received capecitabine 1,600 mg/m2/day for 5 days plus cisplatin 30 mg/m2/day on the first day, weekly. For FP chemotherapy, patients received cisplatin 60 mg/m2/day on the first day plus 5-fluorouracil 1,000 mg/m2/day on the second day for 4 days, every 3 weeks.
All patients were routinely evaluated for operability by an experienced thoracic surgeon. Surgery was performed 6 to 8 weeks after the completion of CRT using either the Ivor-Lewis or McKeown approach.
4. Statistical analysis
Continuous variables were compared using the t test, and categorical variables were compared using the Fisher exact test or chi-squared test. The rates of overall survival (OS), local recurrence–free rate (LRFR), and distant metastasis–free rate (DMFR) were estimated using the Kaplan-Meier method and compared using the log-rank test. Inverse probability treatment weighting (IPTW) analysis based on the propensity score was used to reduce the impact of selection bias and potential confounding factors. Propensity scores were calculated using a logistic regression model using the following variables: sex, age, Charlson-Deyo score, alcohol, smoking, ECOG performance status, tumor location, and tumor stage. The absolute standardized differences (STDs) were used to check the balance after IPTW, and weighted Cox regression models with robust standard errors were used for the comparison of survival after IPTW adjustment. Also, tests for interaction were performed to assess the heterogeneity of treatment effect among the cCR subgroups. p-values less than 0.05 were considered statistically significant. All statistical analyses were performed with SAS ver. 9.4 (SAS Institute Inc., Cary, NC) and R ver. 3.6.1 (R Foundation for Statistical Computing, Vienna, Austria).
Results
1. Patient characteristics
Among the 412 study patients, 270 patients (65.5%) received TMT and 142 (34.5%) received CRT. The baseline characteristics of the patients are summarized in Table 1. The CRT group were older, had a significantly higher Charlson-Deyo score, and had a higher proportion of patients with poor differentiation. The balance of the variables was markedly improved after IPTW adjustment (S1 Table), with all absolute STDs after weighting being less than 0.1 except for the Charlson-Deyo score (STD=0.106).
2. Post-CRT response
After the completion of CRT, all patients were evaluated by EGD with/without biopsy, CT scan, and PET-CT. One patient did not undergo a PET-CT scan but was confirmed with a residual tumor on EGD. The median time from the last day of CRT to PET-CT was 0.9 months (range, 0.3 to 2.8). Metabolic CR was achieved in 241 patients (58.6%). Of the 412 patients, 119 (28.8%) showed a complete response on EGD. Among the 353 patients (85.7%) who underwent endoscopic biopsy, 324 (91.8%) had negative biopsy results.
A total of 92 (22.3%) patients showed cCR. In the TMT group, 119 (44.1%) patients had a pathologic complete remission (pCR), which was more common in the cCR group than in the non-cCR group (36/58 [62.1%] vs. 83/212 [39.2%], p=0.003).
3. Oncologic outcome
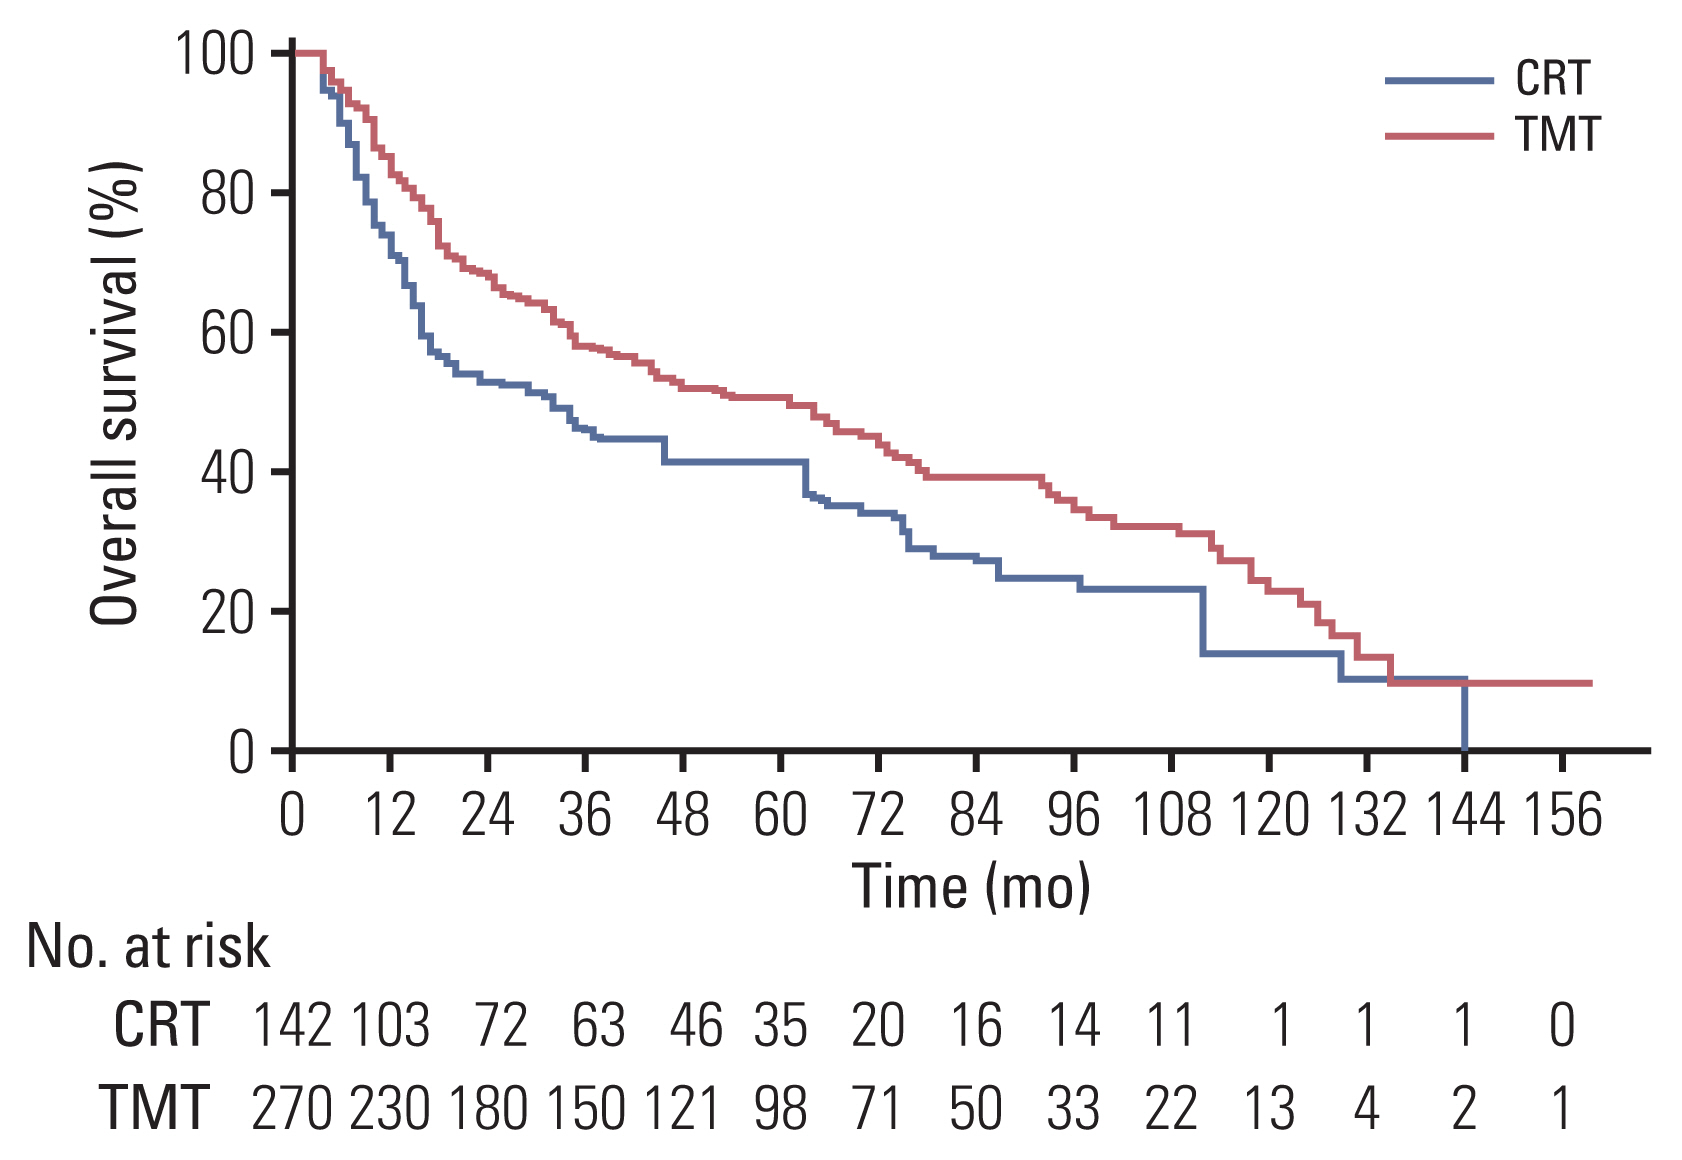
At the time of analysis (May 2020), 150 patients were alive (TMT, 109 [40.3%]; CRT, 41 [28.9%]). The median follow-up duration was 39.2 months (range, 5.3 to 164.0) in the entire cohort and 67.5 months (range, 13.6 to 164.0) in the living patients. The median OS duration was 64 months (95% confidence interval [CI], 44 to 74) and 32 months (95% CI, 18 to 38) for the TMT group and the CRT group, respectively (p < 0.001) (S2 Fig.). After IPTW adjustment, the TMT group still had a superior OS compared with the CRT group (p=0.016). The 2- and 5-year OS rates were 67% and 50% in the TMT group, and 52% and 41% in the CRT group, respectively (Fig. 2).
The patterns of failure are summarized in Table 2. Treatment failures were observed in 29 of the 92 cCR patients (31.5%) at the time of analysis. The sites of the first failure in the TMT group were distant metastasis in five (8.6%), local recurrence in two (3.4%), and both distant metastasis and local recurrence in four patients (6.9%).
In the CRT group, the major patterns of failure were local recurrence in 10 (29.4%), distant metastasis in three (8.8%), and both local recurrence and distant metastasis in five patients (14.7%). The TMT group had a significantly better LRFR and DMFR than did the CRT group (hazard ratio [HR], 0.362; 95% CI, 0.252 to 0.519; p < 0.001 and HR, 0.585; 95% CI, 0.388 to 0.883; p=0.011, respectively). These results were also observed in multivariate and IPTW-adjusted analyses (Table 3). The cumulative incidences of local recurrence and distant metastasis are shown in S3 Fig. The 2- and 5-year progression-free survival rates were 67% and 49% in the TMT group and 52% and 34% in the CRT group, respectively (p=0.003) (S4 Fig.). Of the 63 patients in the CRT group who developed local recurrence, 10 (15.9%) had salvage esophagectomy and the median time to salvage surgery was 6.7 months (range, 3.4 to 3.1 months). Of the 10 patients with salvage esophagectomy, eight (80%) achieved R0 resection and the median survival time after salvage surgery was 9.4 months (range, 3.7 to 31.4 months). Further details of salvage treatment are presented in S5 Table.
4. Subgroup analysis after IPTW
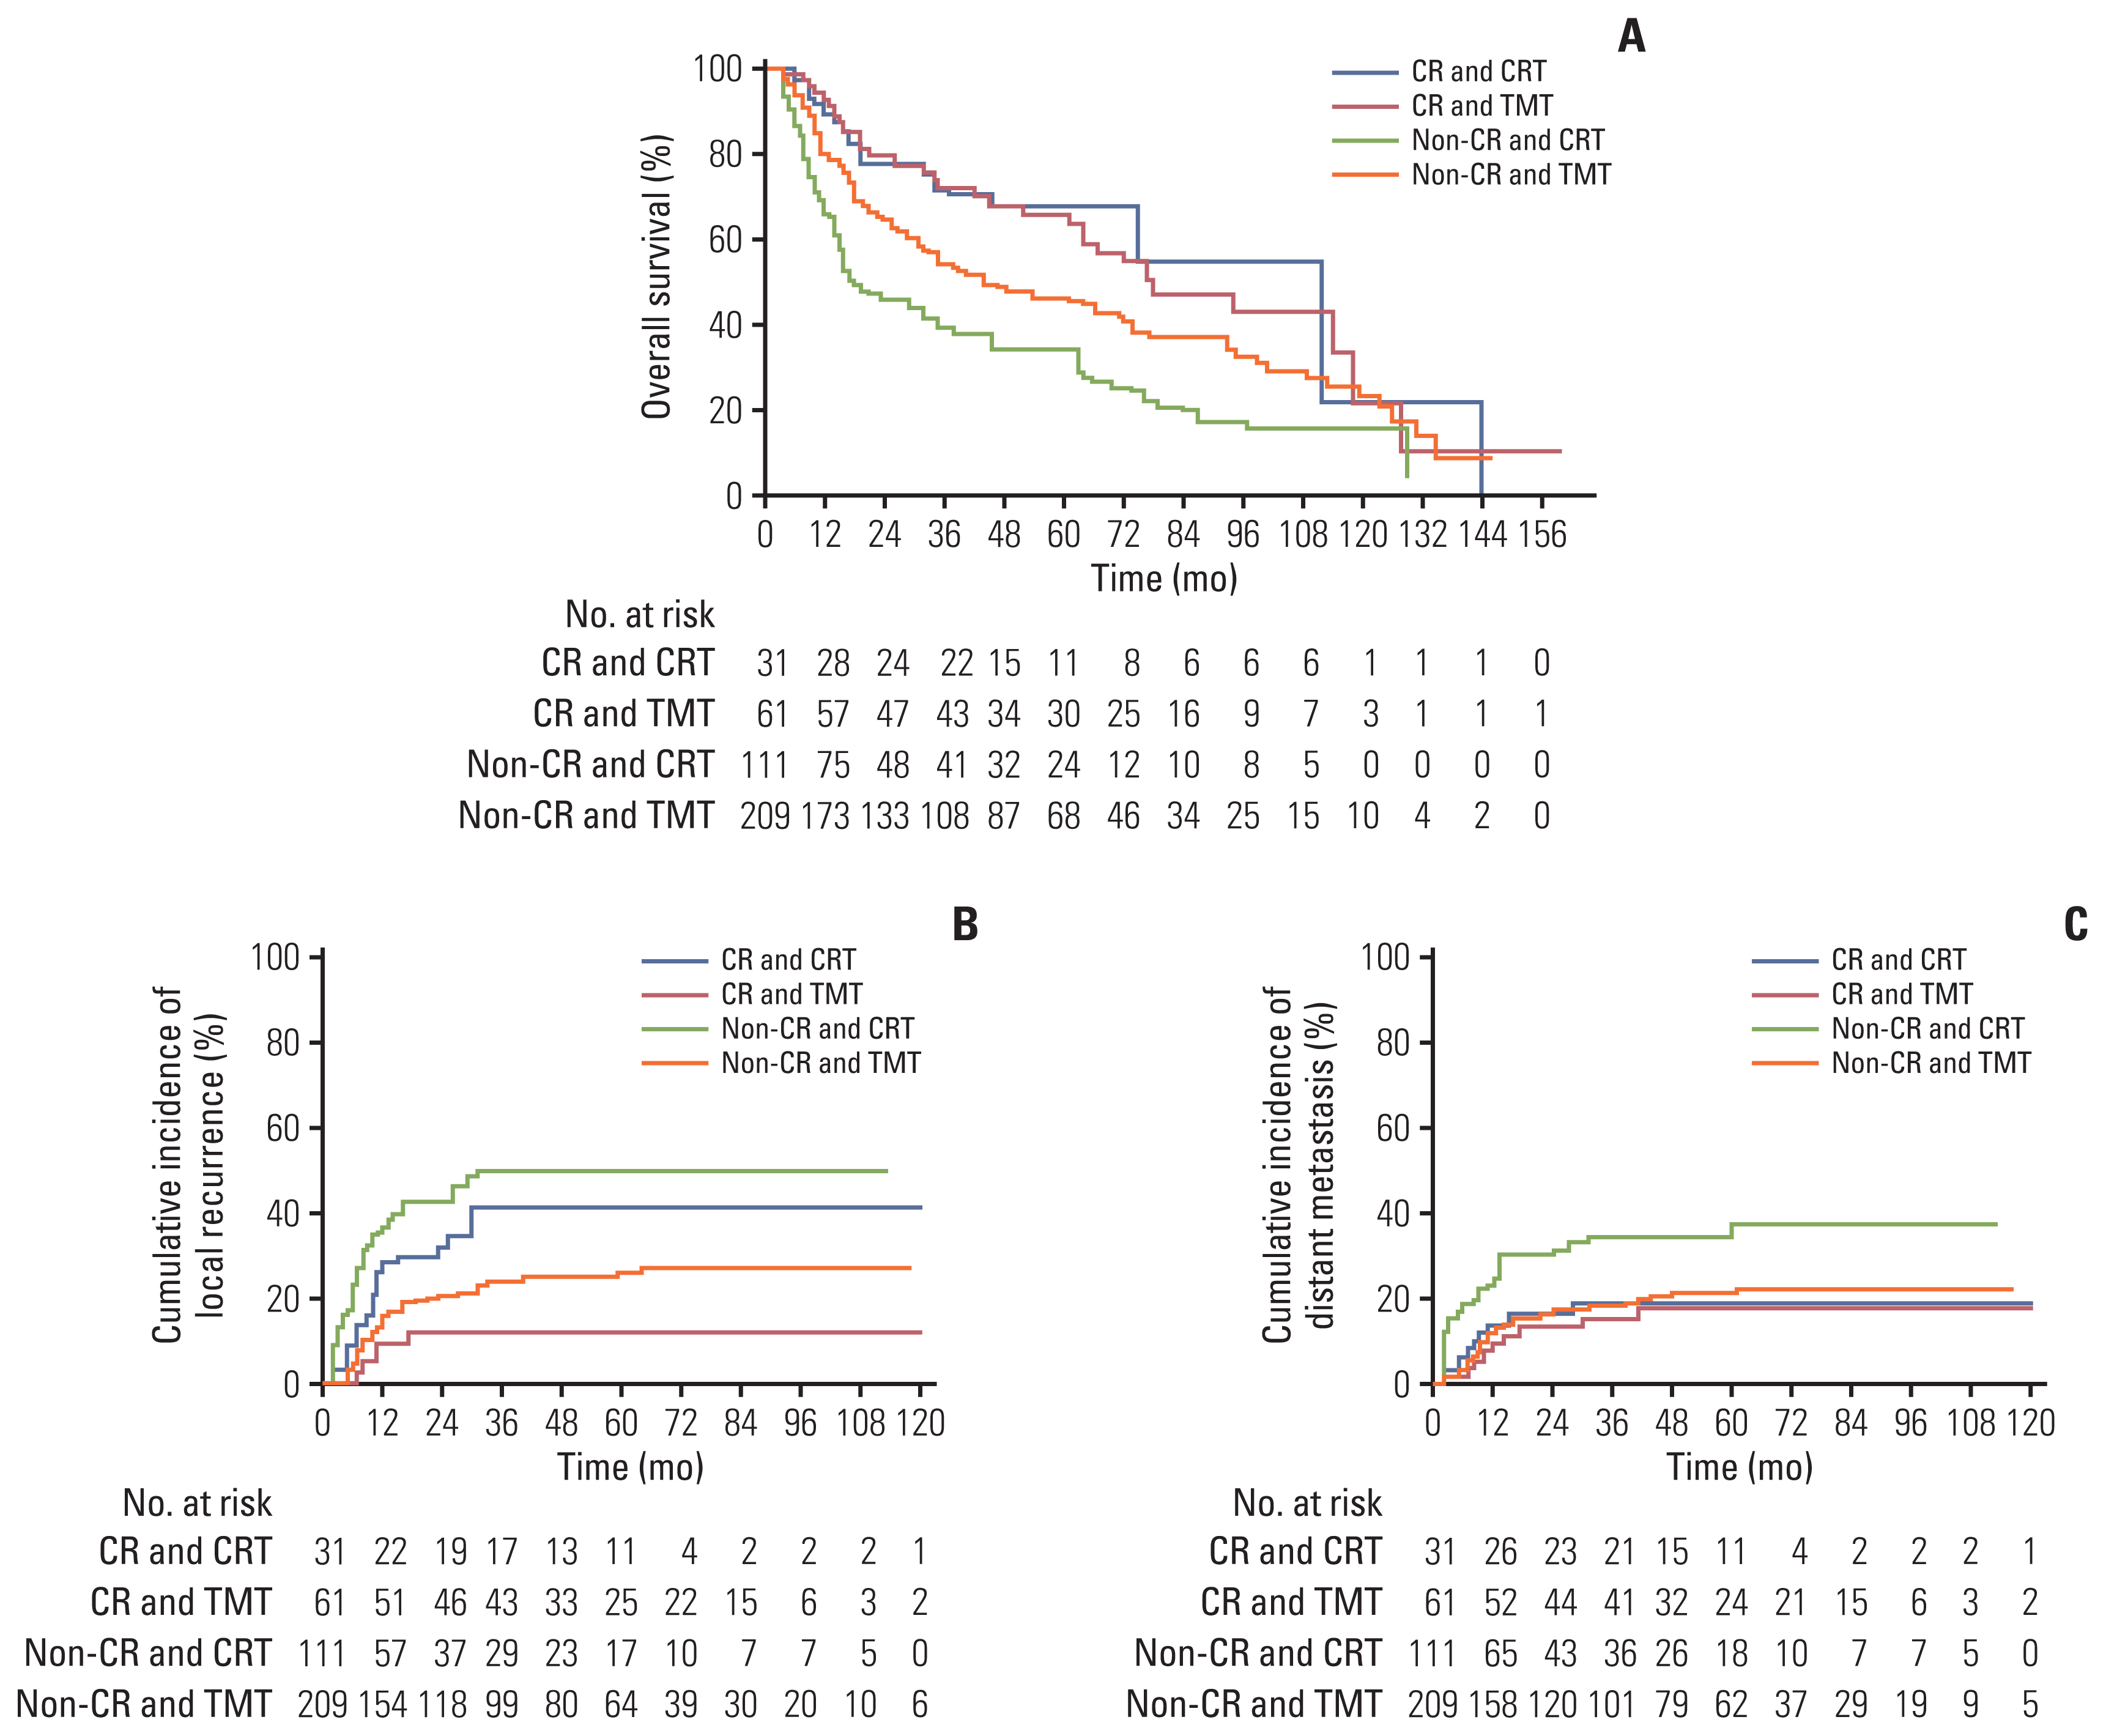
In the cCR group, OS and DMFR were not significantly different between the TMT group and the CRT group (HR, 1.027; 95% CI, 0.561 to 1.880; p=0.93 and HR, 0.905; 95% CI, 0.324 to 2.524; p=0.85, respectively) (Table 4). The 2- and 5-year OS rates were 79% and 65% in the TMT group and 77% and 67% in the CRT group, respectively (Fig. 3A). The 2- and 5-year distant metastasis rates were 13% and 18% for the TMT group and 16% and 19% for the CRT group, respectively. However, the LRFR was higher in the TMT group compared with the CRT group (p=0.003). The 1-, 3-, and 5-year local recurrence rates were 9%, 12%, and 12% in the TMT group and 28%, 41%, and 41% in the CRT group, respectively. There was no significant interaction effect between TMT and CRT in terms of OS, LRFR, and DMFR (Table 4).
In the non-cCR subgroup, the TMT group showed significantly superior rates of OS, DMFR, and LRFR compared with the CRT group (p < 0.001, p=0.001, and p < 0.001, respectively) (Table 4). The 2- and 5-year OS rates were 64% and 46% in the TMT group and 45% and 33% in the CRT group, respectively (Fig. 3A). The 1-, 3-, and 5-year local recurrence rates according to the Kaplan-Meier curve were 15%, 23%, and 26% for the TMT group and 37%, 50%, and 50% for the CRT group, respectively (Fig. 3B). The 2- and 5-year distant metastasis rates were 17% and 21% for the TMT group and 32% and 36% for the CRT group, respectively (Fig. 3C).
5. Toxicity
Acute complications after TMT and CRT are summarized in Table 5. CRT did not result in any grade 4 toxicities; in contrast, surgery resulted in more severe complications including 18 cases of grade 4 toxicities. The 90-day postoperative mortality rate was 4.4% (12/270).
Discussion
Currently, TMT is regarded as the standard treatment for locally advanced esophageal cancer, with its role having been established by the results of randomized controlled trials (RCTs) on adenocarcinoma [2,4] and squamous cell carcinoma (SCC) [13]. However, considering the high rate of pathologic CR in patients with SCC (~50%), it may be possible to omit esophagectomy in good responders if they could be identified prior to surgical resection. In the real-world setting, the role of esophagectomy in good responders after CRT is yet to be firmly established. Many RCTs that compared between esophagectomy and no surgery reported that esophagectomy did enhance the survival rate in no responders but not in good responders [5,6]. Yet, those RCTs included partial responders and viable tumor cells might have remained in the esophagus and regional lymph nodes.
In order to focus on testing the possibility of safely omitting esophagectomy, remnant tumors in the mediastinum should be considered for performing a successful study. Accordingly, the study by Piessen et al. [9] was meaningful as it only enrolled cCR cases and reported the benefit of esophagectomy in terms of survival (58.9% vs. 33.4%, p= 0.001); however, their study had limited generalizability because it excluded patients with short follow-up durations of 3 years or less, and included both adenocarcinoma and squamous cell carcinoma, which have different chemoradiosensitivity [14].
Other investigators also tried to identify the benefit of esophagectomy in cCR patients with SCC, but none has demonstrated significant advantages in terms of survival. Castoro et al. [10] investigated 77 SCC patients who achieved cCR after neoadjuvant CRT, and did not observe a significant difference in 5-year survival (50% vs. 57%, p=0.99). Chao et al. [11] also analyzed 150 SCC patients who underwent endoscopic CR after CRT and reported no significant survival benefit with esophagectomy. It should be noted that PET scan was not fully available during the study periods of the studies by Castoro et al. [10] and Chao et al. [11], and that the response evaluation was primarily dependent on endoscopy findings. Therefore, it is possible that their study patients might not have achieved cCR according to current standards that include metabolic response on PET scan, and might have had residual tumors in the extraluminal area such as the regional lymph nodes.
We have published a similar study with more advanced evaluation methods such as PET scan, and reported that while esophagectomy resulted in significantly improved disease-free survival, it did not result in a significant improvement in OS [12]. We reasoned that such statistically null findings in OS likely stemmed from the small number of patients, and therefore expected to find a positive result in this updated study with a larger cohort size. As a result, we found that esophagectomy was associated with a significantly better OS as well as LRFR and DMFR in the entire cohort. However, we could not find a significant beneficial effect of surgical resection in the subgroup analysis on patients with cCR, which indicates that the improvement in LRFR was not directly translated to an improvement in OS. We could only reaffirm that esophagectomy was beneficial for patients without cCR.
Although the exact reason why we could not observe a significant difference in OS in the cCR patients is unclear, the following factors may have been involved. First, surgical mortality might have been involved in the nullification of the survival benefits of esophagectomy. For example, robot-assisted surgery was introduced to our center for esophageal cancer in 2010, and there may have had been a period of higher rates of complication and mortalities during the learning curves of the surgeons. Yet, the transient increase in mortality was not enough to offset the difference in LRFR. Second, salvage esophagectomy might reduce the mortality from local recurrence in CRT patients. As salvage esophagectomy was performed in 15.8% of cases with locally recurrent tumors and was not enough to explain the negative result, it is worth noting that 80% of those cases had R0 resection without any in-hospital mortality or death within 90 days after salvage surgery. Markar et al. [15] conducted a multicenter study that demonstrated the role of salvage esophagectomy, in which salvage esophagectomy after definitive CRT did not result in significant differences with TMT in terms of in-hospital mortality, 3-year overall survival, and disease-free survival in 848 patients [15]. Third, the characteristics of the CRT group (e.g., higher age, poor differentiation, and higher Charlson-Deyo score) may have predisposed the patients to poor prognosis despite the correction effort. Fourth, the effect of distant metastasis on survival in the cCR cases might have been strong, and surgery as a local treatment could be limited in significantly affecting the overall survival. However, as the rate of distant metastasis was around 9% in both groups (Table 2), the effect of distant metastasis on survival does not seem to be large enough to offset the increase in LRFR. Collectively, we assume that these four possible explanations are likely to have led to the null findings in survival in this study.
In terms of radiation dose, our patients received a neoadjuvant dose of around 45 Gy and some patients received 50–54 Gy for definitive aim. Some investigators insisted on the use of 60 Gy or higher for definitive CRT considering that local recurrence occurs in about half of patients as in our current study. Yet, there is not enough empirical evidence to change the current standard dose, which was established based on RCTs; in the near future, however, it may be feasible to administer higher doses through more advanced techniques such as IMRT and Proton. In order to determine the role of esophagectomy after CRT, we chose a rather narrow range of conventional radiation doses because we sought to perform response evaluation at one month after treatment. In order to use a higher radiation dose, a treatment break of 1 month should be considered prior to the additional dose, whose effect is not established at present.
The present study has several limitations. First, it is a retrospective analysis and the result might have been influenced by potential selection bias. Although IPTW-adjusted analysis was performed to adjust for the differences in patient characteristics, unobserved confounding factors may have still been present. Second, the rate of pCR was higher than that of cCR, which suggests that our criteria for cCR may have been overly strict and not representative of the real-world setting. Third, we focused on high-grade treatment-related toxicities and may have underestimated lower grade toxicities and their possible effects. Forth, histological confirmation of recurrent lesions could not be performed in every patient.
Despite these limitations, our study provides clinically meaningful results because the treatments were performed according to a prospectively established study protocol by an experienced multidisciplinary esophageal cancer team. Moreover, we applied the IPTW adjustment to perform a reliable analysis. Although some of our results did not support our initial hypothesis, this study showed that esophagectomy after CRT was associated with improved survival compared with CRT and we hope that our study may be used as a reliable reference for future studies.
Esophagectomy after CRT was associated with significantly better survival results and lower rates of local recurrence and distant metastasis rates compared with CRT. As such effects were more prominent in patients who did not achieve cCR, esophagectomy may be considered in such patients. In complete responders, however, the treatment decision should be made by considering the pros and cons of esophagectomy, which was effective for improving LRFR but not OS.