Introduction
Obesity is a well-known risk factor of colorectal cancer (CRC) [1–3]. Proinflammatory factors, immune suppression, and changes in the metabolic functions of adipose tissue play an active role in establishing and promoting tumoral progression [1,4]. For this reason, many researchers have investigated the fundamental association of obesity with prognosis [5–13], however, the relationship is yet to be elucidated in patients with CRC. Although it is widely accepted that people with obesity are prone to cancer [14], many report that patients with cancer and overweight live longer [7,10,12], which is a phenomenon called the ‘obesity paradox’. The reason for this remains a controversial issue. Some studies suggest that methodological errors, such as selection bias, reverse causality, and collider bias could explain this paradox [3,10].
Furthermore, the distribution of body weight significantly varies among races. Asians tend to store their body fat viscerally rather than subcutaneously [15–17]. Body mass indexes (BMIs) of Asians tend to be lower than those of Caucasians, and even at the same BMI, Asians experience less favorable prognoses than Caucasians [16,17]. To account for this discrepancy, the World Health Organization (WHO) set different BMI cutoff values for obesity [15]. However, since previous research has focused primarily on Caucasians, further evidence regarding the obesity paradox in Asians is needed. Regarding Asians, the obesity paradox was reported less frequently. Although previous studies have suggested BMI cutoff values that predict survival of CRC patients [4,18], more data is needed as controversy remains on the existence and mechanism of obesity paradox.
We therefore analyzed the association between BMI and two main outcomes, overall survival (OS) and recurrence-free survival (RFS) among Korean patients. We identified the optimal BMI cutoff that effectively discriminates survival and tested the clinical significance of this index.
Materials and Methods
1. Patients
Patients who underwent curative resection of stage I–III CRCs at Gangnam Severance Hospital, Yonsei University College of Medicine between June, 2004 and February 2014 were enrolled in this study. Patients who had unusual histopathological types (neuroendocrine or gastrointestinal stromal tumor), tumors in certain locations (appendix or anus), hereditary colon cancer, Crohn’s disease, or primary cancer in multiple sites were excluded. Patients who received preoperative chemotherapy, chemoradiotherapy, or an emergency operation were also excluded. We acquired a total of 1,182 patients for our study (S1 Fig.).
2. Follow-up and outcomes included
Preoperative staging included a physical examination, plain radiology, colonoscopy, computed tomography (CT), magnetic resonance imaging (MRI), and positron emission tomography (PET), as appropriate. All resections were performed according to a standardized technique, and were either total mesorectal excisions or complete mesocolic excisions. Curative resection was defined as the absence of any gross residual tumor and a surgical resection margin that was pathologically negative for tumor invasion. Postoperative chemotherapy was mainly recommended for high-risk patients with stage II and stage III CRC.
Patients were followed up, using our standard protocol, every 3–6 months for at least 5 years. This protocol included tumor marker tests, CT, and chest radiography. Bone scans were performed when bone metastasis was indicated. Colonoscopy, pelvic MRI, and PET scan were selectively carried out at the physician’s discretion.
Data collected from inpatient and outpatient records included demographic data (age, sex, height, weight), tumor-specific data (pathological data) including T classification, lymph node metastasis, differentiation, lymphovascular invasion (LVI), tumor marker data including carcinoembryonic antigen (CEA) levels at diagnosis, recurrence, and survival outcomes.
3. Definition of BMI category
BMI was calculated by dividing the patient’s weight in kilograms by the patient’s height in meters squared. The height and weight data used to calculate BMI were measured at the time of surgery. Patients were grouped into four BMI categories according to the WHO definition of Asian-specific values [15]: underweight, < 18.5 kg/m2; normal, 18.5–22.9 kg/m2; overweight, 23–24.9 kg/m2; and obese, ≥ 25 kg/m2.
4. Statistical analysis
Categorical variables and continuous variables were analyzed by the chi-square test and analysis of variance (ANOVA) test, respectively. OS was defined as time from date of surgery to date of death from any cause or date of last follow up. RFS was defined from the date of surgery to the date of detection of recurrence or last follow-up or death. Comparison of OS or RFS across BMI categories was performed using Kaplan-Meier curves and the log-rank test. Crude and adjusted hazard ratios (HRs) and corresponding 95% confidence interval (CI) were computed using Cox-proportional hazards modeling. Variables that had significance of p < 0.05 on univariable analysis were eligible for inclusion in multivariable analysis. Factors associated with OS or RFS were analyzed by a backward stepwise selection of variables in the multivariable analysis.
We visualized the change of hazard rate of OS according to BMI using restricted cubic splines. We used model parsimony and the Akaike information criterion for choosing the optimal number of knots in the model.
Next, the X-tile program [19] was used to determine the optimal cutoff value of BMI that effectively discriminates OS and RFS. For the validation of our newly developed BMI cutoff value, we divided our study population (n=1,182) into two groups, training set (n=827) and test set (n=355) by random sampling. We tried to define new cutoff value using the training set and validated the newly defined value in the test set, Also, in the training set, we have tested if a three-tiered cutoff value would be useful in prediction of OS.
The discriminatory accuracy was compared between stage plus BMI cutoff value and stage only in the test set, by calculating the integrated area under the curve (iAUC) and Harrell’s concordance index (C-index). The iAUC determines the relevance of a certain biomarker in the disease status, as it takes both the changing levels of the biomarker and disease status throughout time into account. It is derived by integrating the time-dependent receiver operating characteristic curve of the selected biomarker over time. The C-index estimates the discriminating ability of the survival-predicting model. A C-index close to 1 denotes that the model accurately predicts one’s survival [20]. We calculated the C-index by a bootstrapping method.
All statistical analyses were performed using R ver. 3.6.3 (R-project, Institute for Statistics and Mathematics, Vienna, Austria). A two-sided p < 0.05 was considered statistically significant.
Results
Of the 1,182 patients, 476 (40.3%) were female and 706 (59.7%) were male. The majority of the patients were 60 or more years old (n=744, 62.9%). The median follow-up period was 95 months (interquartile range, 75 to 127 months). A total of 277 patients (23.4%) died and 144 patients (12.2%) showed recurrence during the study period.
1. Patient characteristics
Patients were categorized as underweight (n=61, 5.2%), normal (n=450, 38.1%), overweight (n=317, 26.8%) and obese (n=354, 29.9%) according to the WHO definition of Asian-specific BMI values. Differences in BMI categories were observed for hypertension history rate (p < 0.001), tumor size (p=0.007), histologic grade (p=0.021), presence of LVI (p=0.043), and more than 12 total retrieved lymph nodes (p=0.017). The groups were balanced with respect to sex, age, diabetes mellitus (DM) history, preoperative CEA, tumor location, tumor stage, complications, and receipt of chemotherapy (Table 1).
2. Kaplan-Meier survival curve according to BMI categories
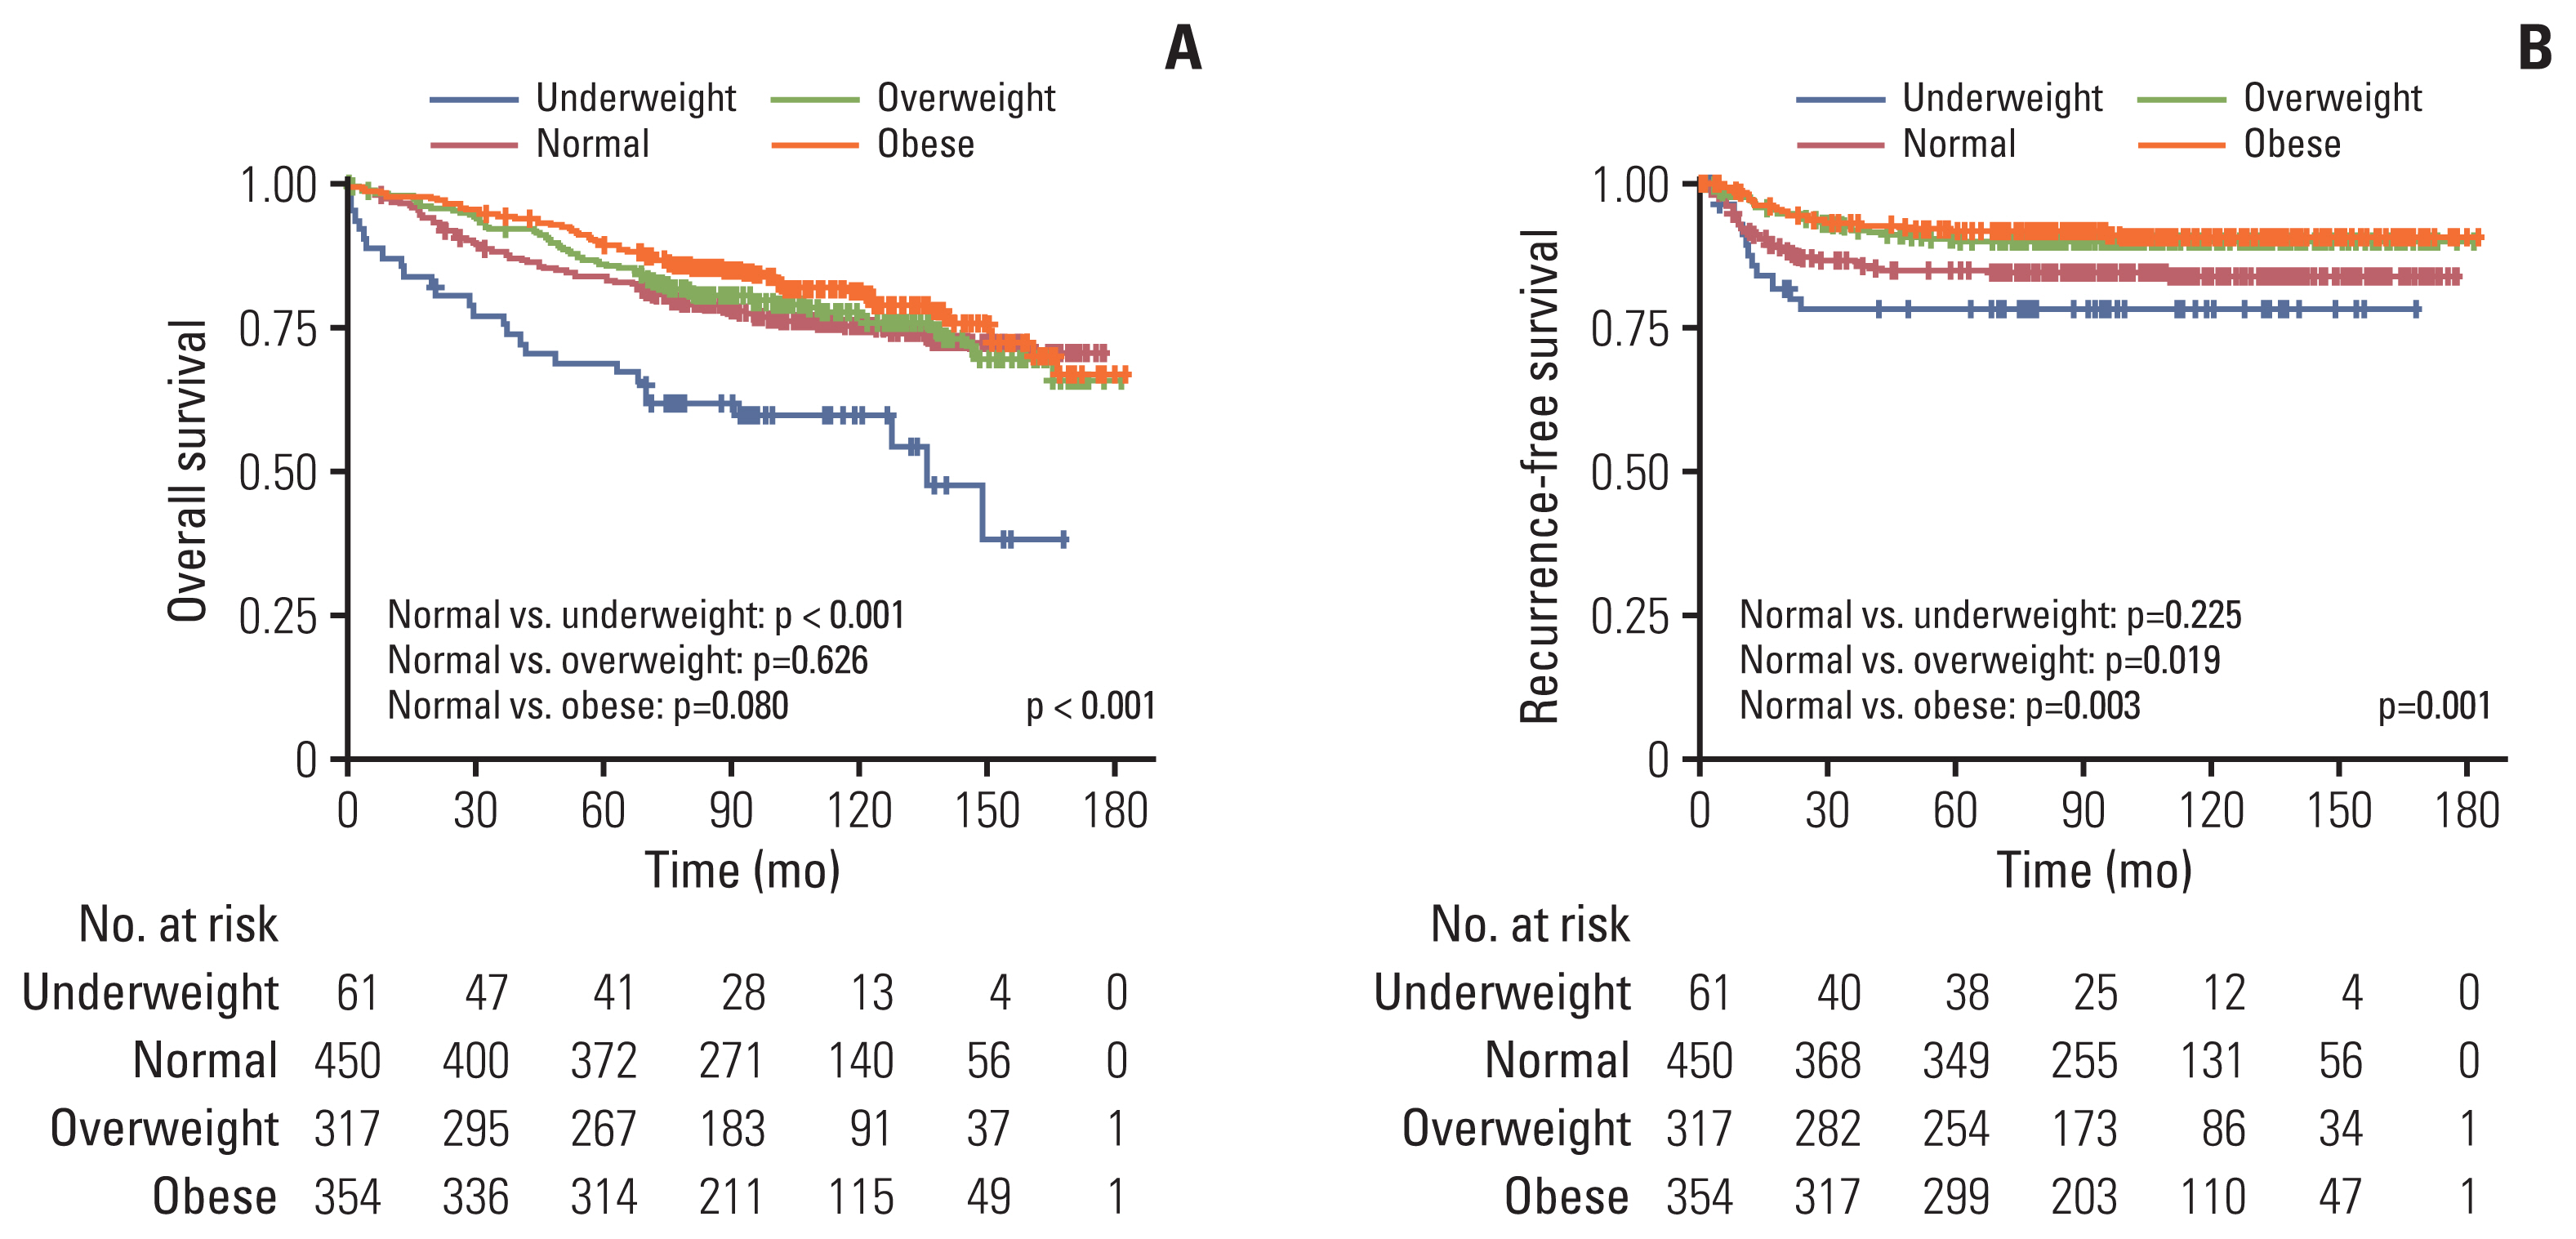
The Kaplan-Meier curve for OS showed a significant difference in survival according to BMI category (5-year OS: underweight, 68.5%; normal, 83.5%; overweight, 85.6%; and obese, 89.8%; normal vs. underweight, p < 0.001; normal vs. overweight, p=0.626; normal vs. obese, p=0.080) (Fig. 1A). The Kaplan-Meier curve for RFS showed a significant difference for recurrence according to BMI category (5-year RFS: underweight, 78.8%; normal, 84.4%; overweight, 89.7%; and obese, 91.6%; normal vs. underweight, p=0.225; normal vs. overweight, p=0.019; normal vs. obese, p=0.003) (Fig. 1B).
3. Factors associated with OS
Table 2 shows the results of the univariable and multivariable Cox regression analyses for OS. In the univariable analysis, sex, age, DM, BMI, hypertension, CEA, tumor size, postoperative complications, LVI, retrieved lymph nodes, and stage were significantly associated with OS. Multivariable analysis showed that older age, underweight and obese status, high CEA, large tumor size, postoperative complications, less retrieved lymph nodes, and advanced stage were independently related with poorer survival. In particular, apart from well-known variables that determine survival such as CEA, tumor size, and stage in patients with CRC, being underweight affected survival with an HR of 2.27 (95% CI, 1.49 to 3.46). In contrast, obesity had a protective effect on survival, with an HR of 0.72 (95% CI, 0.35 to 0.97).
4. Factors associated with recurrence-free survival
Factors significantly associated with RFS were BMI (overweight and obesity), high CEA, postoperative complications, histologic grade, LVI, stage, and receipt of chemotherapy. Multivariable analysis showed that high CEA, LVI, and advanced stage increased the HR of cancer recurrence. Conversely, having overweight and obesity had a protective effect against recurrence, in comparison with the normal BMI group (overweight: HR, 0.64; 95% CI, 0.42 to 0.99, p=0.046; obese: HR, 0.58; 95% CI, 0.38 to 0.89; p=0.014). Being underweight was not associated with RFS (HR, 1.38; 95% CI, 0.74 to 2.55), in contrast to OS (Table 3).
5. Prognostic effects of BMI on mortality
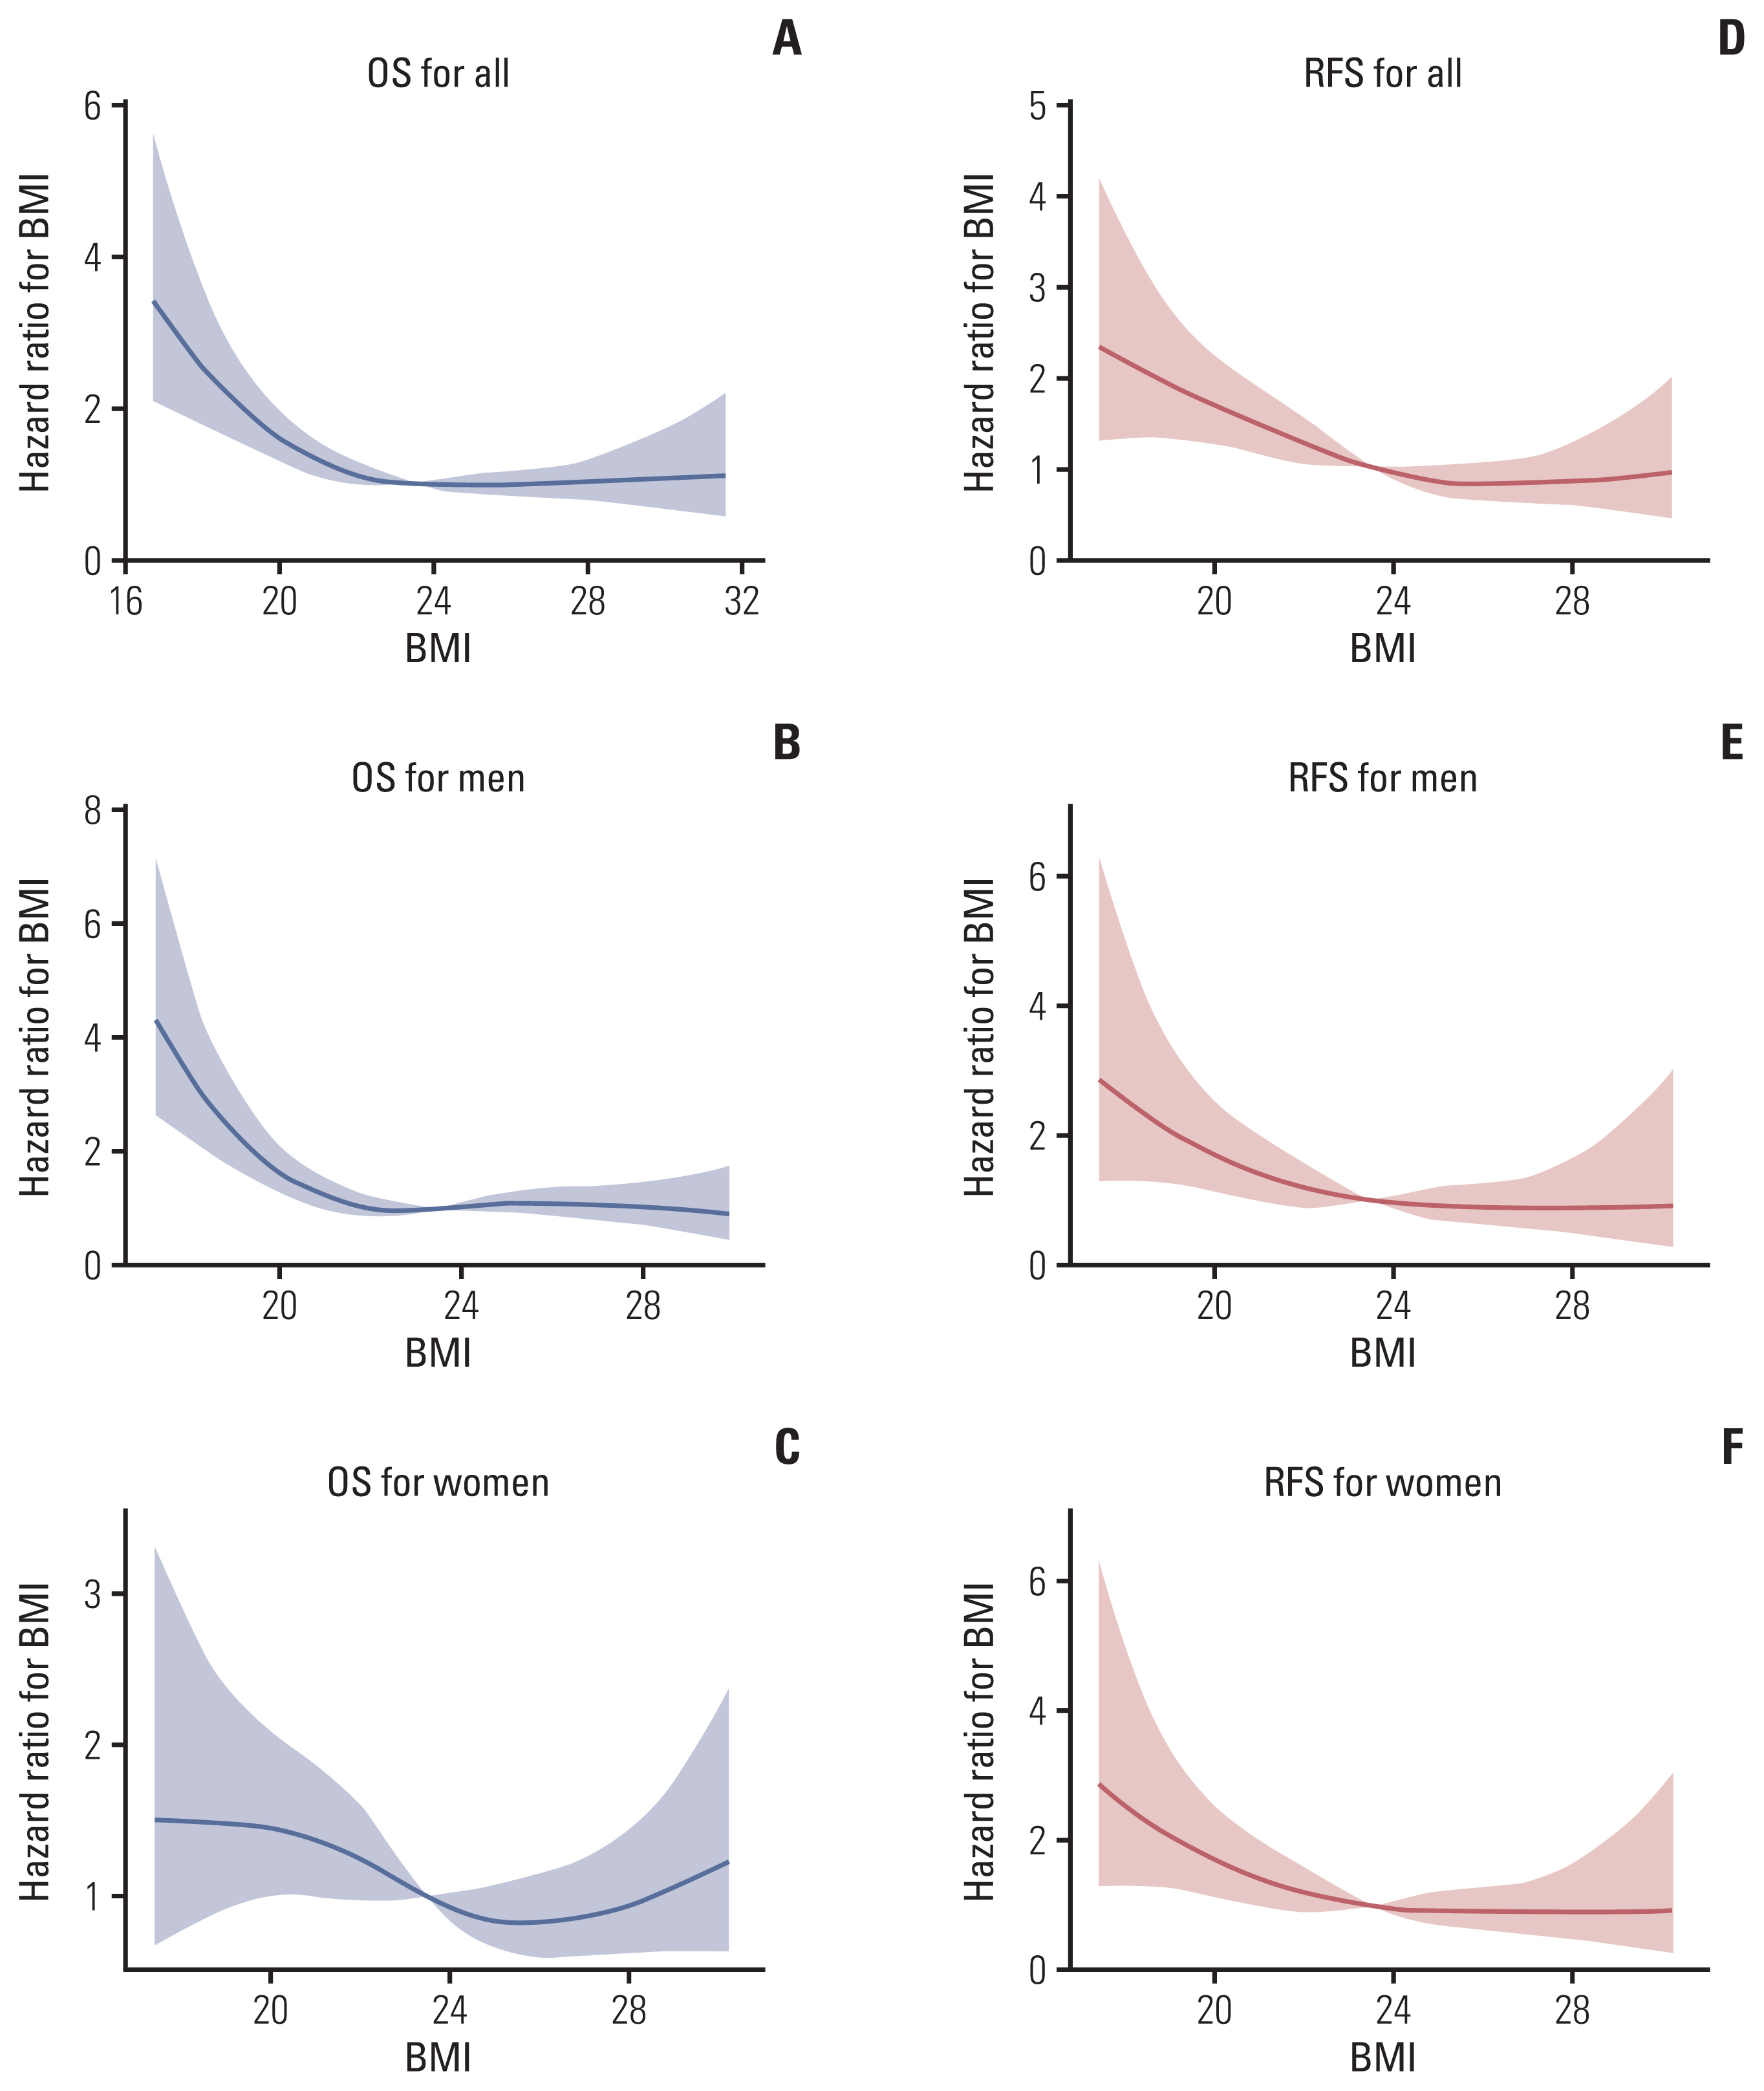
Restricted cubic splines were plotted to visualize the effect of BMI on OS and RFS. BMI was prognostic of OS and RFS in a reverse J-shaped curve, as shown in Fig. 2. Regarding OS, risks were higher in people with underweight, and female patients with overweight experienced a longer lifespan unlike male patients. Comparison of RFS according to BMI showed that underweight was associated with more recurrence, while overweight or obesity was not.
6. BMI cutoff for the prediction of OS
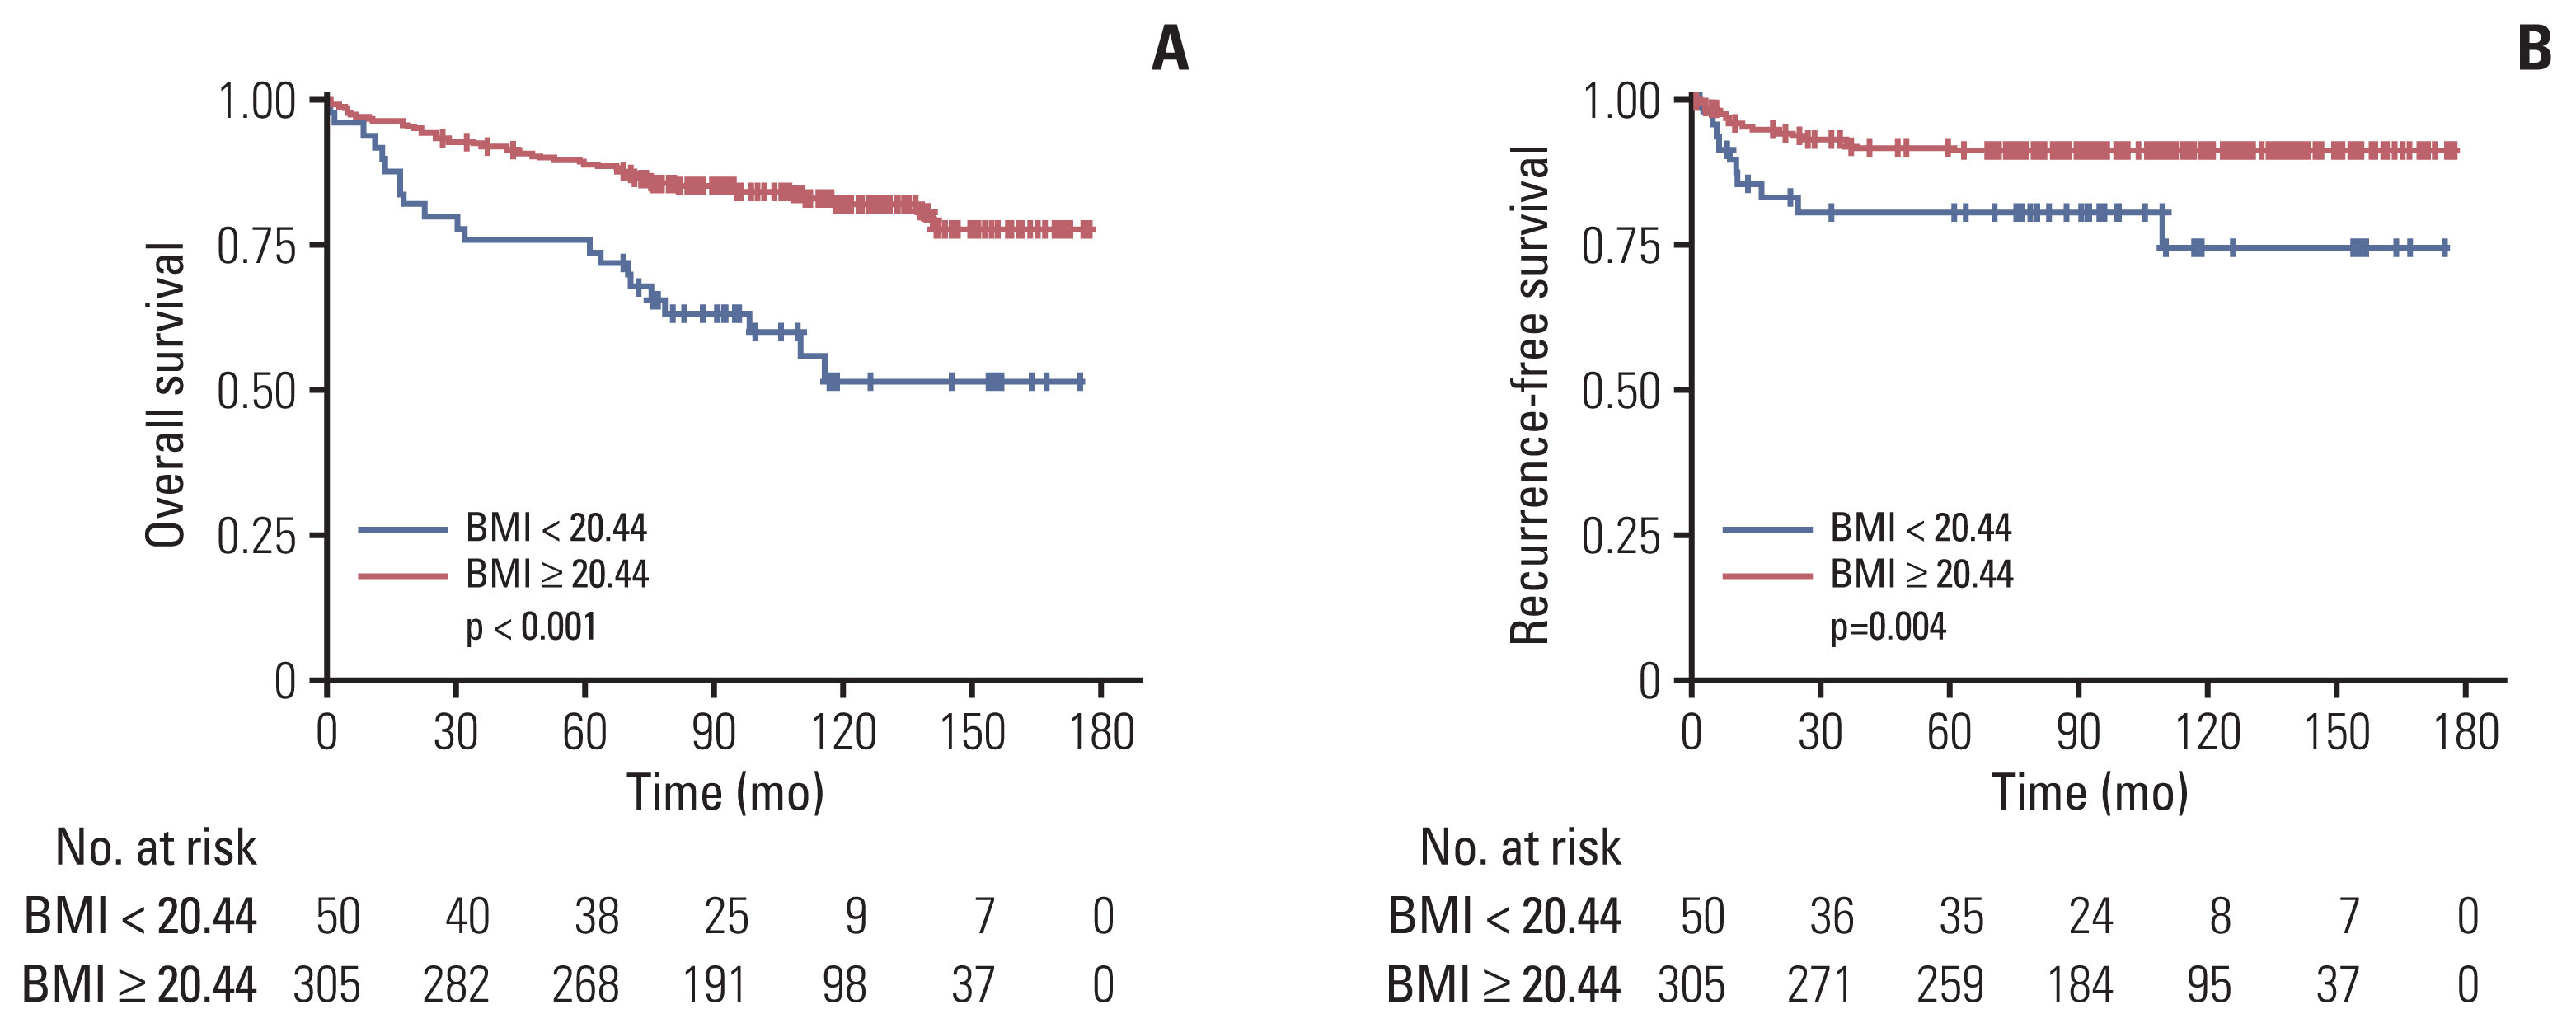
In the training set (n=827), using the X-tile program, we found that 20.44 is the optimal BMI cutoff value that effectively discriminates OS (S2 Fig.). In the test set (n=355), Kaplan-Meier curves representing OS and RFS were drawn after stratification by this cutoff value. OS was significantly higher in the BMI ≥ 20.44 group than that in the BMI < 20.44 group (5-year OS: BMI ≥ 20.44, 89.1% vs. BMI < 20.44, 76.0%; p < 0.001). RFS was significantly higher in the BMI ≥ 20.44 group than that in the BMI < 20.44 group (5-year RFS: BMI ≥ 20.44, 91.9% vs. BMI < 20.44, 81.1%; p=0.004) (Fig. 3). We also found that the optimal cutoff of BMI according to the RFS was 20.71 kg/m2 (S3 Fig.), which is similar to the cutoff defined by OS.
We tried to define three-tier classification in the training set using X-tile program. The suggested cutoff values of three tier classification were 20.44 kg/m2 and 24.73 kg/m2. The BMI < 20.44 group showed the worst prognosis compared to the other two groups, which is in line with the result shown in the two-tiered approach. Nevertheless, it seems that survival outcome is similar between the two groups with higher BMI (S4 Fig.). Thus, we believe that three-tier classification has no additive clinical significance compared to the two-stage classification.
7. Clinical utility of adding BMI cutoff value to stage based on the iAUC and C-index comparison
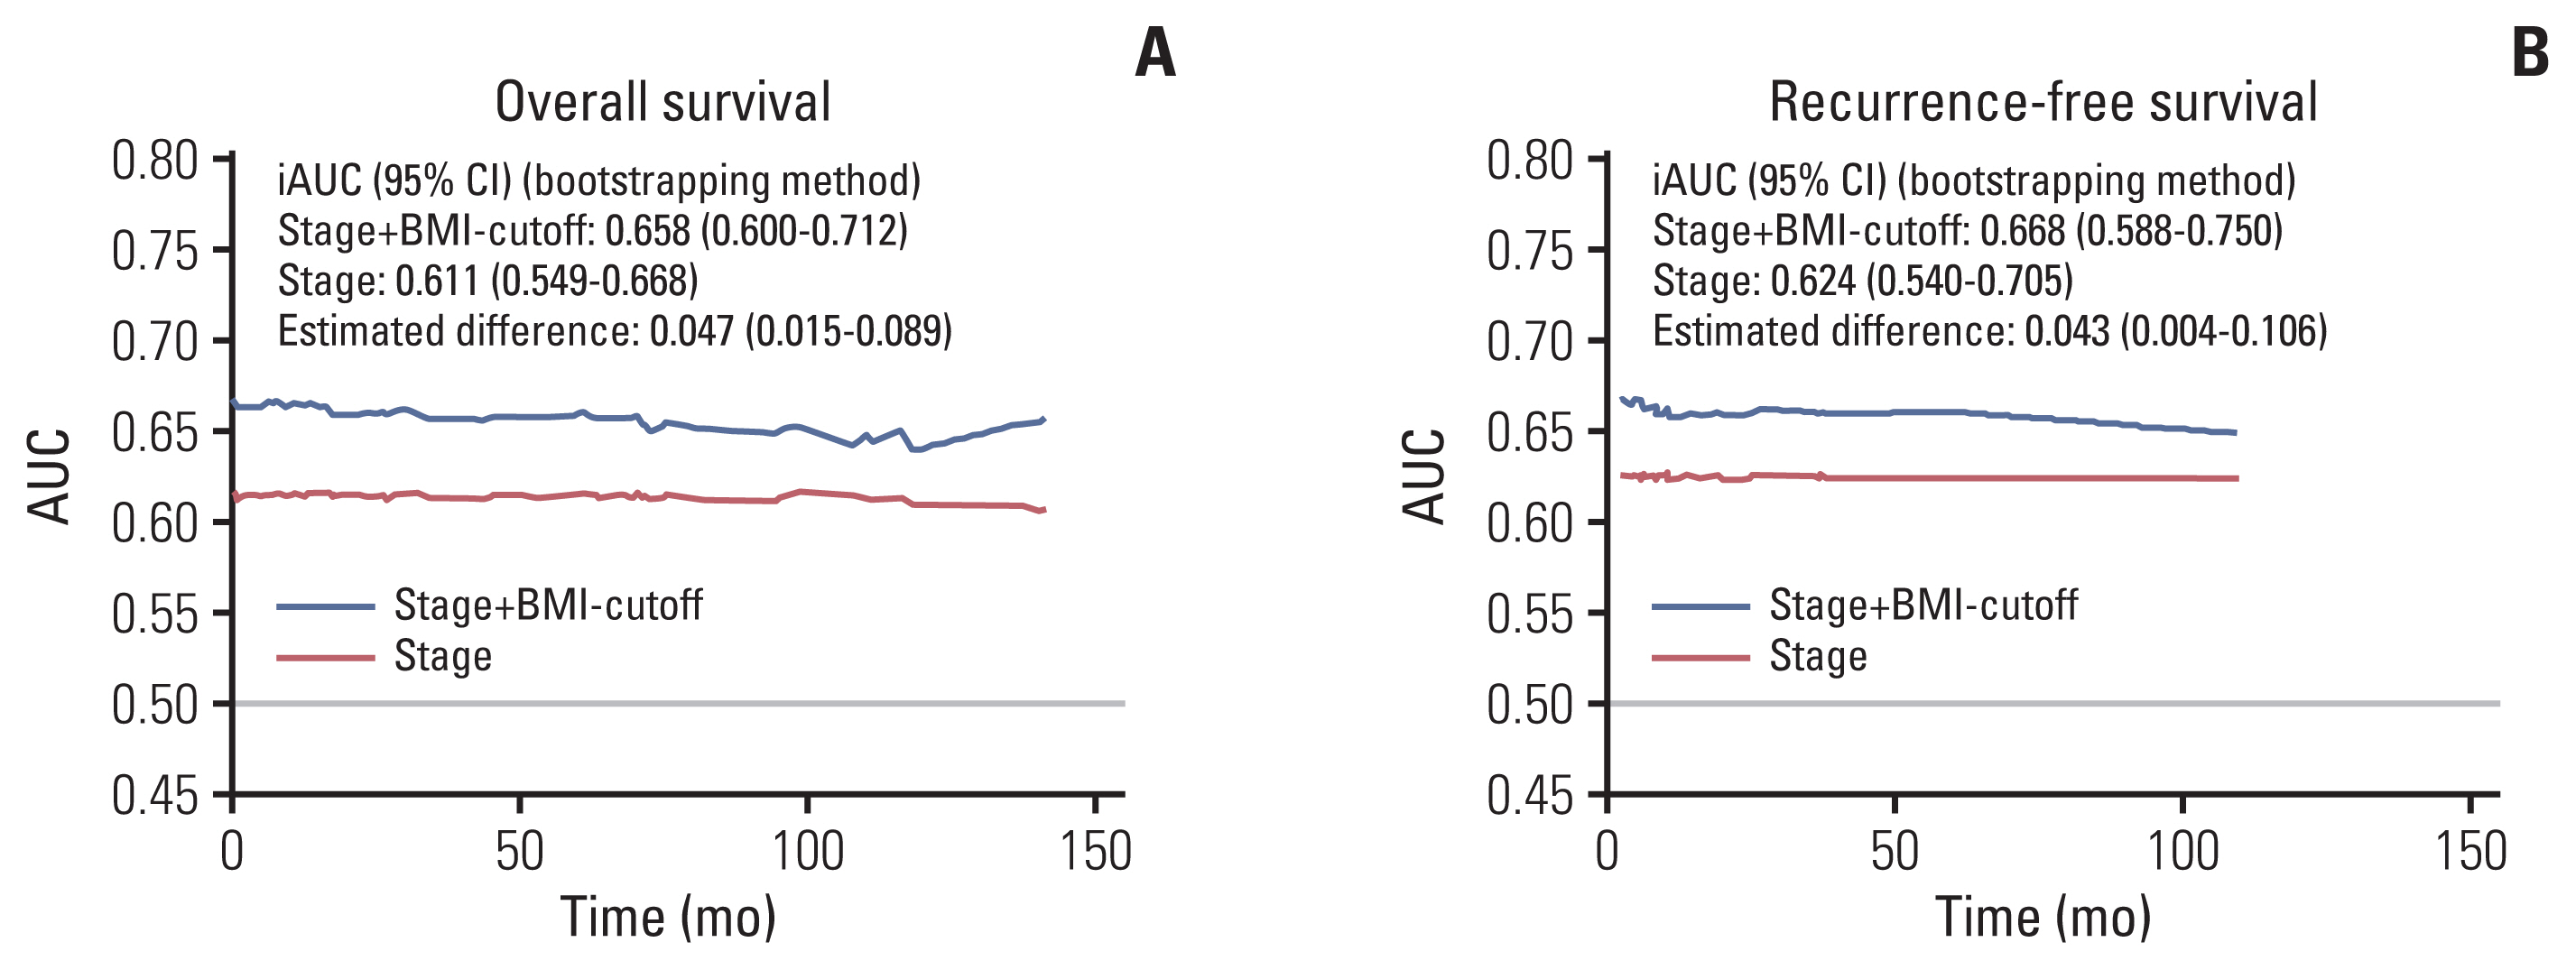
We evaluated the clinical implication of the newly developed BMI cutoff value (20.44) in the test set. The iAUC value of stage plus BMI cutoff for OS (0.658; 95% CI, 0.600 to 0.712) was superior to that of stage (0.611; 95% CI, 0.549 to 0.668; bootstrap iAUC mean difference, 0.047; 95% CI, 0.015 to 0.089) throughout the observation period. The iAUC value of stage plus BMI cutoff value for RFS (0.668; 95% CI, 0.588 to 0.750) was superior to that of stage (0.624; 95% CI, 0.540 to 0.705; bootstrap iAUC mean difference, 0.043; 95% CI, 0.004 to 0.106) throughout the observation period (Fig. 4).
The C-index of stage plus BMI cutoff value showed superior discriminatory power compared with stage alone for OS (0.680 vs. 0.636; estimated difference, 0.044) and RFS (0.675 vs. 0.634; estimated difference, 0.041), respectively (Table 4).
Discussion
This study demonstrated that BMI, stratified by Asian-specific categories, is an independent prognostic factor for OS and RFS respectively, after adjusting for possible confounders. Being underweight was associated with shorter survival, whereas overweight or obesity was related with longer survival compared with normal BMI. A BMI cutoff value of 20.44 kg/m2 was set as an effective criterion for dichotomization, which maximizes the capability of predicting OS. Combining this BMI cutoff value with stage showed clinically added value for discriminating prognosis compared with stage alone, as assessed by comparing the iAUC and C-index.
The association between underweight BMI and poor survival is coherently observed in patients with CRC [4,7,8, 10,18,21,22]. However, one study showed that underweight BMI showed no significant difference in OS compared to normal BMI in patients with stage III CRC (HR, 1.29; 95% CI, 0.77 to 2.19) [5], although the exact reason of this discordance was unclear. Some speculate that being underweight reflects a more advanced disease status and this may be translated into worse outcomes [8,23]. In our study, the rate of stage III also tended to be higher in patients with underweight BMI, although this did not reach statistical significance. In addition, common sarcopenic status in patients with underweight BMI may account for considerable association with poor oncologic outcomes [24,25]. Various inflammatory substances such as tumor necrosis factor α (TNF-α), interleukin (IL)-1α, and IL-6 are prevalent in patients with cachexia, and TNF-α can stimulate tumor formation by inducing insulin resistance [14,24]. Nutrients from gluconeogenesis or amino acids produced by muscle wasting are increased in patients with cancer cachexia, and this may cause tumors to grow. This suggests malnourishment and cachexia with a lack of physiological reserves, which were more common in patients with under-weight BMI, seem to play a role. Our data revealed that underweight BMI was associated with poor OS compared with patients with normal BMI, whereas there was no significant difference in RFS. Therefore, the underlying cause of poor prognosis in underweight patient needs clarification.
Whether overweight is associated with better survival remains a debatable topic and studies regarding patients with CRC have offered conflicting insights: some report being overweight has a protective effect [7,10,12], some report a hazardous effect [21], and some failed to find an association at all [5,6]. In terms of obesity and survival, the better survival outcome in patients with overweight is known as the ‘obesity paradox.’ This relation is observed in many cancer types, including colorectal, renal, hematologic, and metastatic malignancies [26]. There are possible explanations for this phenomenon. Higher BMI reflecting a higher reserve of protein and energy for healing and receiving chemotherapy may be the underlying biological mechanism [3,27]. Methodological errors such as selection bias, reverse causality, and collider bias are also assumed to be the cause [26,28], although a study designed to minimize the biases found that the paradox is conserved even after correction [10]. Ujvari et al. [29] suggested that the immune system, which fights indolent types of precancerous colonies before they differentiate into cancer works more favorable in normal-weight people than obese people. Therefore, the proportion—not the absolute number—of aggressive cancers may be lower in cancer patients with obesity than normal weight, leading to a seemingly better survival in the former [29]. Although this is an interesting explanation, further clinical and experimental data supporting this hypothesis are needed.
We found that obesity was associated with better OS, and overweight and obesity had a protective effect against cancer recurrence. Our finding supports the existence of the obesity paradox regarding OS and RFS, even in Asian patients with CRC. Nonetheless, a large body of literature demonstrates that patients with overweight and obesity have higher rates of CRC recurrence [2,6,30]. A brief review of current literature regarding the association between BMI and CRC is shown in Table 5.
Our study was unable to explain why the association of obesity with survival differs between studies, although the explanation is likely multifactorial. The different effect of fat distribution and their adverse effects among races may be the main reason [15,17].
Because BMI is closely related to survival outcomes, we evaluated the clinical utility of BMI on predicting prognosis in patients with non-metastatic CRC. A cutoff value of 20.44 kg/m2 was proven to be an effective criterion for this purpose. Furthermore, aside from cancer stage, which is the current standard for predicting prognosis, we showed that BMI is also a useful and convenient prognosticator when combined with cancer stage. Its added value was assessed using iAUC and C-index. This cutoff value is similar to that of 20.2 kg/m2 used by a study based on a huge Korean population [18]. A Japanese study also showed that BMI 20 kg/m2 is a significant dichotomization value for predicting OS and RFS [4]. In this study, it was confirmed once again that a BMI reference value similar to the reference value proposed in two previous Asian studies could accurately predict a patient’s prognosis. In particular, it was confirmed that when the patient’s prognosis was predicted using the combination of BMI cutoff and staging, the prognosis could be predicted more accurately than through the cancer staging. This could confirm in more detail that BMI can be helpful in predicting the prognosis of patients. However, the clinical usefulness of this cutoff has mainly been validated in Asian patients with CRC. Considering that poor prognosis has also been reported in underweight BMI in most of the previous studies, its clinical effect needs to be assessed in western patients with CRC.
Our study had some limitations. Only BMI was used for classification of obesity, and this index does not reflect the visceral or subcutaneous distribution of fat. The relatively small subgroup sizes, especially for underweight BMI, could have possibly reduced the validity our results. Socioeconomic data, menopausal status, and diet were also not considered. Most of all, our mean BMI was around 23 kg/m2 and only approximately 2.2% of patients had a BMI of more than 30 kg/m2. The small sample size of this group did not allow for the analysis of BMI categorization of class I–III obesity. This difference of BMI distribution makes it difficult for our results to be generalized. Nevertheless, our study boasts outstanding strengths. The main forte of this study is that we quantitively assessed the significance of BMI cutoff value when incorporated into clinical decision-making. Other strengths include a long follow-up period, visualization using restricted cubic splines, and a large sized cohort of the Asian population.
In conclusion, BMI was prognostic of OS and RFS for patients with stage I–III CRC. The results support the existence of the obesity paradox. The strength of this relationship varies by patient sex. We determined a BMI cutoff value of 20.44 kg/m2 for discriminating the prognosis of patients with CRC, and the clinical effectiveness of the index was demonstrated. BMI could be used to improve prognostic discrimination and should be integrated into clinical decision-making.