Introduction
Colorectal cancer (CRC) is the third leading cause of cancer death, and more than 1.2 million new CRC patients are diagnosed each year worldwide [1]. Although great progress has been made in research on the pathogenesis, diagnosis, and treatment of CRC in the past few decades, it is still largely unknown in these fields [1,2]. In-depth research is still required to identify more molecules that might serve as candidates for targeted therapy of CRC. One logical target is the ubiquitin-proteasome system, which accounts for the degradation of approximately 80%–90% of all intracellular proteins and thereby regulates protein homeostasis [3,4].
The ubiquitination of tumor suppressors (e.g., p53 and phosphatase and tensin homolog) and of oncogenes (e.g., mammalian target of rapamycin, the AKT serine/threonine protein kinase, and c-Myc) regulates different biological processes, such as the tumor microenvironment, metastasis, and cancer stem cell stemness [5–7]. Protein ubiquitination is mediated by three classes of enzymes: the ubiquitin-activating (E1), ubiquitin-conjugating (E2), and ubiquitin-ligating (E3) enzymes [8]. Human genomes harbor two E1 ligases, nearly 30 E2 ligases, and approximately 600 E3 ligases [8]. The E3 ligases are mainly classified into four groups: homologous to the E6-AP carboxyl terminus, RING-finger, U-box, and plant homeodomain-finger proteins [9]. The RING-finger E3 ligases represent the largest subfamily and comprise two subclasses: anaphase-promoting complex and cullin-RING ubiquitin ligases (CRLs) [10].
One common feature of the CRLs is that they contain a cullin protein. The mammalian genomes consist of eight cullins: CUL1, CUL2, CUL3, CUL4A/4B, CUL5, CUL7, and CUL9 [9]. The CRLs are viewed as capable of ubiquitinating and degrading approximately 20% of all intracellular proteins. Dysfunctions of CRLs can disrupt intracellular protein homeostasis and cause different diseases, such as cancer, diabetes, cardiovascular diseases, and stroke [11]. Numerous studies have revealed that CUL1 and CUL4A/4B function in tumorigenesis by assembling into different CRLs and degrading different substrates [9]. CUL1 normally recruits the adaptor protein S-phase kinase associated protein 1 (SKP1), the RING-box protein 1 (RBX1), and different F-box proteins to assemble the SKP1-cullin-1-F-box-protein (SCF) E3 ligases [9]. CUL4A/4B couple with RBX1, the adaptor protein DNA damage binding protein 1 (DDB1), and different DDB1 and CUL4-associated factors (DCAFs) to assemble the CRL4 E3 ligases [9]. Recently, Liu et al. demonstrated that CUL4A and 4B function redundantly and that they assemble into the CRL4A/4BDCAF4 E3 ligases to ubiquitinate and degrade suppression of tumorigenicity 7 (ST7), leading to tumorigenesis [12]. However, the involvement of SCF E3 ligases in the tumorigenesis of CRC remains to be established.
Menin 1 (MEN1) is a tumor suppressor that can function in multiple biological processes, such as cell proliferation, migration, and DNA damage repair [13,14]. MEN1 contains four functional domains: an N-terminal domain, thumb domain, palm domain, and C-terminus domain (CTD) [13,14]. The CTD domain determines the nuclear localization of MEN1 because it contains three nuclear localization sequences, while the other three domains interact with different proteins [13,14]. MEN1 alterations and mutations are found in a variety of cancer types, such as pancreatic endocrine tumors, pituitary adenomas, and adrenal cortical tumor [15]. However, no role has been identified for MEN1 in CRC tumorigenesis.
In the present study, we investigated whether the SCF E3 ligases function in the process of CRC tumorigenesis by collecting malignant tumor tissues from CRC patients. We identified that hypoxia induced the expression of CUL1. We then performed an immunoprecipitation (IP) assay using an anti-CUL1 antibody and found that CUL1 could pull down SKP1, RBX1, and F-box/LRR-repeat protein 1 (FBXL1). We then verified the assembly of the SCFFBXL1 E3 ligase and confirmed that it could ubiquitinate and degrade MEN1. We also found that disruption of the SCFFBXL1 E3 ligase inhibited CRC cell growth in vitro and tumor growth in vivo. Our results reveal a new mechanism involving the SCFFBXL1 E3 ligase for CRC tumorigenesis and suggest that targeting the SCFFBXL1 complex may represent a promising therapeutic strategy for CRC treatment.
Materials and Methods
1. Cell culture
The normal human colon cell line CCD-18Co and six human cancerous colon cell lines (HCT-15, HT29, HCT-116, SW116, SW480, and LS180) were obtained from the American Type Culture Collection (ATCC, Manassas, VA). All cells were grown in Dulbecco’s modified Eagle’s medium (DMEM; #D5796, Sigma-Aldrich, Shanghai, China) containing 10% fetal bovine serum (FBS; #F4135, Sigma-Aldrich) and 100 U/mL penicillin-streptomycin antibiotic (#P4333, Sigma-Aldrich). Cells were incubated at 37°C with 5% CO2, and the culture medium was changed every 3 days.
2. Vector construction and plasmid purification
The full length of the coding sequences of the HIF1A, FBXL1, and MEN1 genes were amplified and cloned into the empty pCDNA3-2×Flag vector using the EcoRI and XhoI sites. The full-length coding sequences of the SKP1, CUL1, and MEN1 genes were amplified and cloned into the empty pCDNA3-6×Myc vector using EcoRI and XhoI sites. All primers used in the vector construction are listed in S1 Table. The generated vectors were sequenced to verify their correct expression. The plasmids were purified using the GenElute Plasmid Midiprep Kit (#PLD35-1KT, Sigma-Aldrich), according to the manufacturer’s protocol.
3. Cell transfection
For plasmid transfection, 1 μg of each plasmid vector was transfected into cells at 60% confluence using Lipofectamine 2000 (#11668027, Thermo Fisher, Shanghai, China), following the manufacturer’s protocol. Cells were incubated for another 48 hours and then collected and used for RNA and protein extraction. For short hairpin RNA (shRNA) transfection, two independent MISSION shRNA lentiviral transduction particles for each gene (S2 Table) were transfected into 60% confluent cells using the FuGene 6 reagent (#E2691, Roche, Shanghai, China). The cells were selected by culturing in DMEM containing 10% FBS and 1 μg/mL puromycin (#P8833, Sigma-Aldrich) for four days. Single puromycin-resistant cells were collected, expanded, and subjected to the required experiments after verifying the successful knockdown of the target genes.
4. Collection of biopsies
Cancerous colon tissues and their adjacent noncancerous counterparts were collected from 20 patients with CRC who were at TNM stage III and had undergone surgery in the Department of Oncology, Jiangxi Provincial People’s Hospital Affiliated to Nanchang University. The basic information about these patients is summarized in S3 Table. The collected tissues were divided into three parts and used for RNA and protein characterization and immunohistochemistry (IHC) analyses.
5. Western blotting analysis
Western blotting analysis was performed as described previously [16]. Briefly, total proteins were extracted from biopsies and cultured cells using ice-cold radioimmunoprecipitation assay (RIPA) buffer (#89900, Thermo Fisher) containing 1× protease inhibitor (#87785, Thermo Fisher). Equal amounts of total proteins were separated by sodium dodecyl sulfate polyacrylamide gel electrophoresis (SDS-PAGE) gels and transferred onto polyvinylidene difluoride membranes (#IPSN07852, Sigma-Aldrich). The membranes were blocked with 5% fat-free milk, followed by probing with the following primary antibodies: anti-CUL1 (#ab75817, Abcam, Shanghai, China), anti-CUL2 (#ab166917, Abcam), anti-CUL3 (#ab108407, Abcam), anti-CUL4A (#ab92554, Abcam), anti-CUL4B (#ab67035, Abcam), anti-CUL5 (#ab184177, Abcam), anti-CUL7 (#C1743, Sigma-Aldrich), anti-CUL9 (#HPA052-004, Sigma-Aldrich), anti-SKP1 (#ab76502, Abcam), anti-RBX1 (#ab133565, Abcam), anti-FBXL1 (SAB1100391, Sigma-Aldrich), anti–hypoxia-inducible factor 1α (HIF1α) (#ab2185, Abcam), anti-MEN1 (#ABC514, Sigma-Aldrich), anti-Myc (#ab32, Abcam), anti-HA (#H3663, Sigma-Aldrich), anti-Flag (#F3165, Sigma-Aldrich), and anti-GAPDH (#ab8245, Abcam). After rinsing five times with PBST buffer, the membranes were probed with secondary antibodies. Finally, protein bands were visualized using the Pierce ECL kit (#32106, Thermo Fisher Scientific).
6. RNA isolation and quantitative reverse-transcription polymerase chain reaction
Total RNA was isolated from tissues and cultured cells using the TRIzol Reagent (#T9424, Sigma-Aldrich) according to the manufacturer’s protocol. The same concentrations of RNA (1 μg) in each sample were transcribed into cDNA using the PrimeScript 1st strand cDNA Synthesis Kit (6110A, Takara, Beijing, China). The gene expression levels were determined by quantitative reverse-transcription polymerase chain reaction (RT-qPCR) using the TB Green Advantage qPCR Premix (#639676, Takara). Each gene and each sample were run in triplicate. All primers are listed in S4 Table. The relative mRNA level of each gene in each sample was normalized to its corresponding β-actin according to the 2−ΔΔCt method.
7. IP, mass spectrometry, and co-IP analyses
The IP, mass spectrometry (MS), and co-IP assays were performed as described previously [16]. Briefly, tissues and cultured cells were lysed in ice-cold RIPA buffer containing 1× protease inhibitor. Total cell lysates were centrifuged at 13,000 rpm for 15 minutes and the supernatants were immunoprecipitated with anti-CUL1-coupled, anti-FBXL1, or IgG-coupled protein A beads (10001D, Thermo Fisher). The enriched proteins were rinsed five times with RIPA buffer, followed by separation by SDS-PAGE, staining with the Pierce Silver Staining Kit (#24612, Thermo Fisher), digestion with a trypsin kit (#60109101, Thermo Fisher), and analysis by MS. For co-IP assays, cells co-expressing the Myc-tagged and Flag-tagged proteins were lysed in ice-cold RIPA buffer containing 1× protease inhibitor, followed by IP assays with anti-Flag agarose (A2220, Sigma-Aldrich). The enriched protein complexes were probed by anti-Flag and anti-Myc antibodies.
8. IHC assay
Three representative pairs of cancerous and their adjacent noncancerous colon tissues were used for IHC assays, as described previously [12]. The tissue slides were probed for 1 hour with anti-CUL1 (1:200 dilution), anti-CUL2 (1:100 dilution), anti-CUL4A (1:150 dilution), and anti-CUL4B (1:200 dilution). The slides were then incubated with biotin-labeled secondary antibodies, followed by staining with the Vectastain ABC kit (#32020, Thermo Fisher) and the DAB peroxidase substrate kit (#391A, Sigma-Aldrich). The slides were photographed using a Nikon fluorescence microscope (#16822, Nikon, Tokyo, Japan).
9. Cell proliferation and migration assays
Cell proliferation and invasion assays were performed as described previously [12]. For cell proliferation, approximately 1×10⁴ cells were seeded into 48-well plates, and cell viability was determined at 0, 1, 2, 3, 4, and 5 days using the MTT Kit (#ab211091, Abcam), following the manufacturer’s protocol. For the cell migration assay, approximately 500 cells were suspended in serum-free DMEM and then seeded into the upper inserts of Boyden chambers (ECM506, Sigma-Aldrich). The lower inserts were supplemented with DMEM containing 10% FBS. After culture at 37°C for 24 hours, the cells in the lower chambers were fixed with 4% paraformaldehyde (#158127, Sigma-Aldrich) and stained with 0.2% crystal violet (#C0775, Sigma-Aldrich).
10. In vivo ubiquitination assay
The in vivo ubiquitination assay was performed as described previously [12]. In brief, the pCDNA3-2×Flag-MEN1 and HA-ubiquitin plasmids were co-transfected into the following cells: Control-KD (knockdown; transfection with pLKO.1-puro empty vector), CUL1-KD1, and FBXL1-KD1 cells in the HT29 background. After 44 hours of transfection, the cells were treated with 10 μM MG132 (#M7449, Sigma-Aldrich) for another 4 hours. The cells were then washed with PBS and lysed in ice-cold RIPA buffer containing 1× protease inhibitor, followed by IP assays with anti-Flag agarose and western blotting assays with an anti-HA antibody.
11. Tumor xenograft model
Briefly, the Control-KD, HIF1A-KD1, CUL1-KD1, CUL4A/B-KD1, FBXL1-KD1, HIF1A-KD1+MEN1-KD1/2, CUL1-KD1+MEN1-KD1/2, or FBXL1-KD1+MEN1-KD1/2 HT29 cells were injected into 6-week-old female nude mice (Shanghai SLAC Laboratory Animal Co., Ltd., Shanghai, China). Tumor volumes were measured at 5-day intervals and calculated with the following formula: volume=(length×width2)/2. Four groups of mice (Control-KD, HIF1A-KD1, CUL1-KD1, and FBXL1-KD1) harboring tumors of similar volume (~150 mm3) were injected with PBS and capecitabine (CPT) at 5-day intervals, and tumor volumes were measured at the same time points. Mice were also injected with HT29 cells and the SCF inhibitors DT204 (10 or 20 mM) or SZLP1-41 (10 or 20 mM). Tumor volumes were measured at 5-day intervals. Three groups of mice (HT29, +10 mM DT204, and +10 mM SZLP1-41) harboring tumors of similar volume (~150 mm3) were injected with PBS and CPT at 5-day intervals, and the tumor volumes were measured at the same time points.
12. Chromatin immunoprecipitation assay
Cells (5×10⁷ for each cell line) were fixed for 12 minutes with 1% formaldehyde (#F79-1, Thermo Fisher Scientific). The reaction was terminated by the addition of 1 M glycine to reach a final concentration of 0.125 M. The cells were used for chromatin immunoprecipitation (ChIP) assays with a high-sensitivity kit (#ab185913, Abcam) and anti-HIF1α antibody (#ab2185, Abcam), according to the manufacturer’s protocol. The input and output DNA were used for RT-qPCR analyses with the TB Green Advantage qPCR Premix (#639676, Takara) using the following primers: for CUL1 promoter, forward: 5′-AGGGGAACTAATGGTTGGTGAA-3′; reverse: 5′-TTG-CTCTAGTAAGGTCAACTG-3′; for MEN1 promoter, forward: 5′-CAGCCTGACCAACATGGTGACA-3′; and reverse: 5′-CCAGGTTCAAGTGATTCTTCTGCC-3′. The relative enrichment of HIF1α and IgG in each sample was normalized to that in the Control-KD cells.
13. Statistical analysis
All experiments were performed independently at least three times. Results are shown as mean±standard error of the mean. Statistical analyses of the experimental data were performed using two-tailed Student t-tests. Significant differences were set as p < 0.05, p < 0.01, and p < 0.001.
Results
1. CUL1 was overexpressed in the CRC tumor tissues and cells
We investigated whether SCF E3 ligases are involved in the tumorigenesis of CRC by measuring the expression level of the CUL1 gene in 20 pairs of cancerous biopsies and their adjacent noncancerous counterpart tissues derived from patients with TNM III stage CRC. We also detected the expression of the other 7 cullin genes as controls. We found that only three genes (CUL1, 4A, and 4B) were dysregulated in CRC tumor tissues, whereas the other 5 cullin genes (CUL2, 3, 5, 7, and 9) were unchanged (Fig. 1A–C, S5A–S5E Fig.). The average mRNA levels of CUL1 and CUL4A/4B in cancerous tissues increased nearly 2.3-fold and 3.2-fold, respectively, compared to the controls (Fig. 1A–C).
We also determined the clinical significance of CUL1 and CUL4A/4B in CRC by collecting the dataset of CRC biopsies from The Cancer Genome Atlas. The Kaplan-Meier survival curves showed that patients harboring high CUL1 levels had a much worse overall survival rate than those harboring lower levels of CUL1 (Fig. 1D). Kaplan-Meier survival curves were also generated to determine the effects of CUL2 (used as a negative control) and CUL4A/4B. The results showed no significant difference between the groups with high and low CUL2 expression (Fig. 1E). We observed that the overall survival rate was more appreciably decreased in patients with high expression levels of CUL4A/4B than with low expression levels (Fig. 1F and G).
We also randomly selected three pairs of tumors and controls for IHC and immunoblot examinations of the protein levels of CUL1, CUL2, and CUL4A/4B. The protein expression of CUL1 and CUL4A/4B was increased in tumor tissues compared to controls (Fig. 1H and I, S5F Fig.), in agreement with their mRNA levels. We also measured the mRNA and protein levels of cullins in six colon cancer cell lines (HCT-15, HT29, HCT-116, SW116, SW480, and LS180). The RT-qPCR results for these cells showed increases in the mRNA levels only for CUL1 (range from 1.5- to 2.3-fold) and CUL4A/4B (range from 2.5- to 4.1-fold ) but not for the other cullin genes (S6A Fig.). Consistent with the immunoblot results in CRC tumors, we also observed increases in CUL1 and CUL4A/4B protein levels, but not CUL2 protein levels, in these colon cancer cell lines (S6B and S6C Fig.). These results suggested that CUL1 and CUL4A/4B were overexpressed in CRC tumor tissues and cell lines.
The results in Fig. 1 and S5 Fig. indicated a much higher expression of CUL4A/4B than of CUL1 in CRC tumors and cell lines. We examined whether CUL4A/4B might have a more significant role than CUL1 in CRC tumorigenesis by also generating the knockdown cell lines of CUL1 and CUL4A/4B in the HT29 background (S7A and S7B Fig.). In vitro cell proliferation assays and in vivo tumor xenograft assays showed that a deficiency of CUL1 or CUL4A/4B significantly inhibited tumor cell growth (S7C and S7D Fig.), but knockdown of CUL4A/4B caused a much more severe growth inhibition phenotype than was observed with CUL1 deficiency (S7C and S7D Fig.). These results, together with the results shown in Fig. 1D, F, and G, suggested that CUL4A/4B played a much more important role than CUL1 in CRC tumorigenesis. A previous publication has shown that CUL4A/4B assembles an E3 ligase with DDB1, RBX1, and DCAF4 to ubiquitinate ST7 in CRC cells [12]. We therefore focused further on investigating the roles of CUL1 and its associated SCF E3 ligase in CRC tumorigenesis.
2. Hypoxia induced the expression of CUL1
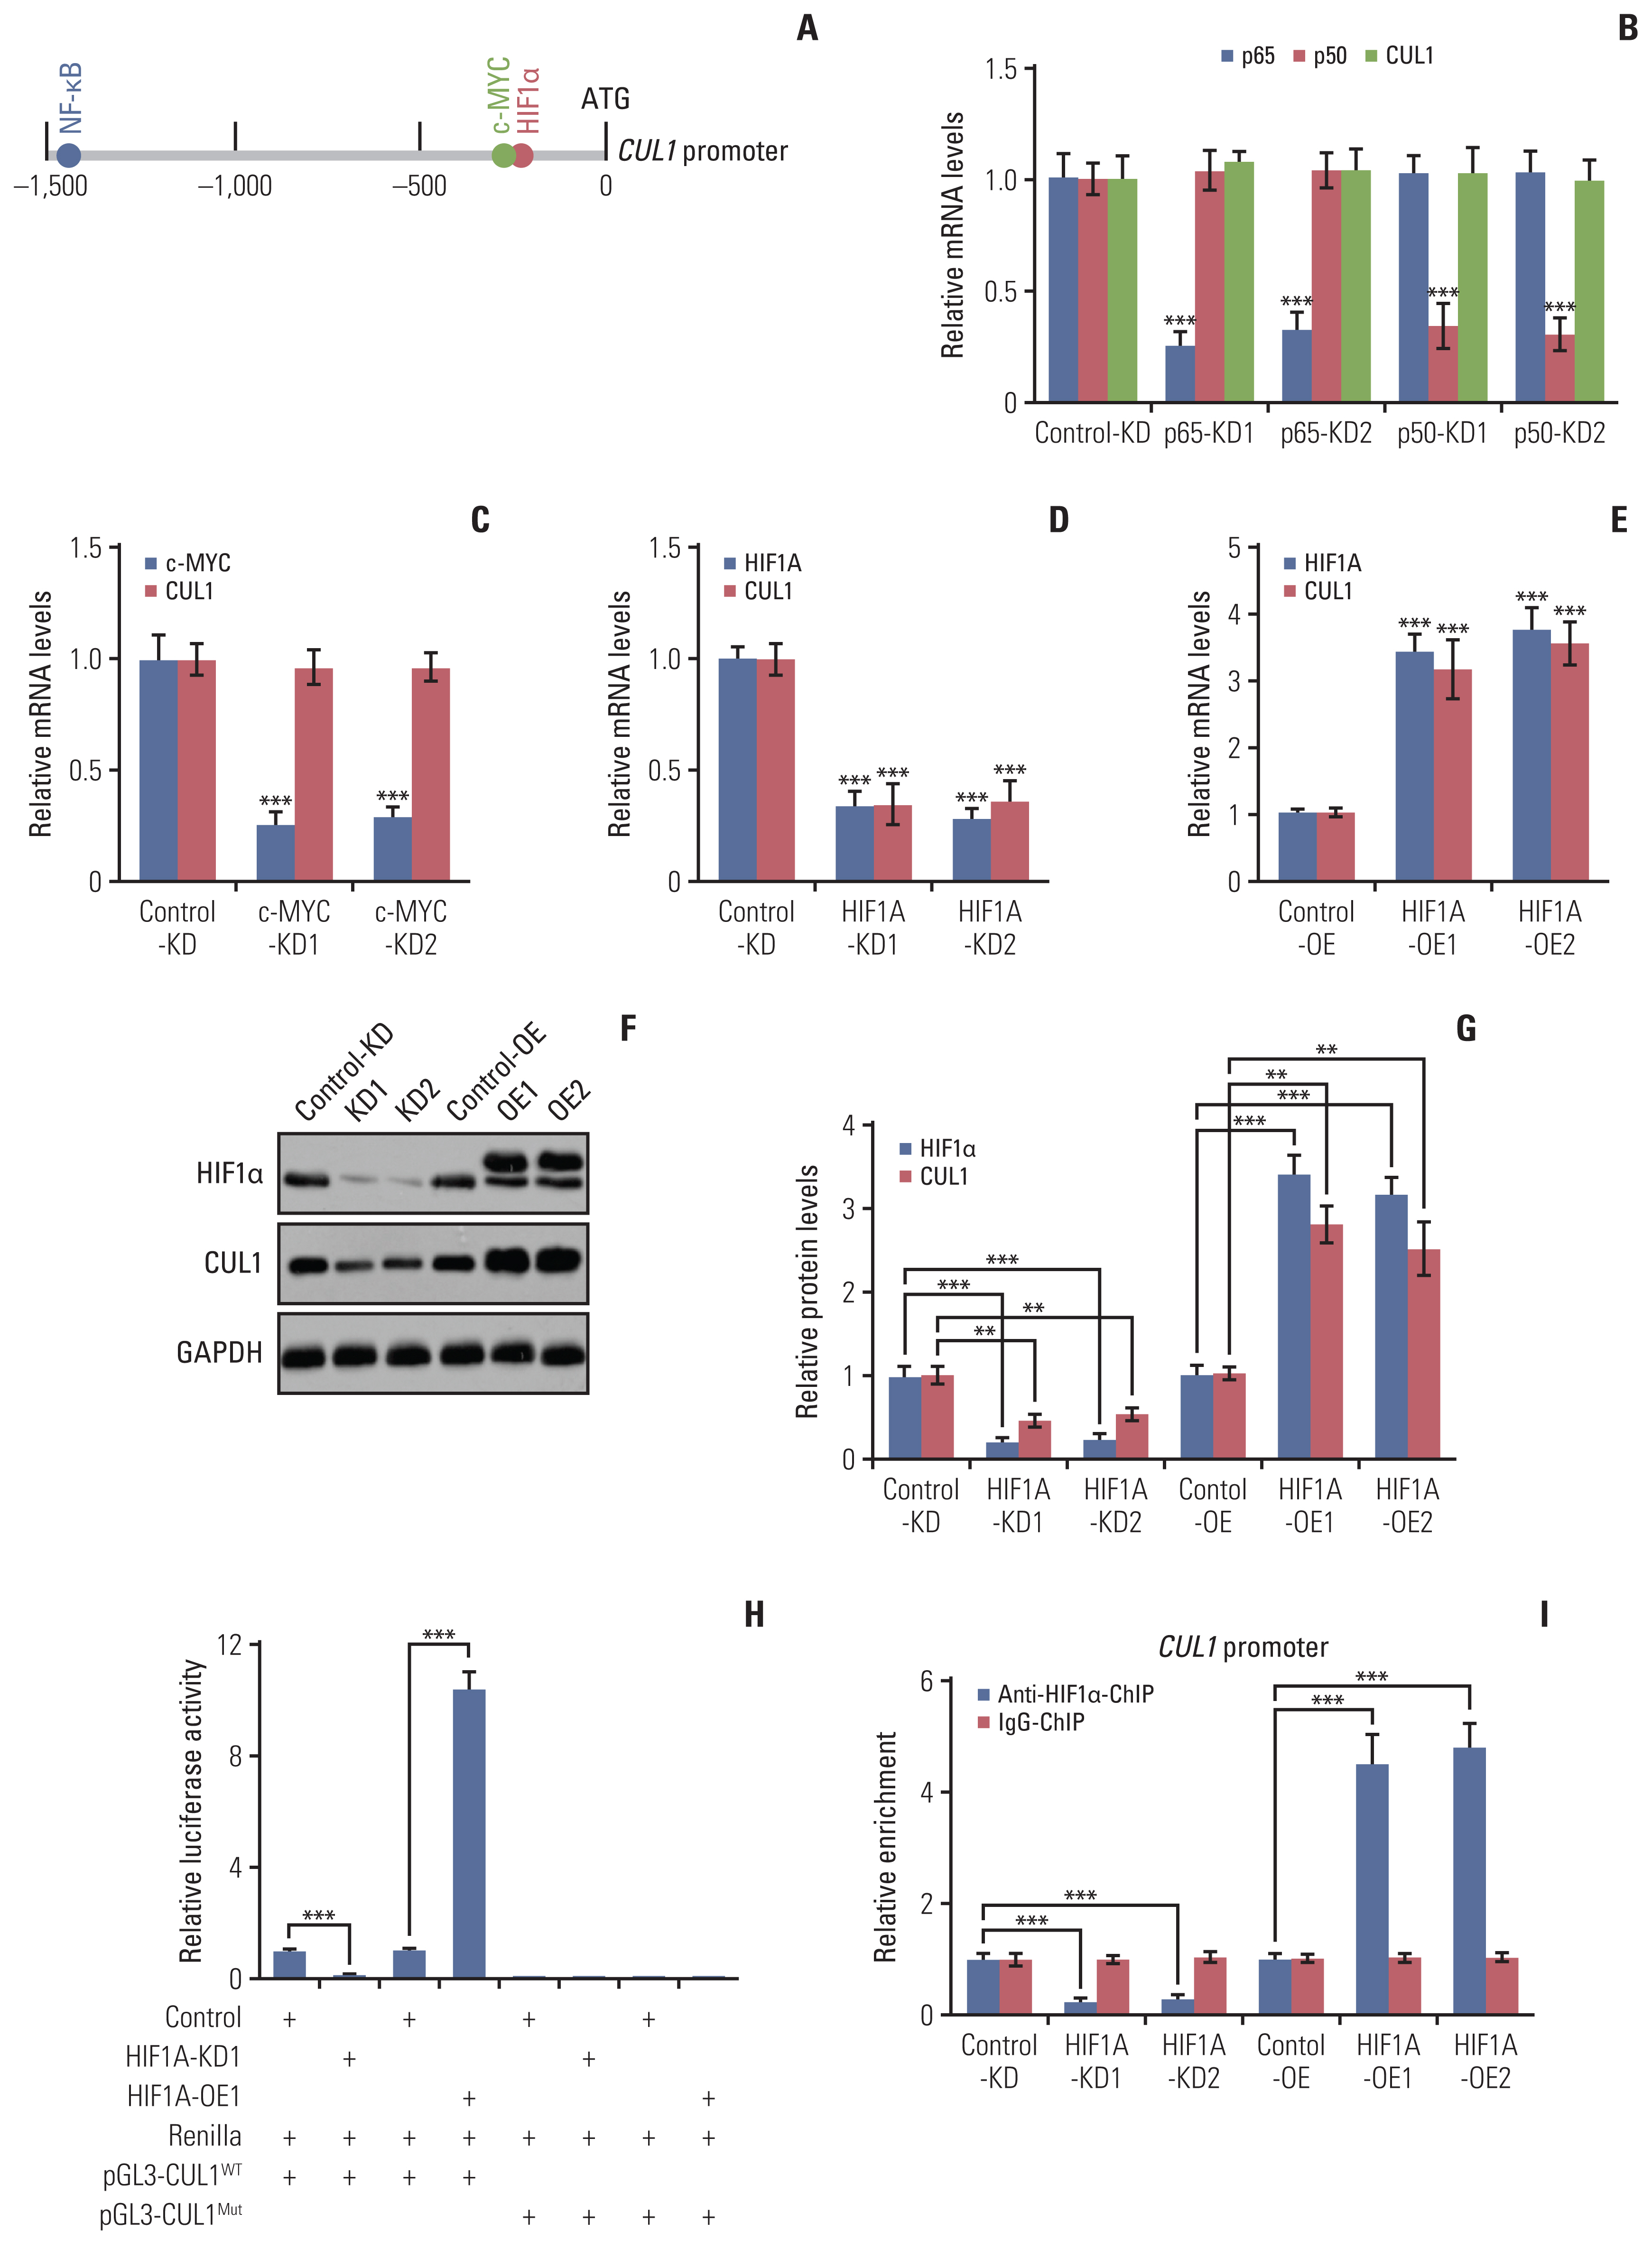
The increase in the CUL1 mRNA level in CRC tumor tissues and cells suggested that CUL1 was regulated at the transcriptional level. We investigated the mechanism of CUL1 induction by selecting a 1,500 bp length of the CUL1 promoter that localizes before the transcription stat site (TSS). We input the CUL1 promoter sequences into a website (http://alggen.lsi.upc.es/) to predict the potential binding sites of transcription factors and to manually check the consensus sequences of the transcription factors, and we identified three oncogenic transcription factors, HIF1α (consensus sequence: TACGTG), c-MYC (consensus sequence: CACGTG), and nuclear factor kappa-light-chain-enhancer of activated B cells (NF-kB; consensus sequence: 5′-GGGRNYYYCC-3′ in which R is a purine, Y is a pyrimidine, and N is any nucleotide) predicted to bind on the promoter of CUL1 (Fig. 2A).
We generated the knockdown cell lines of these transcription factors in the CCD-18Co and HT29 backgrounds and then examined their effects on CUL1 expression. Downregulation of two NF-kB subunits (p50 and p65) or c-MYC did not change the expression of CUL1 (Fig. 2B and C, S8A and S8B Fig.), whereas the suppression of HIF1α resulted in a significant downregulation of CUL1 (Fig. 2D, S8C Fig.). We also created overexpression (OE) cell lines of HIF1α in both the CCD-18Co and HT29 backgrounds (Fig. 2E and F, S8D and S8E Fig.). The CUL1 mRNA levels were significantly increased in the HIF1A-OE cell lines (Fig. 2E, S8D Fig.). Consistent with the mRNA levels, we also found a decrease in the CUL1 protein levels in the HIF1A-KD cells and an increase in the HIF1A-OE cells (Fig. 2F and G, S8E and S8F Fig.). These results indicated that the HIF1α transcription factor specifically regulated the expression of CUL1. For further confirmation, we performed luciferase assays and ChIP assays to verify the binding of HIF1α to the CUL1 promoter. The luciferase assays showed that knockdown of HIF1α decreased and its overexpression increased the luciferase activity (Fig. 2H). Mutation of the HIF1α binding site (changing TACGTG to CGATCG) on the CUL1 promoter failed to change the luciferase activity in either the HIF1A-KD or HIF1A-OE cells (CCD-18Co background) (Fig. 2H). The ChIP results showed that the enrichment of HIF1α on the promoter of CUL1 was significantly decreased in HIF1A-KD cells but was increased in the HIF1A-OE cells (Fig. 2I).
HIF1α is a transcription factor mediated by hypoxia [17], so we examined the possible regulation of CUL1 expression by hypoxia by treating Control-KD and HIF1A-KD cells in the CCD-18Co background with or without hypoxia. RT-qPCR results showed that hypoxia significantly induced both HIF1A and CUL1 mRNA and protein levels in Control-KD cells (S9A–S9C Fig.), but hypoxia failed to induce either HIF1A or CUL1 at either the protein or mRNA levels in HIF1A-KD cells (S9A–S9C Fig.). ChIP assays were performed to examine the enrichment of HIF1α on the promoter of CUL1 in hypoxia-treated cells and the results also showed that hypoxia significantly increased the occupancy of HIF1α on the CUL1 promoter in Control-KD cells (S9D Fig.) but only slightly increased the occupancy of HIF1α on the CUL1 promoter in HIF1A-KD cells (S9D Fig.). These results suggested that hypoxia induced the expression of HIF1α, which then bound to the promoter of CUL1 and induced the expression of CUL1.
3. CUL1 coupled with RBX1, SKP1, and FBXL1 to assemble an E3 ligase
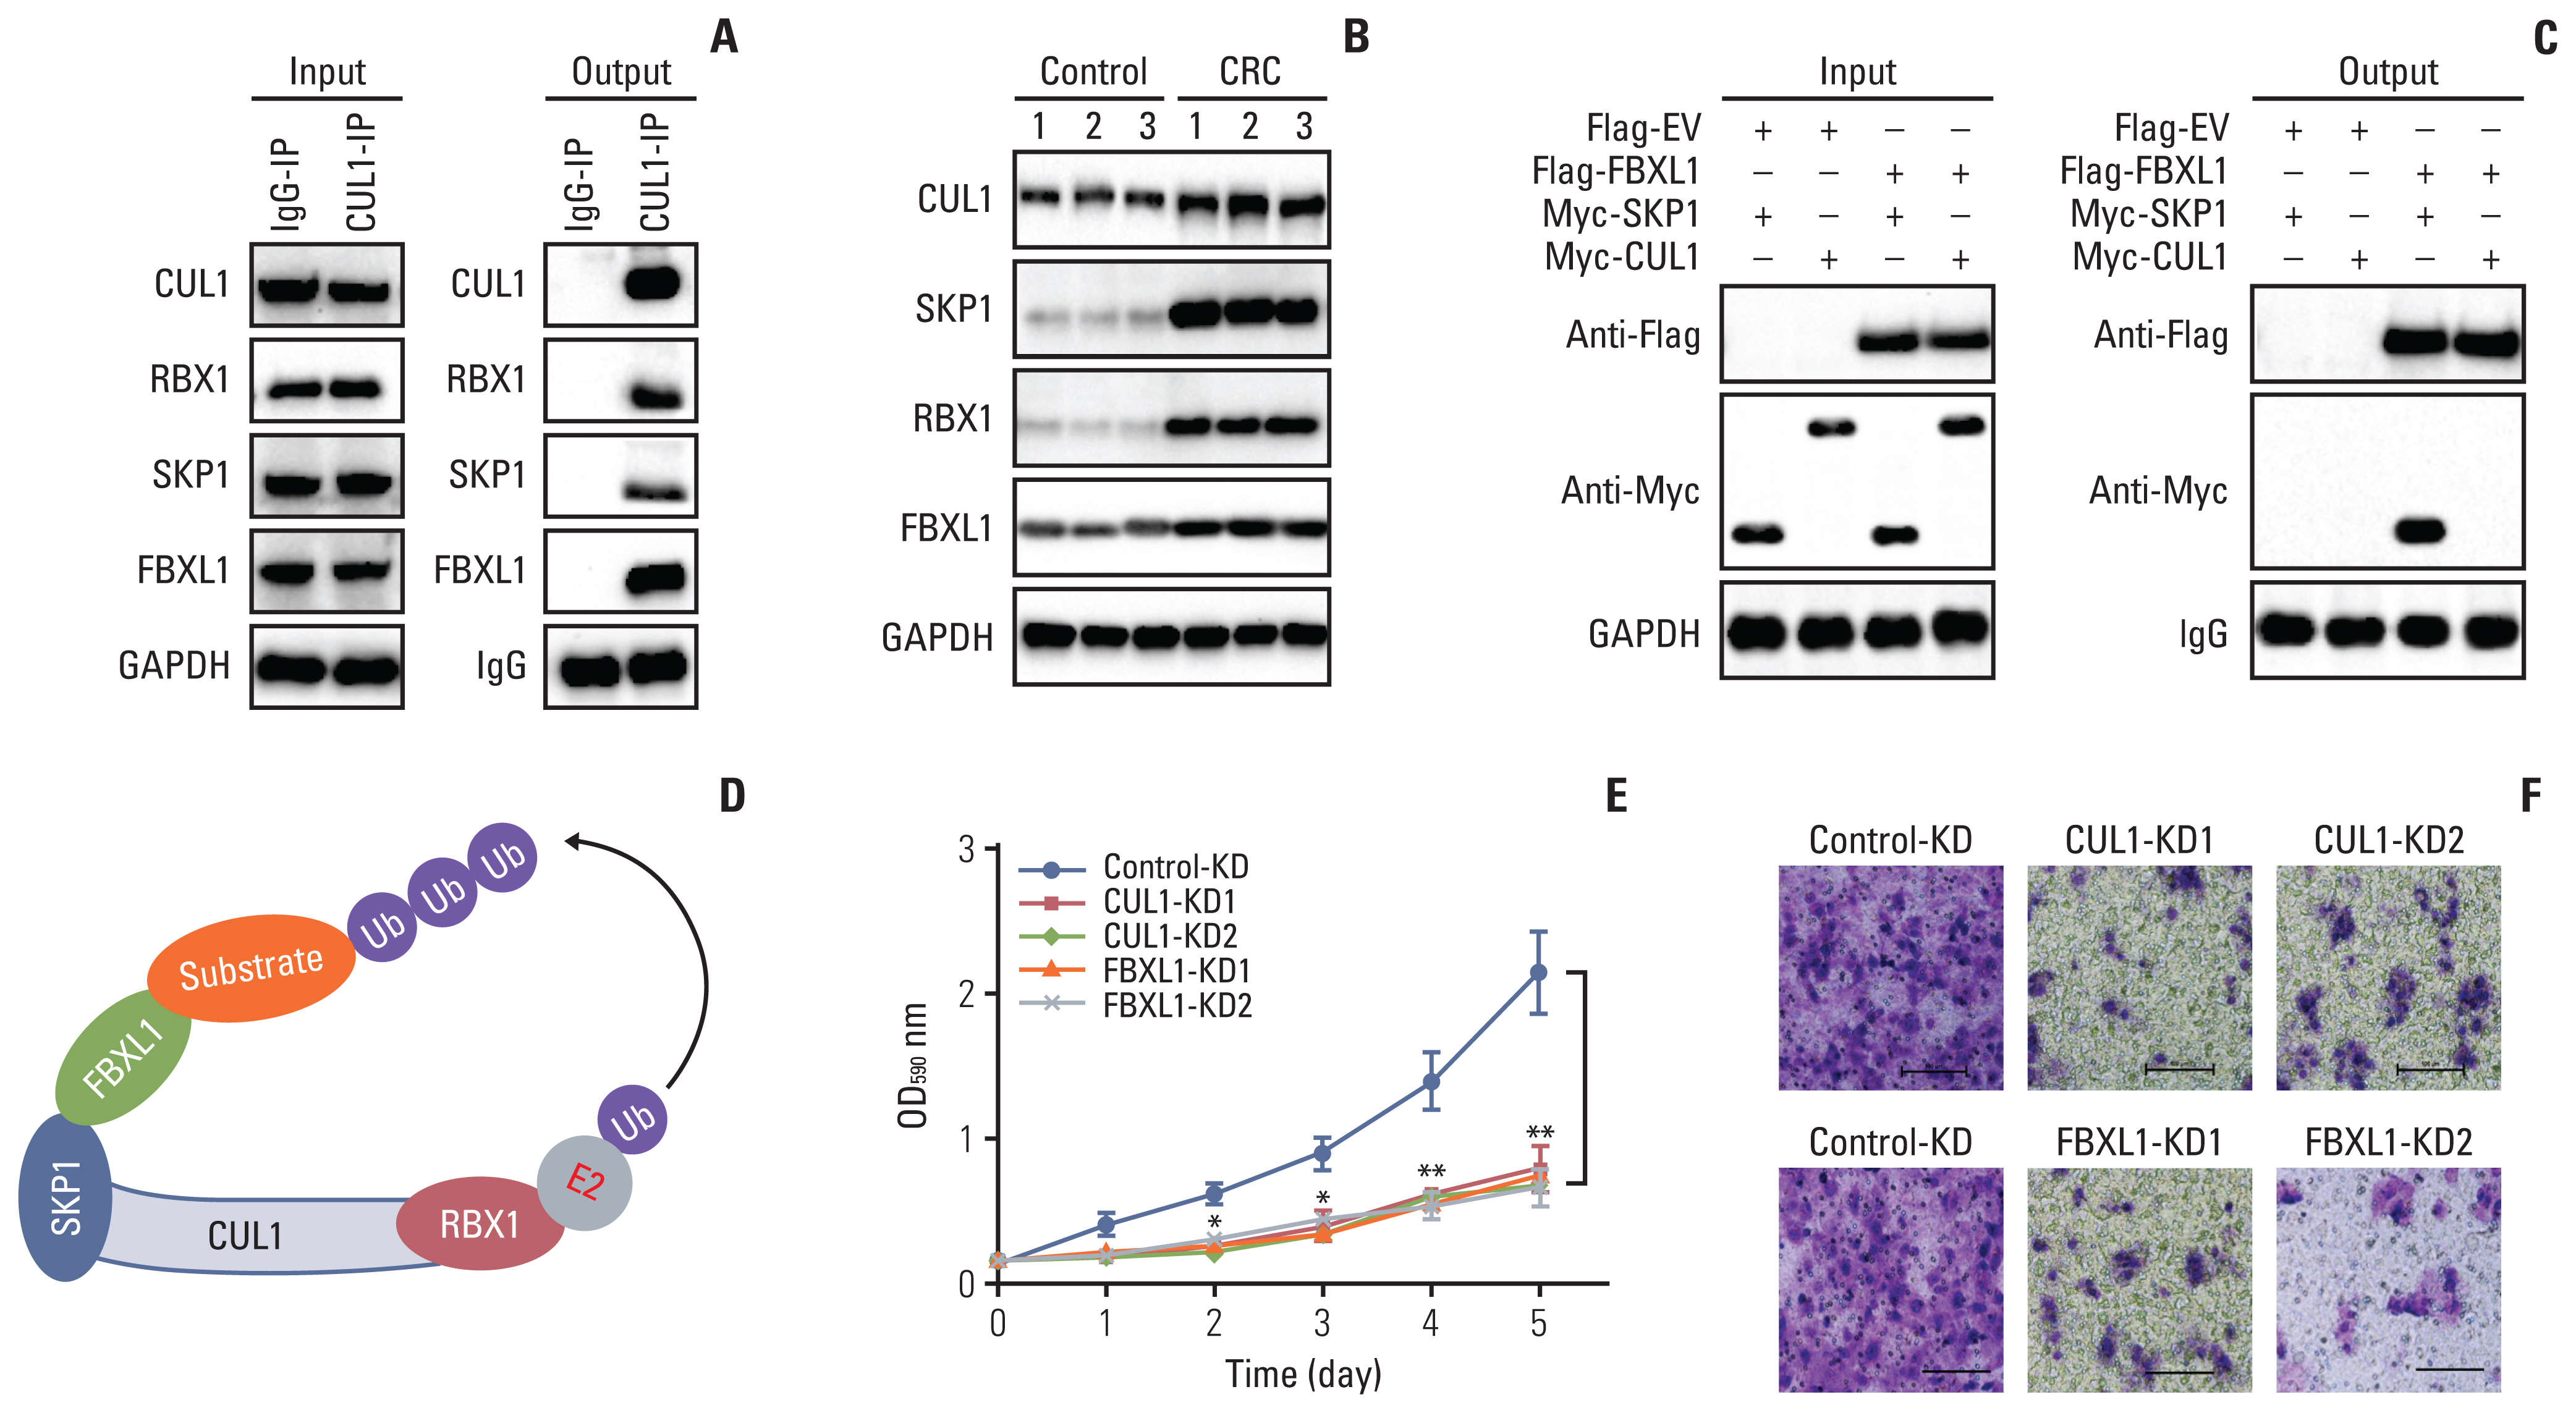
We identified the CUL1-associated E3 ligase members by IP assays with IgG and anti-CUL1-coupled protein A beads using the cell lysate mixtures of three independent primary tumors from CRC patients. Analysis of the enriched CUL1-associated protein complex by MS revealed 29 candidate proteins that could be pulled down by CUL1 (S10 Table). Among these proteins, we found RBX1, SKP1, and one F-box protein FBXL1. Using the same IP products used for the MS analysis, we performed immunoblots to verify that CUL1 could pull down RBX1, SKP1, and FBXL1 (Fig. 3A). Using the same protein lysates as in Fig. 1I, we examined the protein levels of RBX1, SKP1, and FBXL1 in CRC tumors. As observed with the CUL1 protein levels, the protein levels of RBX1, SKP1, and FBXL1 were also increased in CRC tumors (Fig. 3B).
The assembly of CUL1 with RBX1 and SKP1 into an SCF complex has been reported in many publications [9]. Therefore, we subsequently performed co-IP assays to determine the direct interaction between FBXL1 and SKP1 by co-transfecting Flag-FBXL1+Myc-SKP1 and Flag-FBXL1+Myc-CUL1 into HT29 cells. The co-IP results indicated that FlagFBXL1 could pull down MycSKP1 but not MycCUL1 (Fig. 3C). Thus, we assumed that the SCF complex recruited FBXL1 to recognize substrates for ubiquitination (Fig. 3D).
The observed increase in SCFFBXL1 complex members in CRC tumors suggested that their downregulation would inhibit CRC cell growth. We verified this hypothesis by generating FBXL1-KD cell lines in the HT29 background (S11 Fig.) and examining cell proliferation and migration using CUL1-KD (same as cells in S7 Fig.) and FBXL1-KD cells. The MTT assay and Boyden chamber assay results indicated that knockdown of CUL1 or FBXL1 significantly decreased both cell proliferation and migration (Fig. 3E and F).
4. The SCFFBXL1 E3 ligase ubiquitinated and degraded MEN1
The F-box proteins in SCF E3 ligases play essential roles in the recognition of substrates for ubiquitination [18]. We performed IP assays with IgG and anti-FBXL1-coupled protein A beads in the cell lysate mixtures of three independent primary tumors from CRC patients to identify the substrates of the SCFFBXL1 E3 ligase. Analysis of the enriched FBXL1-associated protein complex by MS revealed 44 candidate proteins that could be pulled down by FBXL1 (S12 Table). Among these proteins, we found a tumor suppressor, MEN1. Using the same IP products used for the MS analysis, we performed immunoblots and verified that MEN1 could be pulled down by FBXL1 (Fig. 4A). We also verified the direction between FBXL1 and MEN1 by co-IP assays in HT29 cells co-expressing FlagFBXL1 and MycMEN1 (Fig. 4B).
Immunoblot experiments confirmed that MEN1 protein levels were significantly downregulated in three pairs of primary colon tumors (same as in Fig. 1I) compared to their adjacent noncancerous tissues (Fig. 4C). By contrast, overexpression of MEN1 in HT29 cells inhibited cell proliferation (Fig. 4D). In vivo ubiquitination assays in CUL1-KD and FBXL1-KD cells co-transfected with Flag-MEN1 and HA-ubiquitin revealed that knockdown of CUL1 and FBXL1 significantly decreased the MEN1 ubiquitination level (Fig. 4E). These results suggested that MEN1 was a substrate of the SCFFBXL1 E3 ligase and that the degradation of MEN1 might be an important contributing factor for CRC tumorigenesis (Fig. 4F).
The finding that MEN1 was a substrate of the SCFFBXL1 E3 ligase suggested that the MEN1 protein level, and not its mRNA level, would show a negative correlation with the CUL1 protein level. Measurement of the MEN1 mRNA level (in the same RNA materials as in Fig. 1A) revealed no significant changes in CRC tumor tissues compared to their adjacent noncancerous tissues (S13A Fig.). By contrast, immunoblots performed using the same biopsies showed a significant decrease in the MEN1 protein level in the CRC tumor tissues (S13B and S13C Fig.), whereas the CUL1 protein level was increased (S13B and S13D Fig.). The Pearson correlation assay result confirmed a negative correlation between the MEN1 and CUL1 protein levels in the cancerous tissues (p < 0.01) (S13E Fig.).
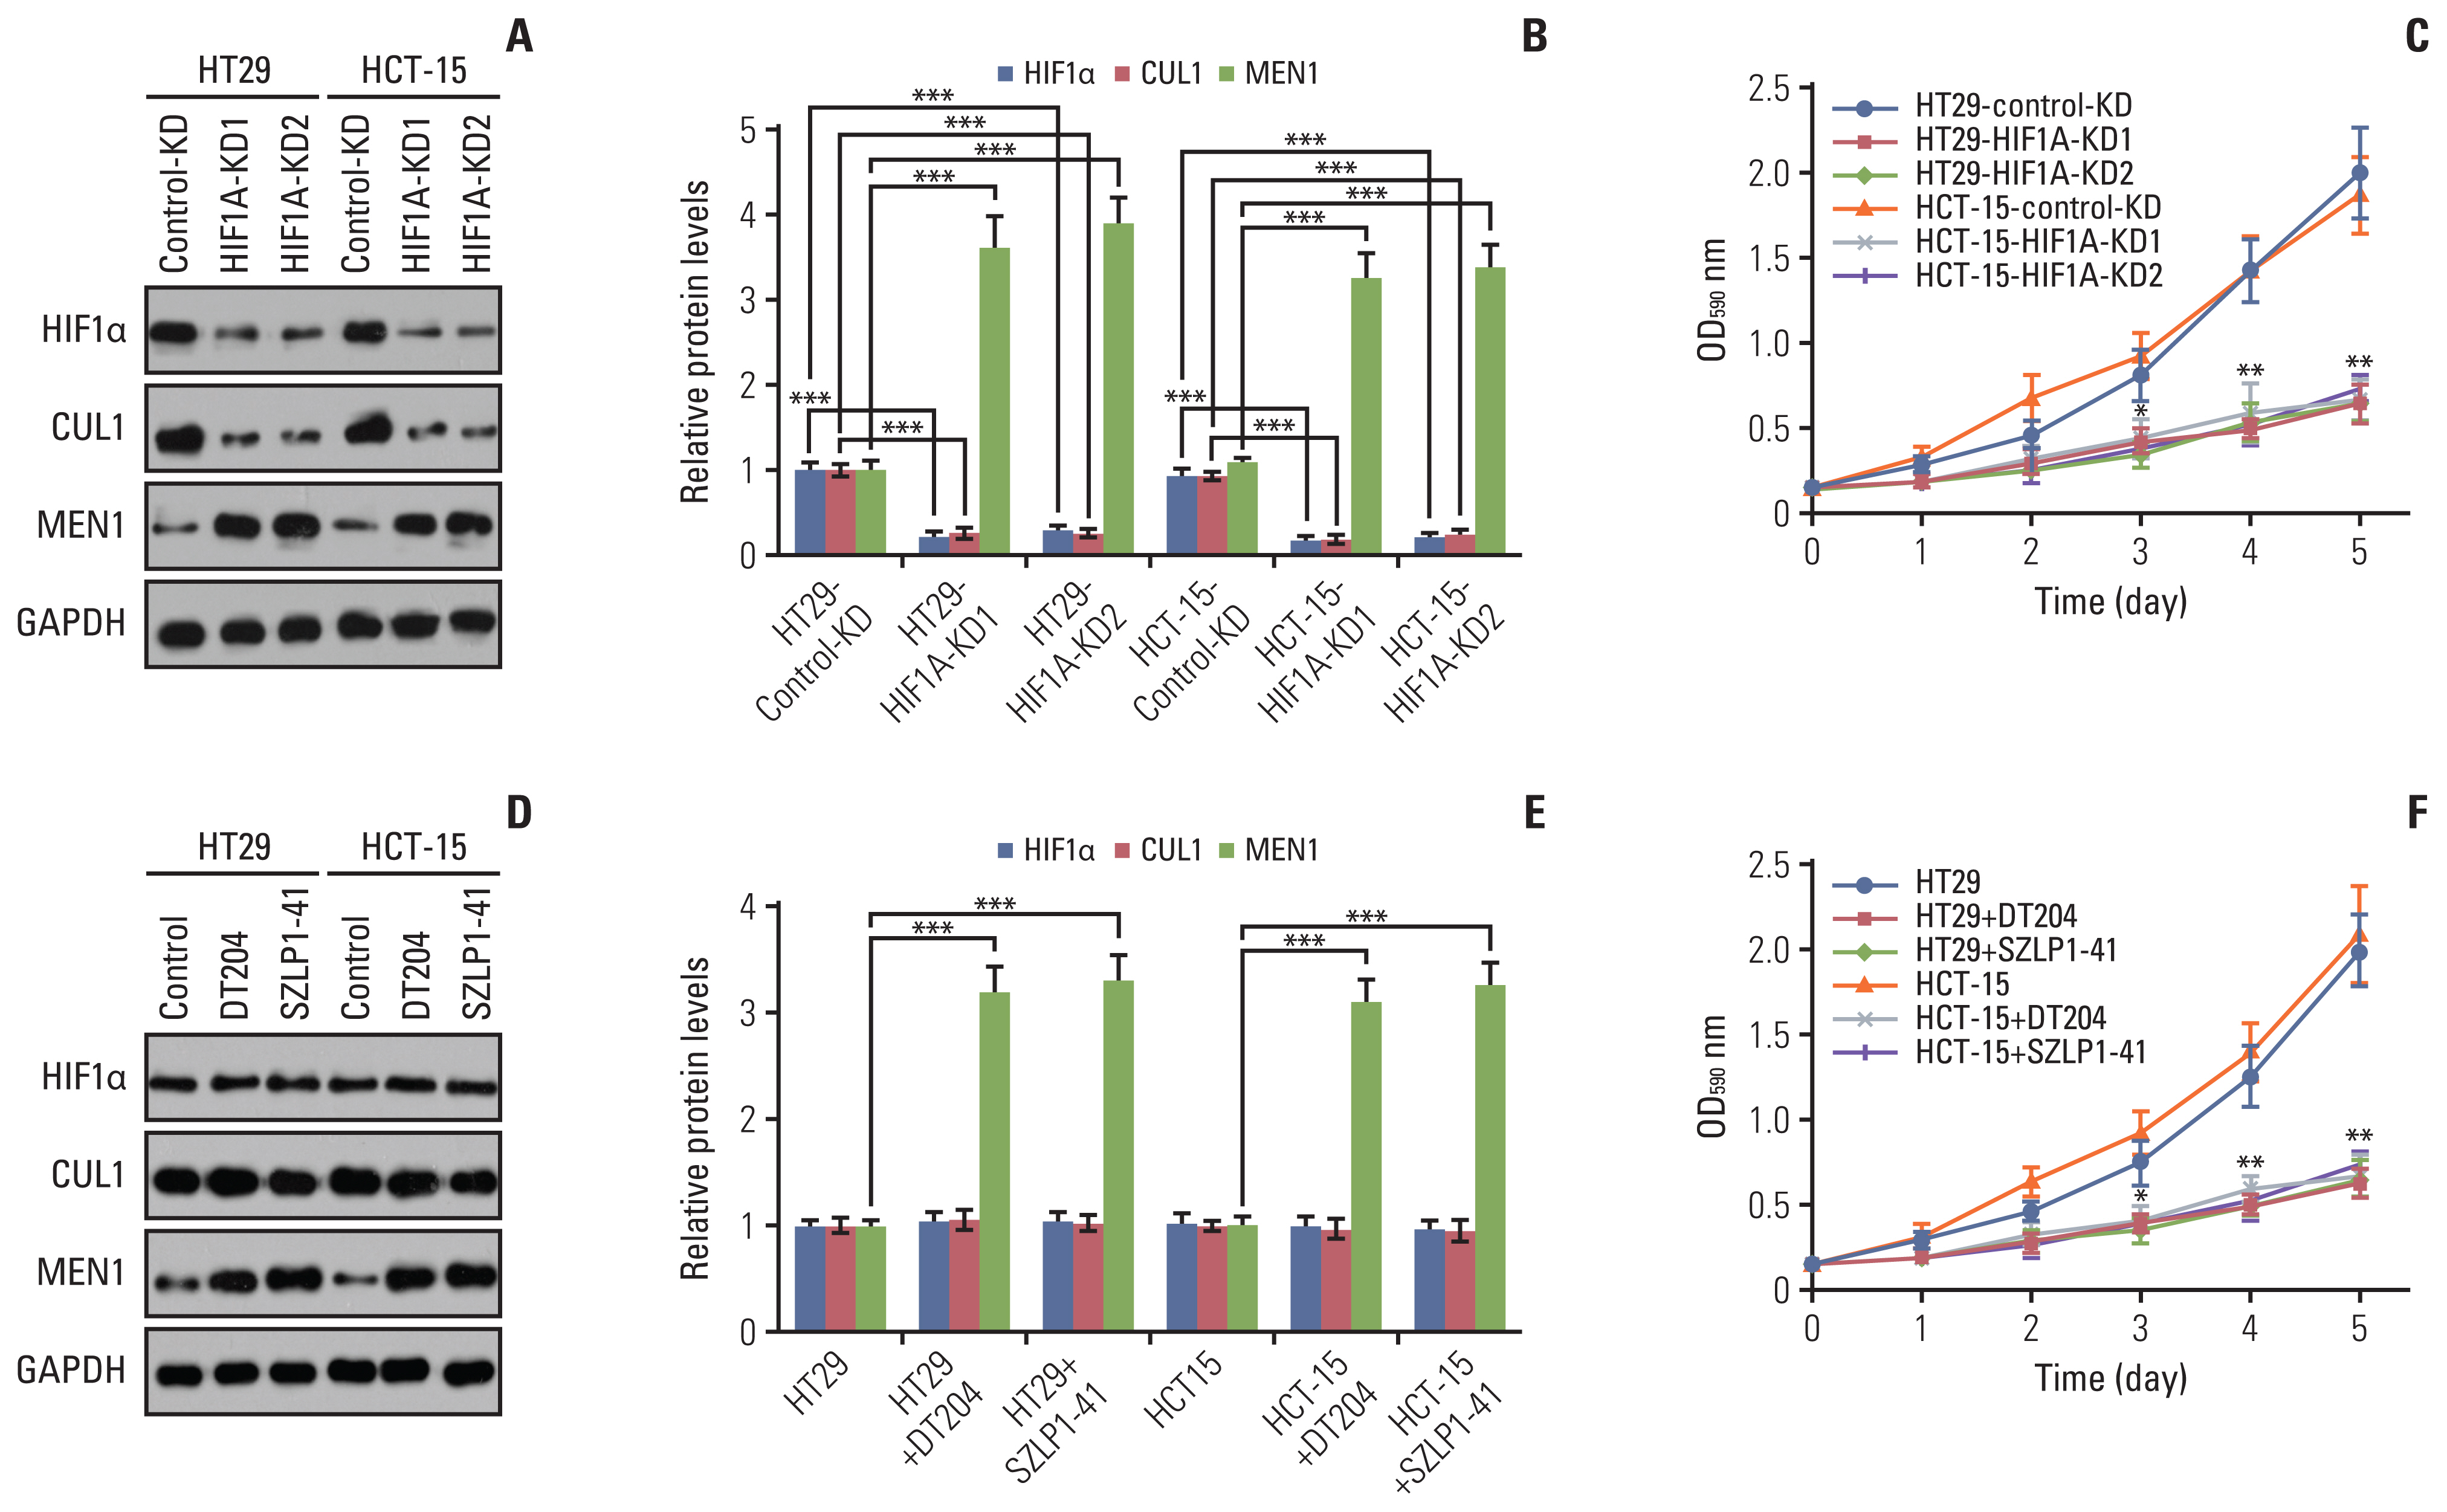
5. Knockdown of HIF1α or blockage of SCFFBXL1 in CRC cells significantly increased the MEN1 protein level and inhibited cell proliferation
The finding that HIF1α controlled the expression of CUL1 suggested that knockdown of HIF1α would affect the MEN1 protein level. We generated HIF1A-KD cells in both HT29 and HCT-15 backgrounds (Fig. 5A and B, S14A Fig.) and then examined MEN1 mRNA and protein levels in these cells. The RT-qPCR results showed that a deficiency in HIF1α did not change the mRNA level of MEN1 (S14A Fig.). ChIP assays were performed to examine the enrichment of HIF1α on the promoter of MEN1 in the HIF1A-KD cells and the results revealed that HIF1α did not bind to the MEN1 promoter (S14B Fig.). However, the binding of HIF1α to the CUL1 promoter was significantly decreased by the deficiency of HIF1α (S14C Fig.). We were unable to find a HIF1α binding site by searching the consensus sequence TACGTG on the MEN1 promoter (2,500-bp length in the upstream of TSS) (S15 Fig.). These results suggested that HIF1α could not directly regulate the expression of MEN1 at the transcriptional level.
We then used immunoblots to measure the protein level of MEN1 in HIF1A-KD cells in both HT29 and HCT-15 backgrounds. Downregulation of HIF1α caused an accumulation of MEN1 (Fig. 5A and B). Using these cells, we also detected cell proliferation and the results indicated that knockdown of HIF1α in both HT29 and HCT-15 backgrounds inhibited CRC cell growth in vitro (Fig. 5C).
DT204 and SZLP1-41 (S16 Fig.), two inhibitors of SCF E3 ligases, have been shown to disrupt the assembly of the SCF complex [19,20]. We next aimed to determine the effects of these two chemicals on the protein levels of HIF1α, CUL1, and MEN1. We treated HT29 and HCT-15 cells using 10 mM DT204 and 10 mM SZLP1-41, respectively. The immunoblot results showed that both DT204 and SZLP1-41 could not change the protein levels of HIF1α and CUL1 (Fig. 5D and E). However, treatments with these two chemicals resulted in the significant accumulation of MEN1 (Fig. 5D and E). We also detected the effects of these two chemicals on cell proliferation using HT29 and HCT-15 cells. The MTT assay results indicated that DT204 and SZLP1-41 significantly inhibited cell proliferation (Fig. 5F).
6. Knockdown of HIF1α, CUL1, or FBXL1 or blockage of SCFFBXL1 significantly inhibited tumor growth and increased tumor sensitivity to the chemotherapeutic drug CPT
Since knockdown of HIF1α or CUL1, or blockage of SCFFBXL1 could inhibit cell proliferation by increasing the protein level of MEN1, we assumed that knockdown of MEN1 in HIF1A-KD, CUL1-KD, and FBXL1-KD cells would restore cell proliferation. We therefore transfected MEN1-specific shRNAs into HIF1A-KD1, CUL1-KD1, and FBXL1-KD1 cells (all in the HT-29 background) (S17A–S17C Fig.). Cell proliferation assays on Control-KD, HIF1A-KD1, HIF1A-KD1+MEN1-KD (#1 and #2), CUL1-KD1, CUL1-KD1+MEN1-KD (#1 and #2), FBXL1-KD1, and FBXL1-KD1+MEN1-KD (#1 and #2) cells confirmed that knockdown of MEN1 in HIF1A-KD1, CUL1-KD1, and FBXL1-KD1 backgrounds restored cell proliferation rates to those seen in the Control-KD cells (S17D Fig.).
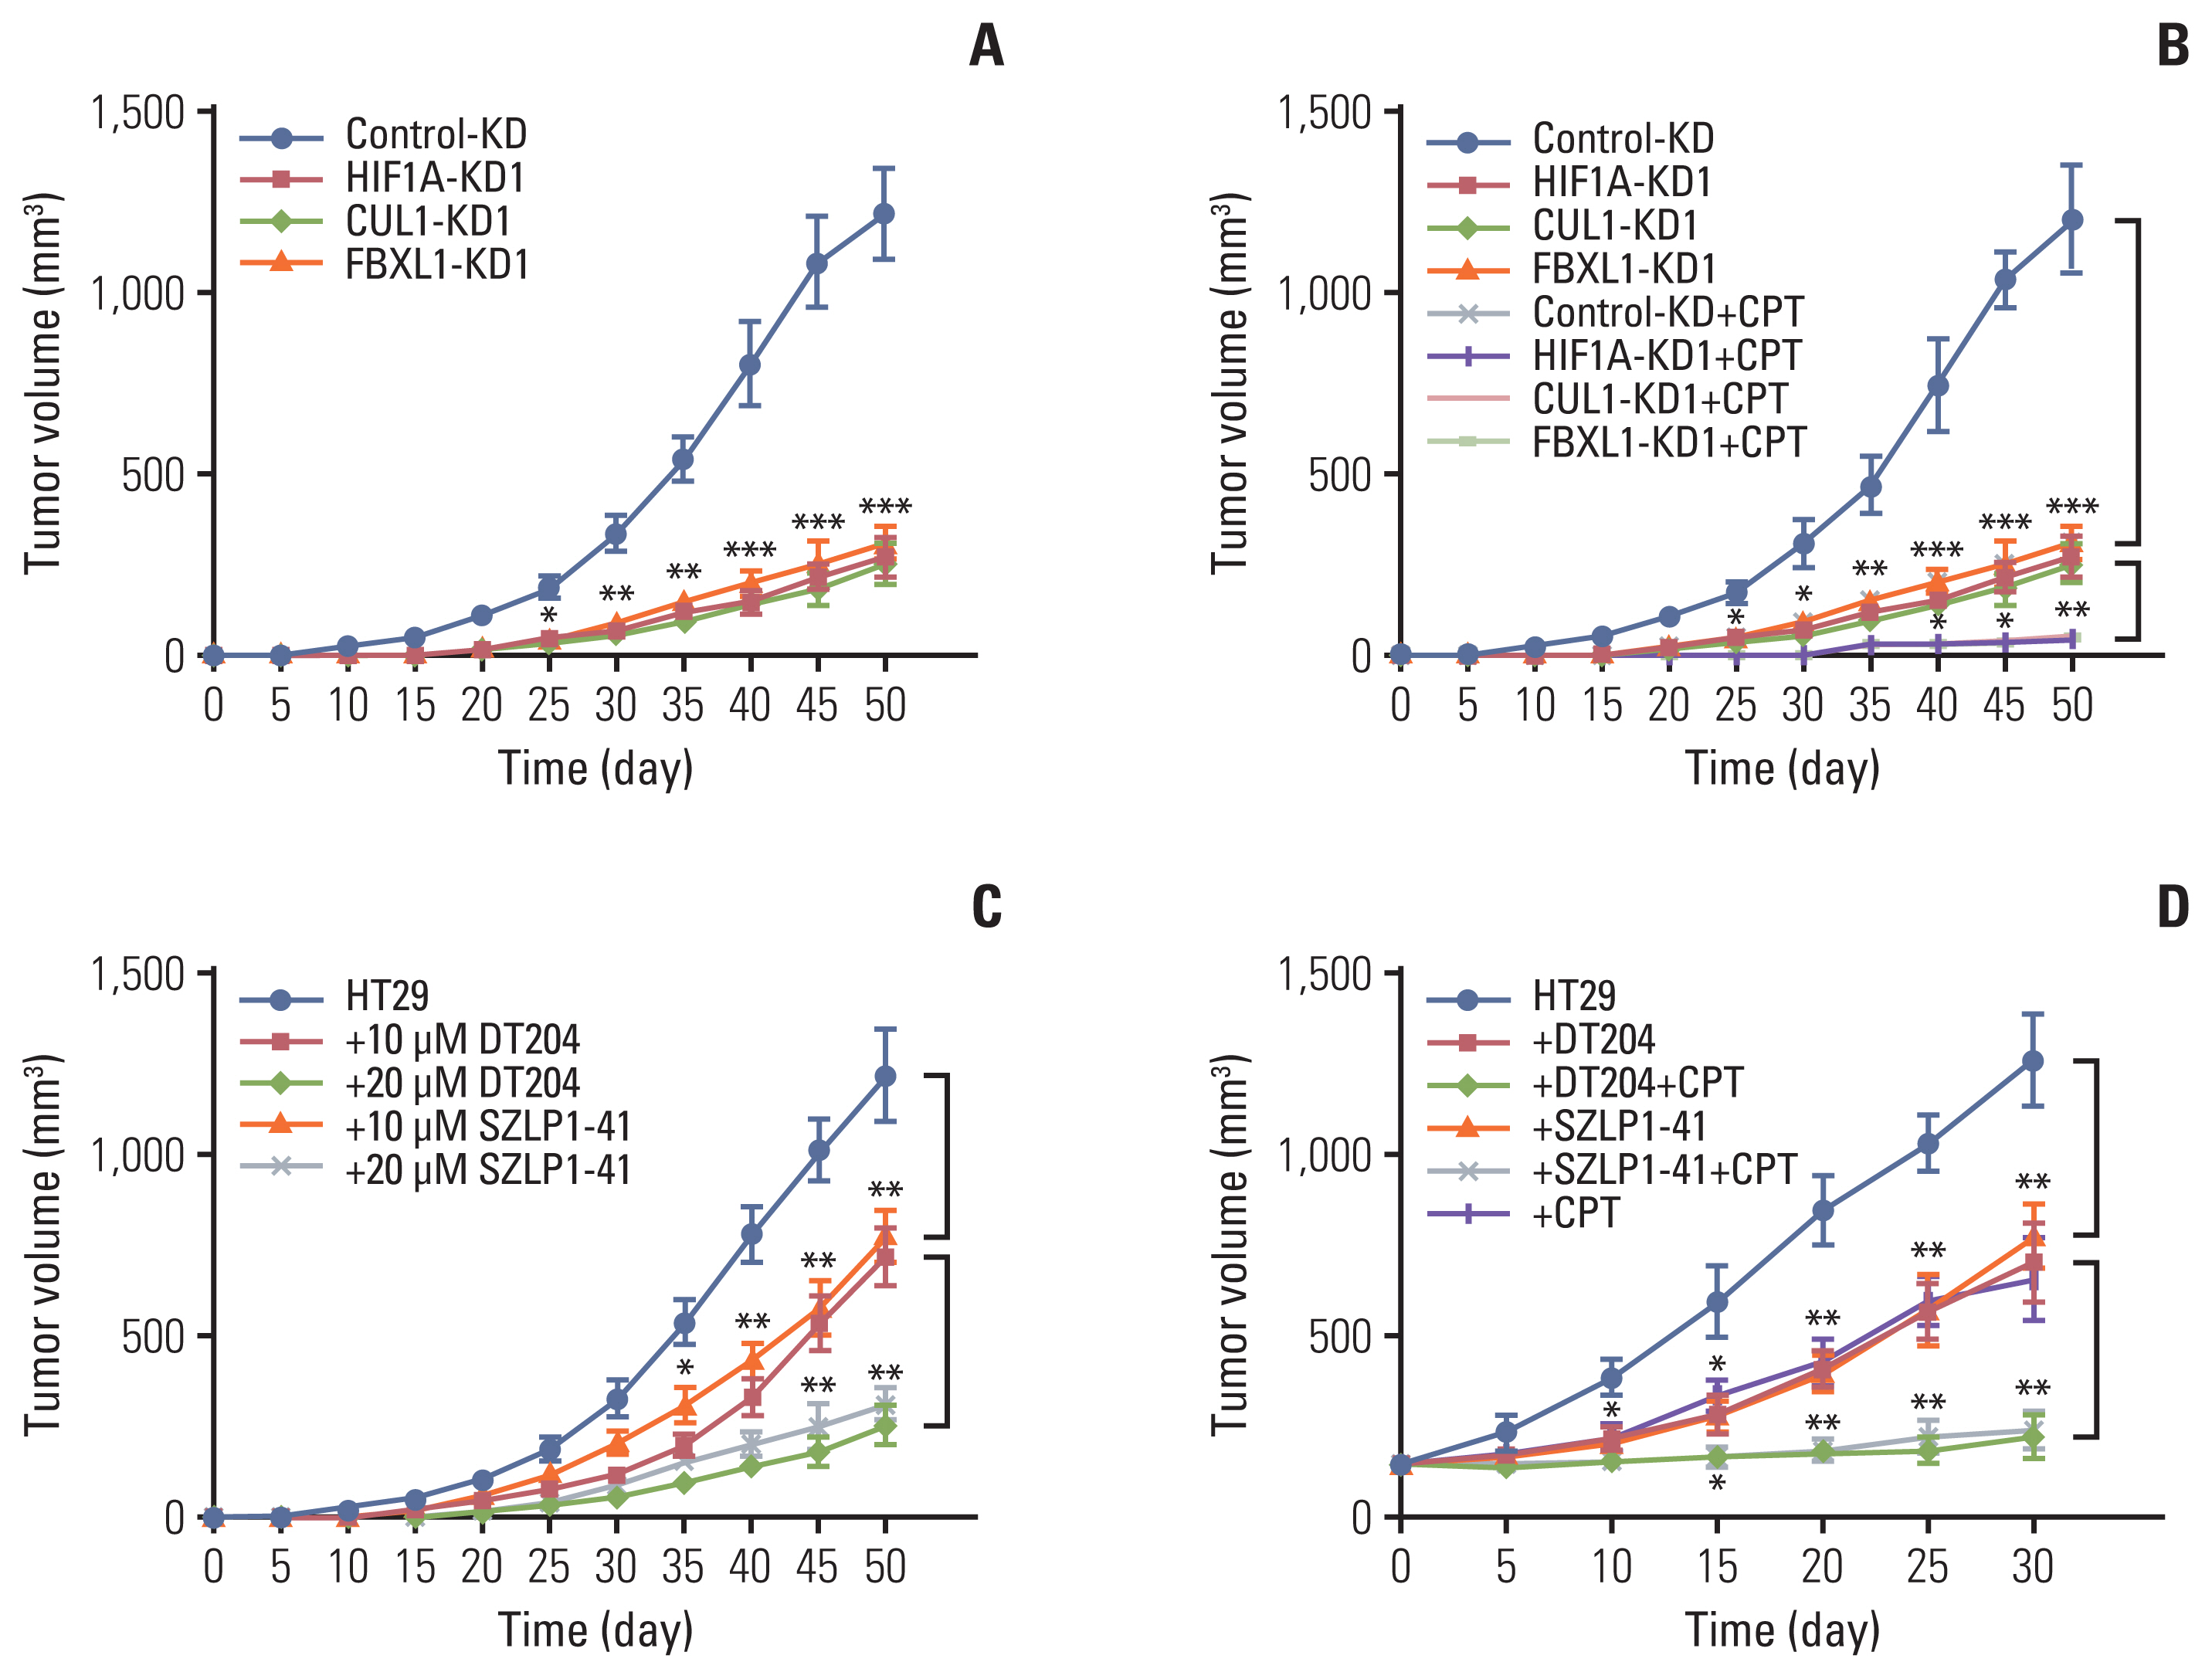
We also injected Control-KD, HIF1A-KD1, CUL1-KD1, and FBXL1-KD1 cells into nude mice to generate tumors and then monitored tumor volumes at 5-day intervals. These in vivo experiments revealed that knockdown of HIF1α, CUL1, and FBXL1 significantly decreased tumor growth (Fig. 6A). Similar injection of the cells used in Fig. S11D into nude mice revealed that the tumor volumes increased in mice injected with HIF1A-KD1+MEN1-KD, CUL1-KD1+MEN1-KD, and FBXL1-KD1+MEN1-KD cells and reached a similar size to the tumors in the mice injected with Control-KD cells (S17E Fig.).
We also evaluated the sensitivity of tumors to the chemotherapeutic drug CPT by injecting mice with Control-KD, HIF1A-KD1, CUL1-KD1, and FBXL1-KD1 cells with or without CPT. The tumor volumes were much smaller in mice injected with HIF1A-KD1, CUL1-KD1, or FBXL1-KD1 cells with CPT than with the same cells without CPT (Fig. 6B). This finding suggested that downregulation of HIF1α, CUL1, or FBXL1 might increase tumor sensitivity to CPT in vivo.
Injection of HT29 cells into nude mice and subsequent treatment with PBS, 10 mM DT204, 20 mM DT204, 10 mM SZLP1-41, or 20 mM SZLP1-41 showed that both DT204 and SZLP1-41 significantly decreased in vivo tumor growth (Fig. 6C). Moreover, we also evaluated the co-effects of DT204+CPT and SZLP1-41+CPT on tumor growth. For this purpose, we firstly injected HT29 cells into nude mice to generate tumors and then randomly divided mice with similar tumor volumes (~150 mm3) into six groups and then injected the following chemicals: PBS, 20 mM DT204, 20 mM SZLP1-41, CPT, CPT+DT204, and CPT+SZLP1-41. We found that the combined treatment of CPT+DT204 and CPT+SZLP1-41 completely inhibited tumor growth (Fig. 6D), which was much more significant than treatment with CPT, DT204, or SZLP1-41 alone (Fig. 6D). These results suggested that targeting the SCFFBXL1 E3 ligase might increase CRC tumor sensitivity to chemotherapeutic drugs like CPT.
Discussion
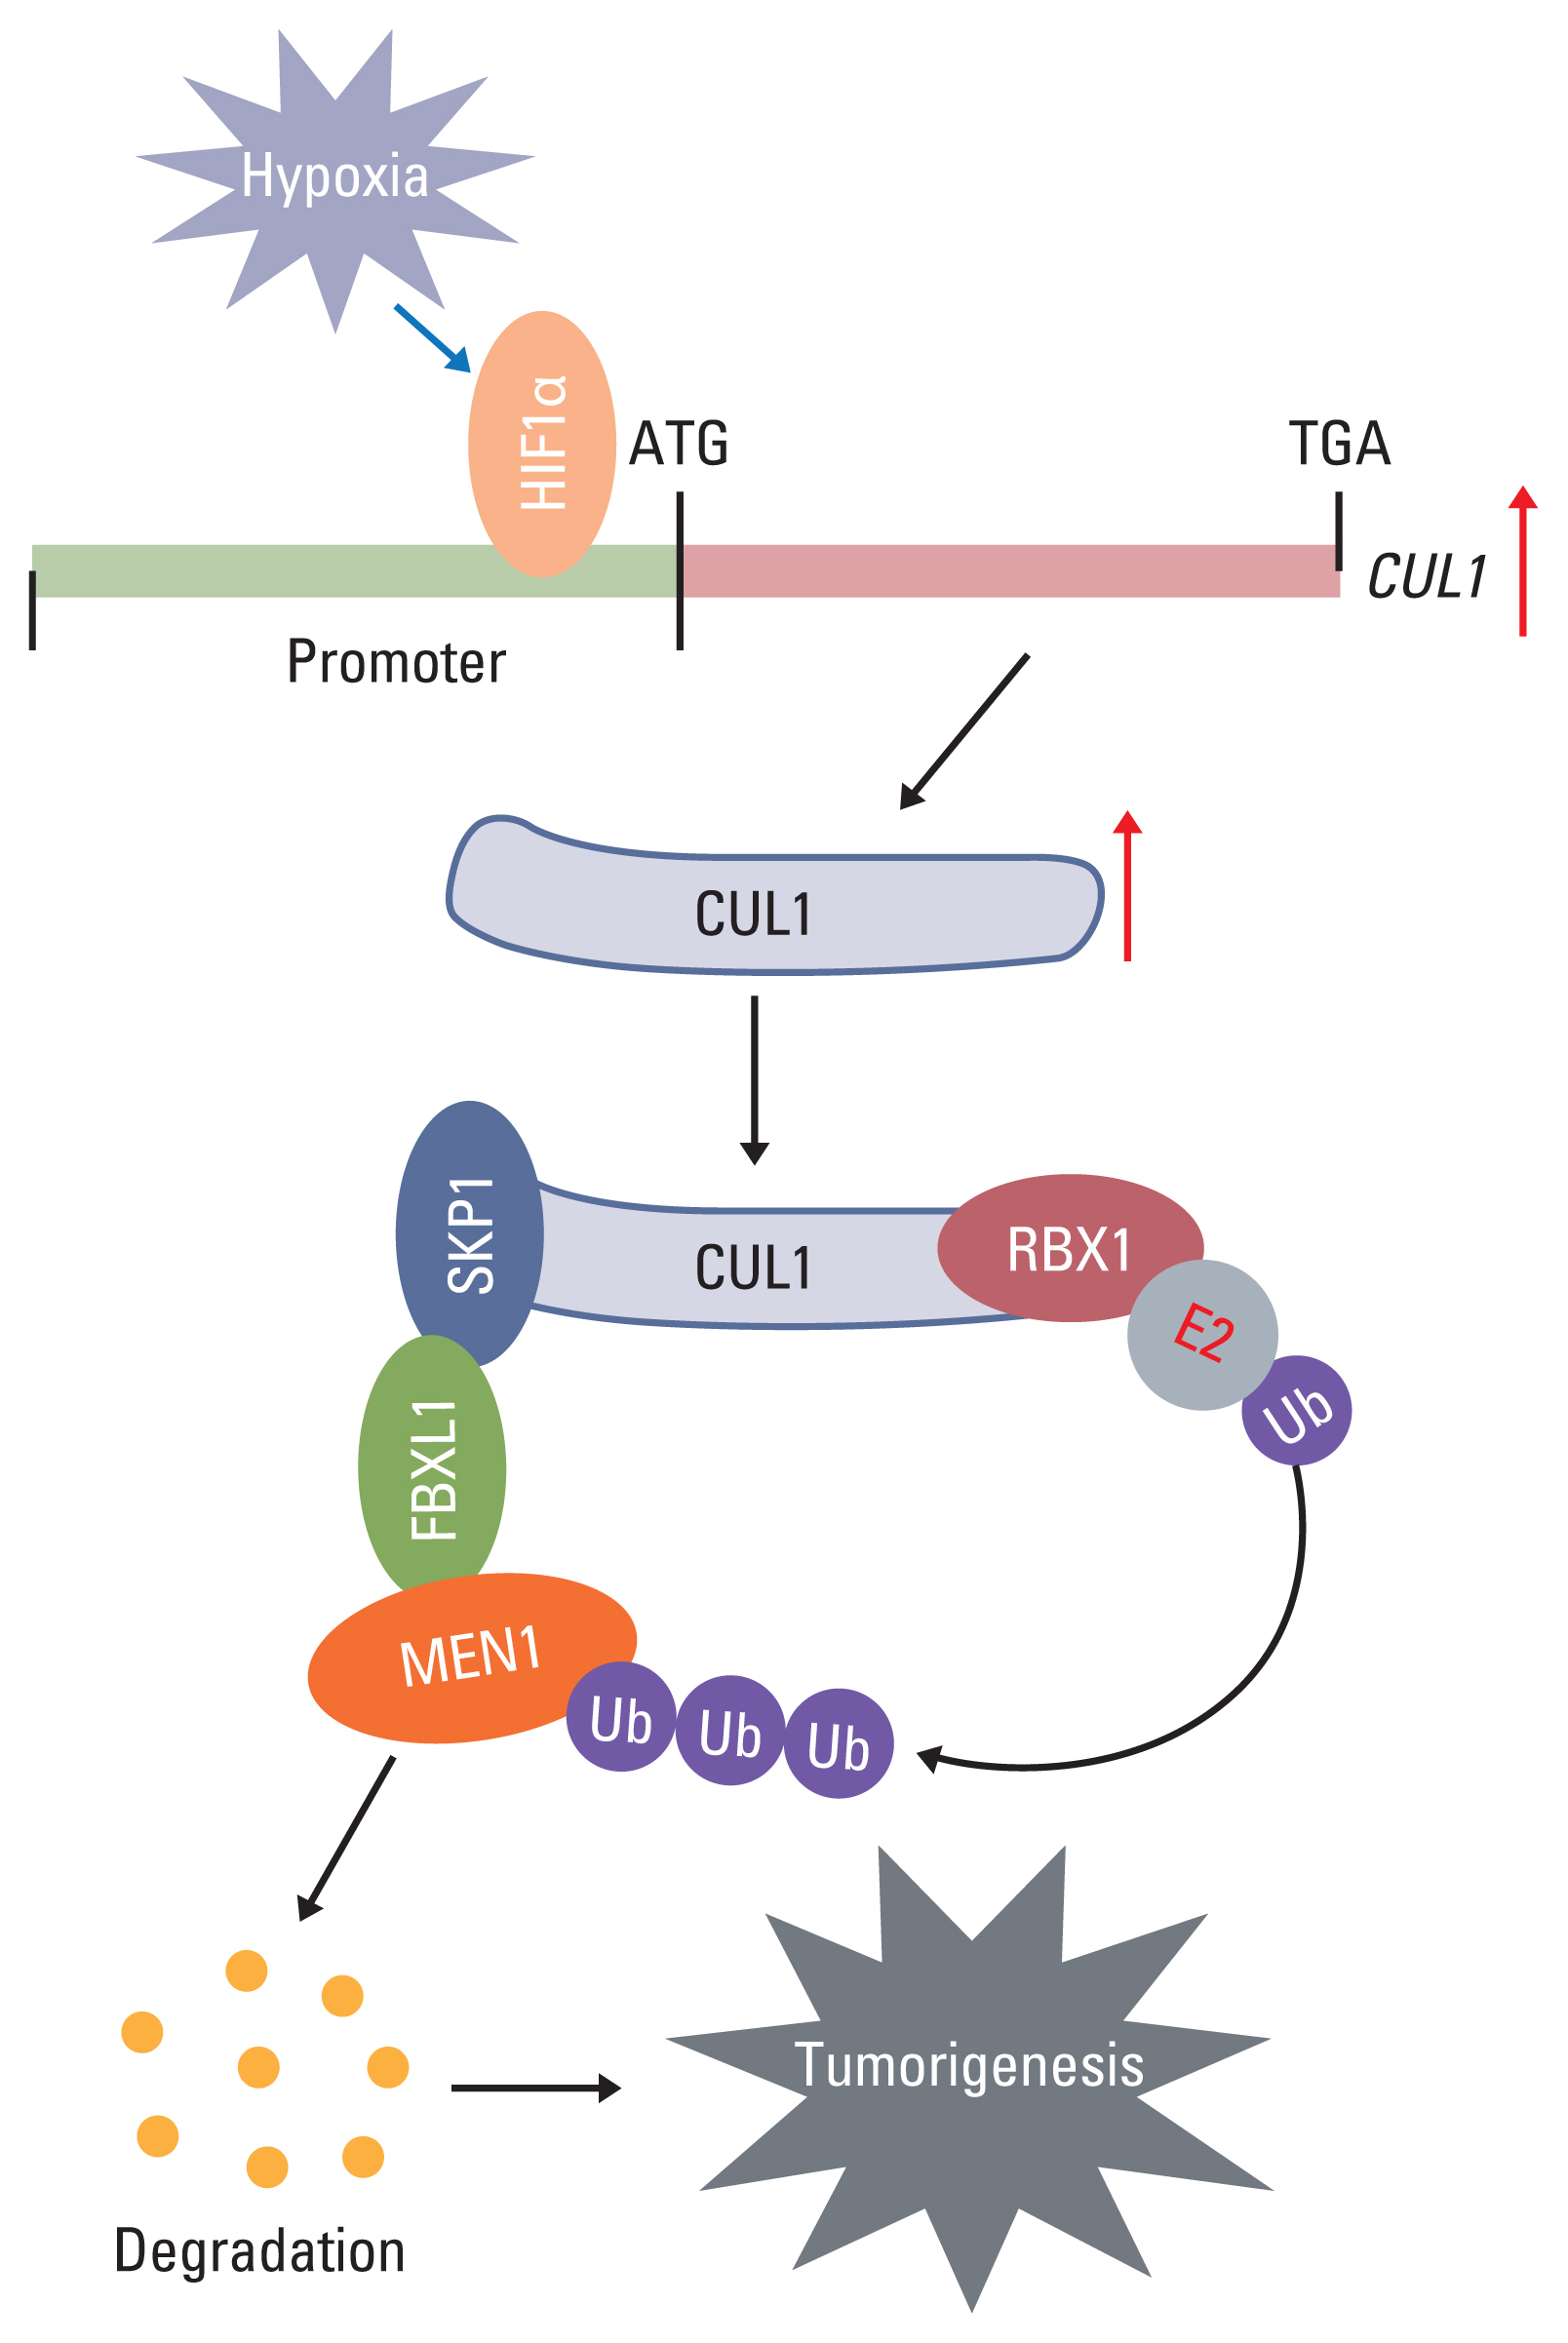
SCF is an important E3 ligase that ubiquitinates and degrades intracellular proteins. In recent years, an involvement of SCF E3 ligases has been reported in tumorigenesis through the degradation of a variety of substrates, such as p21 [21], p27 [22], p53 [22], BRCA1 [23], and β-catenin [24]. In the present study, we found that hypoxia induces the activation of CUL1 by the transcription factor HIF1α in CRC cells. The accumulated CUL1 then recruits RBX1 and SKP1 to assemble the core element of the SCF complex. SKP1 further recruits FBXL1, which recognizes and ubiquitinates MEN1. The resulting degradation of MEN1 promotes uncontrolled cell proliferation and results in tumorigenesis (Fig. 7).
Ubiquitination is a major posttranslational modification, and it can affect protein function by causing protein degradation, transportation, and interaction [25]. Dysregulation of protein ubiquitination is implicated in many cancers, where it causes impaired homeostasis of many oncoproteins and tumor suppressors and affects different stages of tumor progression [26]. As a major subclass of the RING E3 ligases, the CRL E3 ligases are implicated in some cancers, including CRC [9,12]. We detected overexpression of both CUL1 and CUL4A/4B in CRC tumor tissues. CUL4A/4B has been shown to play key roles in CRC tumorigenesis and to function redundantly to form a CRL4DCAF4 E3 ligase to ubiquitinate the tumor suppressor ST7 [12]. For this reason, we focused our investigation on how CUL1 might assemble an SCF E3 ligase and ubiquitinate its substrate in the current study because the work on CUL4A/4B found overexpression of only CUL4A/4B but not the other cullin proteins. One possible explanation for this inconsistency in CUL1 expression in different studies is the differences in the populations of tumor samples examined.
In the present study, we found 44 FBXL1-associated proteins (S12 Table). We found that MEN1 was a substrate of the SCFFBXL1 E3 ligase, but we cannot exclude the possibility that other proteins might also be substrates of the SCFFBXL1 E3 ligase. Further experiments are required to explore the possible contributions of these many FBXL1-associated proteins to CRC metastasis.
Mutation or dysregulation of MEN1 has been reported in a variety of gland-associated tumors and causes unregulated cell proliferation [13–15]. Our results are the first to reveal that MEN1 is downregulated in non-gland tumors, suggesting a complexity of MEN1 involvement in the pathogenesis of cancers. The human MEN1 protein sequence contains 610 amino acids, including 31 lysine (K) sites that are scattered throughout each domain of MEN1. Our future work will aim to dissect the ubiquitination site of MEN1.
The SCF E3 ligases have key functions in cancer development, progression, and metastasis, making them potential targets in the treatment of different cancers [27]. Several specific inhibitors, such as DT204, SZLP1-41, and MLN4924, have been developed to target SCF E3 ligases [19,20,27]. DT204 is an inhibitor of SCFFBXL1 and it can inhibit the binding of FBXL1 to the SCF complex [19]. SZLP1-41 is an inhibitor of FBXL1, and it selectively suppresses the assembly of the SCFFBXL1 complex [20]. MLN4924 can block CUL neddylation and inactivate CRL E3 ligases, thereby causing an accumulation of CRL substrates and regulating cell cycle progression and apoptosis to inhibit cancer cell growth [27]. Our in vivo evaluation of the effects of DT204 and SZLP1-41 alone and in combination with CPT gave promising results indicating that the combination DT204+CPT and SZLP1-41+CPT treatments completely inhibited tumor growth. This suggests that targeting the SCFFBXL1 E3 ligase prior to chemotherapeutic drug treatments may represent a new strategy for the treatment of CRC.
In summary, our study reveals that the hypoxia-induced SCFFBXL1 E3 ligase can ubiquitinate and degrade MEN1 in CRC cells and that this degradation of MEN1 then leads to tumorigenesis. The SCFFBXL1 E3 ligase is therefore a promising therapeutic target for the treatment of CRC.