Introduction
Radiation-related toxicity is an important clinical consideration in radiation oncology, especially in cases with a good prognosis.
Radiotherapy (RT) is a standard treatment for patients with early-stage extranodal marginal zone lymphoma of the mucosa-associated lymphoid tissue (EMZL) and follicular lymphoma (FL) of the stomach or duodenum [1–3]. In patients with early-stage indolent lymphoma, RT alone can achieve excellent outcomes [4–8].
The main function of the pancreas is to control the blood glucose level. Insulin secreted by the beta cells of the pancreas lowers the blood glucose level. Hence, if the pancreas is damaged, diabetes can occur [9]. Since the pancreas is in close proximity to the stomach and duodenum, it could be inadvertently irradiated when the gastroduodenal region is irradiated [1–3]. However, the radiation dose to the pancreas has not been considered important [10].
Limited data is available on the association between pancreatic irradiation and diabetes. Previous a few studies have found an increased incidence of diabetes after abdominal irradiation in childhood cancer, Hodgkin lymphoma, and testicular cancer long-term survivors [11–14]. However, in older adult patients, only one study has reported a decrease in insulin secretion 1 year after abdominal irradiation for gastric cancer [15].
Therefore, this study aimed to evaluate the effect of RT on the risk of diabetes by assessing hemoglobin A1c (HbA1c) levels in adult patients with gastroduodenal indolent lymphoma.
Materials and Methods
1. Patients
We retrospectively collected data on patients who had pathologically proven stage IE EMZL or FL of the stomach or the duodenum and who had been treated with Helicobacter pylori eradication and/or RT between 2000 and 2019 at the Samsung Medical Center. One hundred and ninety-three patients with either stage IE gastroduodenal EMZL (n=151) or FL (n=42) received definitive RT without chemotherapy. Of them, only 19 patients had undergone HbA1c tests during regular medical checkups before and after RT. After excluding two patients who had pre-existing diabetes, the remaining 17 patients were included in the RT group. Furthermore, of the 626 patients who were treated only with H. pylori eradication for stage IE gastroduodenal EMZL, 66 had undergone HbA1c tests during regular checkups both before and after H. pylori eradication. Of these 66 patients, three who had pre-existing diabetes and one patient who received H. pylori eradication after 20 months of the HbA1c test were excluded. The remaining 62 patients were included in the control group. None of the patients included in this study had previously received abdominal RT, surgery of the upper gastrointestinal region, or chemotherapy.
2. Treatments
All patients with H. pylori (+) EMZL and some patients with H. pylori (−) EMZL received H. pylori eradication as the first-line treatment. The 62 patients in the control group showed response without progression after H. pylori eradication; hence, no further treatment was administered. Four patients with sustained EMZL after H. pylori eradication subsequently received RT. Some patients with H. pylori (−) EMZL (n=10) and all patients with FL (n=3) received RT as the first-line treatment.
Simulation computed tomography (CT) for three-dimensional conformal radiation therapy or intensity-modulated radiation therapy was performed in all patients, except one who received two-dimensional RT. The clinical target volume was mostly the entire organ (the stomach or the duodenum) with or without the nearby lymphatic area. Changes in the organ position due to respiration were evaluated using four-dimensional (4D) CT in 15 patients and fluoroscopy in one patient. The margin from the entire organ to planning target volume was 1–2 cm. The median total radiation dose was 30 Gy (range, 24 to 40), with 2 Gy per fraction.
The RT plans of 16 patients who received CT-based RT were restored and the radiation doses delivered to the pancreas were analyzed. Contours of pancreas, newly delineated for this study by experienced radiation oncologists, were the sum of each pancreatic volume on entire respiratory phases. For that, 4D-CT was used in 15 patients and expansion of pancreas volume with estimated margin on 3D-CT, reflecting pancreas movement, was used in one patient.
3. HbA1c
HbA1c tests were used to evaluate the blood glucose level. HbA1c level is an objective and stable parameter that made analysis easy and reliable. Baseline HbA1c levels were measured just before the main treatment. The median time from the baseline HbA1c test to the initiation of the main treatment was 1 month in both groups. Follow-up HbA1c tests were conducted at regular medical checkups scheduled at our institution. During the study period, if the patients were prescribed diabetic medications or steroid-containing drugs or were diagnosed with recurrent lymphoma or other cancers, they were censored.
Continuously high HbA1c levels increase the risk of diabetes, and a difference of 0.5% in the HbA1c level is generally accepted as a significant change [9,16]. Therefore, a diabetes-associated event (DAE) was defined as a ≥ 0.5% increase in HbA1c levels from baseline. A diabetes event (DE) was defined as a HbA1c level of ≥ 6.5%, which is a diagnostic criterion for diabetes [9]. The time to a DAE and DE was defined as the interval taken from the day when the baseline HbA1c test was performed to the day when a DAE or DE occurred, respectively.
4. Other factors
In addition to data on RT and HbA1c levels, we evaluated data on age, sex, body mass index (BMI), and the presence of hypertension (HTN), which are well-known risk factors for diabetes [9]. These factors were analyzed on the day when the baseline HbA1c test was performed. A median age of 55 years was used as a cutoff value for the univariable analysis. Obese patients (BMI ≥ 25 kg/m2) were with non-obese patients. Patients were considered to have HTN if they had a blood pressure of ≥ 140/90 mmHg or were taking antihypertensives.
5. Statistical analysis
Fisher exact test or the Pearson chi-square test was used to compare categorical variables. The Kaplan-Meier curves and log-rank tests were used for survival curve. The Cox proportional hazards regression was performed for the univariable analysis and multivariable analysis and variables with p < 0.20 on univariable analysis were included in the multivariable model. p < 0.05 was considered statistically significant. All analyses were performed using SPSS ver. 25 (IBM Corp., Armonk, NY).
Results
1. Patients
A total of 79 patients (17 patients in the RT group and 62 patients in the control group) were included. The median age was 53 years (range, 28 to 72 years). The median follow-up for HbA1c testing was 47 months (range, 12 to 145 months) in the RT group, and 54 months (range, 11 to 212 months) in the control group. There was no significant difference in age (p=0.51), sex (p=0.74), BMI (p=0.94), presence of HTN (p=0.66), and baseline HbA1c level (p=0.33) between the two groups (Table 1).
2. HbA1c outcomes
The crude rate of DAE was 47.1% (8/17 patients) in the RT group and 16.1% (10/62 patients) in the control group, which showed significant difference (p=0.01). The crude DE rate was 23.5% (4/17 patients) in the RT group and 6.5% (4/62 patients) in the control group, which showed a borderline significant difference (p=0.06) (S1 Fig.). The characteristics of patients with DEs are summarized in S2 Table.
The 5-year DAE rate was significantly higher in the RT group than in the control group (58.0% vs. 14.2%, p < 0.01) (Fig. 1). The RT group had significantly higher risk for DAEs on univariable analysis (hazard ratio [HR], 4.18; 95% confidence interval [CI], 1.64 to 10.66; p < 0.01) and multivariable analysis (HR, 3.68; 95% CI, 1.42 to 9.56; p=0.01) (Table 2).
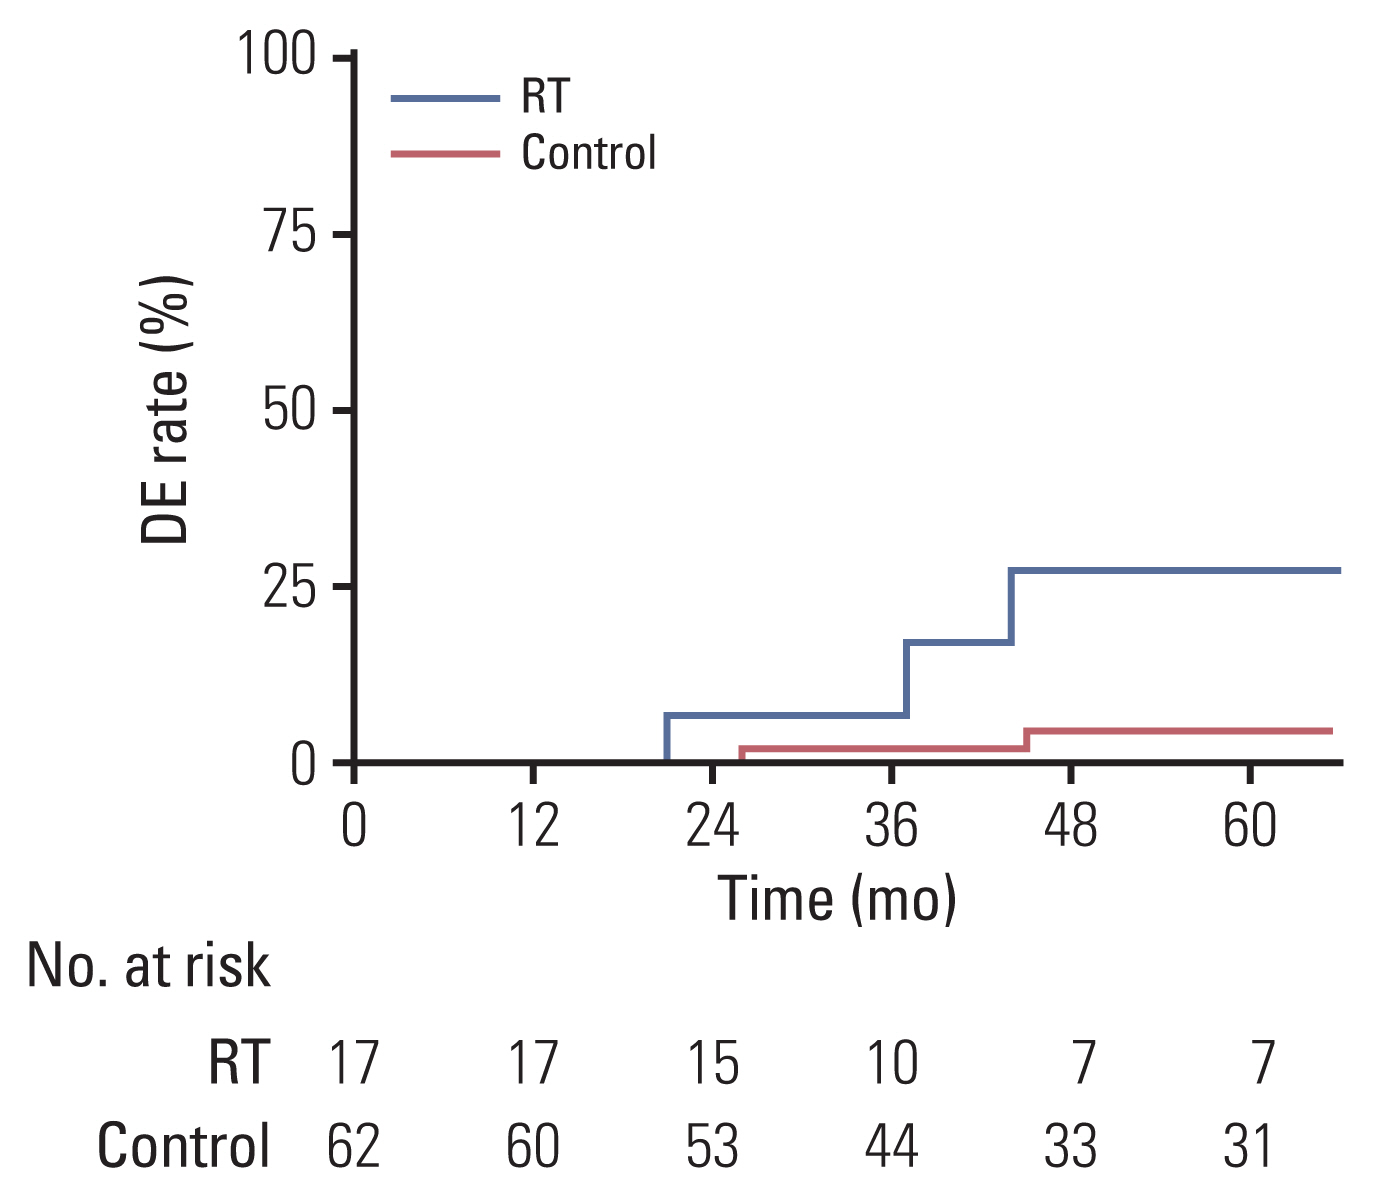
The 5-year DE rate and 27.4% in the RT group and 4.6% in the control group (p=0.02) (Fig. 2). The DE risk was significantly higher in the RT group than in the control group (HR, 4.32; 95% CI, 1.08 to 17.30; p=0.04) and in patients with increased baseline HbA1c levels (HR, 35.83; 95% CI, 2.80 to 459.19; p=0.01). On multivariable analysis, RT significantly increased the risk of DEs (HR, 4.55; 95% CI, 1.08 to 19.19; p=0.04), even after adjusting baseline HbA1c level (HR, 40.97; 95% CI, 3.06 to 548.01; p=0.01) (Table 3).
In the RT group, 12 of 17 patients (70.5%) received a radiation dose of ≤ 30 Gy/15 fractions (40 Gy in one patient, 36 Gy in three patients, 34 Gy in one patient, 30 Gy in nine patients, and 24 Gy in three patients). The median of mean radiation dose to the pancreas was 25.25 Gy (range, 11.44 to 30.85 Gy). There was no significant difference in the DAE or DE rate according to the mean dose to the pancreas or other parameters between the two groups. However, no DAE or DE occurred in the four patients who received a mean radiation dose to the pancreas of < 22 Gy.
3. Oncologic outcome
No local failure occurred in the RT group. However, one patient treated with RT for duodenal EMZL had recurrence on a distant lymph node after 86 months. In the control group, one patient showed improvement, but had residual disease after H. pylori eradication. The patient chose observation with regular follow-ups and the stomach lesion was stable 114 months after H. pylori eradication. In the control group, two patients newly developed skin cancer and ovarian cancer after 81 and 21 months of H. pylori eradication, respectively.
Discussion
For patients with early gastric H. pylori–positive EMZL, the first line of treatment is H. pylori eradication [2,3]. If H. pylori eradication therapy fails, the next treatment is RT. RT is also the standard treatment for patients with early gastroduodenal H. pylori–negative EMZL and duodenal FL [1–3]. In the early stages of indolent lymphoma of the gastroduodenal region, a moderate-dose RT could achieve excellent local control with a 5-year overall survival rate of > 90% [4–8]. However, when delivering RT for gastroduodenal lymphoma, the treatment target is usually the whole stomach or the duodenum. Since it includes a broad margin, pancreatic irradiation is inevitable, although the degree/extent of irradiation may vary [1–3].
The pancreas, which has an endocrine function to regulate the blood glucose levels, has an essential role in the human body. To lower the blood glucose level, pancreatic beta cells secrete insulin. Therefore, decreased beta cell function could lead to diabetes, which in turn increases the risk of complications such as cardiovascular disease and significantly lowers the quality of life [9]. However, in abdominal RT, the pancreas has not traditionally been considered an organ at risk, which generally include the liver, kidneys, and intestines [10].
For young patients, limited studies have evaluated the effect pancreatic irradiation on the risk of diabetes. In the Childhood Cancer Survivor Study analyzing cases of self-reported diabetes from 8,599 survivors and their 2,936 randomly selected siblings, survivors who had received abdominal RT had a significantly increased risk of diabetes compared to their siblings, even after adjusting for BMI (odds ratio, 3.4; 95% CI, 2.3 to 5.0) [11,12]. De Vathaire et al. [11] refined this investigation further by verification and estimation of the pancreas irradiation dose. Patients who received a radiation dose of ≥ 10 Gy to the tail of the pancreas had an increased risk of diabetes compared to those who did not receive RT (relative risk, 11.5; 95% CI, 3.9 to 34.0). Even after adjusting for BMI, the significance of the radiation dose to the pancreas remained unchanged [11,12]. Similary, van Nimwegen et al. [13] analyzed 2,264 Hodgkin lymphoma survivors. Irradiation with ≥ 36 Gy to the para-aortic lymph nodes was significantly associated with a 2.28-fold increased risk of diabetes (95% CI, 1.53 to 3.38). Groot et al. [14] reported that para-aortic radiotherapy significantly increased diabetes risk (HR, 1.66; 95% CI, 1.05 to 2.62) compared to surgery only in 2,998 testicular cancer survivors.
For older patients, a study by Gemici et al. [15] compared the endocrine function between adult gastric cancer patients who received and those who did not receive postoperative chemoradiation (37 and 16 patients, respectively). Patients who received postoperative chemoradiation had significantly decreased c-peptide and insulin levels after 1 year of RT, but there was no significant change in the blood glucose and HbA1c levels in the chemoradiation group and the long-term follow-up results were not reported [15].
HbA1c is glycated hemoglobin, which reflects the average blood glucose level over the previous 8–12 weeks. There is a strong, continuous association between high HbA1c levels and development of diabetes, and diabetes can be diagnosed if the HbA1c levels are ≥ 6.5% on ≥ 2 samples [9,16]. It has several advantages over other diagnostic tools, including improved convenience (fasting not required), greater pre-analytical stability, and less day-to-day perturbation during times of stress, diet, or illness. Because of the stability and simplicity, HbA1c is currently widely used for the screening, diagnosis, and management of diabetes. Hence, we chose HbA1c as a parameter to evaluate the effect of pancreatic irradiation on the risk of diabetes in adult patients.
In our study, we evaluated the association of RT and diabetes risk in 79 gastroduodenal indolent lymphoma patients who participated in our institution’s regular medical checkup programs which routinely tested HbA1c levels. The DAE risk was significantly increased 3.68 times in the RT group than in the control group (95% CI, 1.42 to 9.56), implying that RT accelerates the natural increase in HbA1c levels. Further, the DE rate was significantly increased 4.55 times by RT (95% CI, 1.08 to 19.19), even though increased baseline HbA1c level was associated with a 40.97 increase in the risk of DE rate (95% CI, 3.06 to 548.01). In conclusion, diabetes risk was significantly increased in the RT group. Therefore, in patients with early-stage gastroduodenal indolent lymphoma, who have excellent oncologic outcome prospects, risk of diabetes should be considered in planning treatment and during follow-up after RT.
To decrease the radiation dose to the pancreas and probably the risk of diabetes, more advanced RT techniques, such as gating or breath-hold method with decreased margin and proton therapy with no exit dose, could be used [17–20]. The current RT guidelines for patients with gastric EMZL recommend a radiation dose of either 24 or 30 Gy with conventional fractionation. However, to decrease the radiation dose to the pancreas, 24 Gy should preferably be used because excellent local control can be achieved with both radiation doses [1–4,6,8]. Furthermore, because an effective response for indolent lymphoma has been reported after only 4 Gy in 2 fractions, a more adequate regimen between 4 Gy and 24 Gy could be explored [21–25].
This study has some limitations. This was a retrospective study conducted at a single institution with a small number of patients. Further, we could not identify the radiation dose-volume predictors for increased risk of diabetes probably because of the small sample size. Despite these limitations, this study had advantages to previous studies. This is the first study which evaluated the risk of diabetes after RT in gastroduodenal lymphoma patients, not young patients. The radiation field confined to stomach and duodenum was much smaller than para-aortic irradiation and surgery or chemotherapy was not used, so the effect of pancreatic irradiation could be evaluated better. This study firstly showed the increased risk of diabetes with objective test results. A larger prospective study is needed to confirm the study findings. In the future, we will conduct a prospective single-arm cohort study including gastroduodenal indolent lymphoma patients treated with respiratory-gated RT with 24 Gy of radiation.
In conclusion, we identified an increased risk of diabetes after RT in patients with stage I gastroduodenal EMZL or FL. Therefore, the pancreas should be considered during RT to decrease the risk of radiation-induced late complications.