Introduction
Nasopharyngeal carcinoma (NPC) is one of the most prevalent malignancies in Southern China and Southeast Asia, with approximately 20–30 new cases reported per 100,000 per year [1,2]. Concurrent chemoradiotherapy with or without adjuvant chemotherapy is considered the standard modality. In addition to intensity-modulated radiation therapy (IMRT), early-stage NPC has now reached a high rate of curability. However, the survival of patients with locoregionally advanced NPC remains unsatisfactory [3]. Therefore, the identification of new prognostic factors is of great importance for the recognition of high-risk patients.
Numerous efforts have been made in recent years to identify tumor-related prognostic factors and the relationship between clinical stages of NPC in patients. Several studies have reported that the most significant factor is the pretreatment plasma Epstein-Barr virus (EBV) DNA level. High levels of EBV DNA are closely associated with NPC risk classification and prognosis [4–7]. Studies have also reported an association between serum viral capsid antigen–immunoglobulin A (VCA-IgA) and early-antigen–IgA (EA-IgA) titers and TNM classification in NPC: high serum titers were closely associated with advanced TNM classifications [8–10]. However, while serum IgA antibodies against EA-IgA and VCA-IgA may not be prognostic biomarkers in patients with NPC and undetectable plasma EBV (pEBV) DNA levels [11], the prognostic values of IgG antibodies against replication and transcription activator (Rta-IgG), IgA antibodies against Epstein-Barr nuclear antigen 1 (EBNA1-IgA), and BamH1 Z transactivator (Zta-IgA) are less clear. Most of these findings were based on previous versions of the International Union for Cancer/American Joint Committee on Cancer (UICC/AJCC) staging system for NPC, and these associations have not yet been systematically defined in accordance with the new eighth edition of the UICC/AJCC staging system for NPC. Therefore, we conducted a retrospective study in patients with locoregionally advanced NPC to determine the prognostic value of Rta-IgG, EBNA1-IgA, and Zta-IgA and their correlations with the TNM classifications according to the eighth edition of the UICC/AJCC staging system.
Materials and Methods
1. Patient selection
A total of 435 patients from the Sun Yat-sen University Cancer Center (SYSUCC) were enrolled in this study between November 2014 and October 2015. The eligibility criteria were as follows: (1) histologically confirmed NPC; (2) locoregionally advanced NPC with no evidence of distant metastases; (3) treated with radiotherapy with curative intent; and (4) absence of secondary malignancy or pregnancy.
All patients underwent a complete pretreatment evaluation, including complete medical history, complete blood sampling (cell counts, biochemical profile, and EBV serology), fiber-optic endoscopy, pathologic biopsy, magnetic resonance imaging (MRI) of the neck and nasopharynx, chest radiography, abdominal ultrasonography, and bone scan or positron emission tomography/computed tomography scans. All medical records and imaging results were retrospectively analyzed, and all patients were restaged according to the eighth edition of the AJCC staging system.
2. Treatment strategies
All patients received IMRT as the primary treatment. The gross tumor volume (GTV), including the nasopharynx GTV (GTVnx) and positive neck lymph nodes GTV (GTVnd), was delineated based on clinical, endoscopic, and MRI findings. The cumulative radiation doses were 68–72 Gy to the GTVnx and 66–70 Gy to the involved neck area (GTVnd). All patients were treated following a routine schedule (one fraction daily, 5 days per week). Other details of the IMRT plan were consistent with the principles described in previous studies [12,13]. During the study period, we followed our institutional guidelines, which recommended concurrent chemoradiotherapy±neoadjuvant/adjuvant chemotherapy for locoregionally advanced NPC. Neoadjuvant chemotherapy was given when tumors were bulky, or when the waiting time for radiotherapy was too long. The neoadjuvant or adjuvant chemotherapy was mostly cisplatin (80 mg/m2) with 5-fluorouracil (800 mg/m2/day over 120 hours), or cisplatin (80 mg/m2) with taxanes (80 mg/m2) administered at 3-week intervals for 2–3 cycles. Cisplatin-based concurrent chemoradiotherapy was the most common treatment method, which included cisplatin 80–100 mg/m2 every 3 weeks for 2–3 cycles. Patients who had severe toxic effects during neoadjuvant chemotherapy were given radiotherapy alone in the follow-up treatment. And patients who were not suitable for chemotherapy, including those who were too old or had underlying diseases, were given radiotherapy alone.
3. Serologic tests for EBV antibodies and EBV DNA
The Rta-IgG, EBNA1-IgA, and Zta-IgA antibody levels were measured using commercial enzyme-linked immunosorbent assay (ELISA) kits by the same technicians in the same laboratory of the SYSUCC [14,15]. The EBNA1-IgA and Zta-IgA levels were assessed according to the ELISA OD values according to the manufacturers’ instructions (Shanghai Jining Shiye Co., Ltd., Shanghai, China; Zhongshan Biotechnology Co., Ltd., Zhongshan, China). The Rta-IgG level was also assessed according to the manufacturer’s instructions (TARCINE, Beijing, China). Patient pEBV DNA levels were measured using a real-time QPCR technique based on a proven system at the Department of Molecular Diagnosis, SYSUCC, as described previously [9].
4. Follow-up
The follow-up duration of our patients was calculated from the first day of therapy to the last day of death or checkup. The patients were regularly checked once every 3 months in the first year and once every 3–6 months or annually during the subsequent years according to the results of the last checkup. The primary endpoint was progression-free survival (PFS), while the secondary endpoints included overall survival (OS), distant metastasis–free survival (DMFS), and local recurrence–free survival (LRFS).
5. Statistical analyses
IBM SPSS Statistics for Windows, ver. 25.0 (IBM Corp., Armonk, NY) was used for data analysis. Receiver operating characteristic (ROC) curves were used to evaluate different cutoff points for the EBV antibodies. The area under the ROC curve (AUC) was used to assess the prognostic value of each serum EBV antibody. The relationships between Epstein–Barr virus antibody levels and clinicopathological characteristics were evaluated using Pearson’s chi-square or Fisher exact tests, as indicated. The correlations between EBV biomarkers and the eighth AJCC staging system were estimated using Spearman correlation analysis. Kaplan-Meier methods were used to analyze survival outcomes, while log-rank tests were used to compare the differences between survival curves. Univariate and multivariate analyses employed the Cox proportional hazards model to determine significant prognostic factors. All statistical tests were two-sided, and p-values < 0.05 were considered significant.
Results
1. Patients and clinicopathological features
The median follow-up duration was 53 months (range, 1 to 69 months). By the last follow-up examination, 19.5% (n=85) of the patients had experienced disease progression, 8.5% (n=37) had died, and 9.7% and 6.9% had developed distant metastases and local-regional recurrence, respectively. The clinicopathological characteristics of the 435 patients, including 309 (71%) men and 126 (29%) women, are presented in Table 1. The median age at diagnosis was 49 years (range, 7 to 80 years). Based on the World Health Organization (WHO) criteria, 97.7% and 2.3% of patients had type III and II disease, respectively. The TNM stage distribution based on the eighth edition of the AJCC staging system included stage III (252 patients, 57.9%) and IVA (183 patients, 42.1%). A total of 408 patients received chemotherapy. Of these, 48.3% (197/408) received neoadjuvant+concurrent chemotherapy and 42.2% (172/408) received concurrent chemotherapy.
2. Correlations between EBV antibody levels and clinicopathological characteristics
ROC curves were used to evaluate different cutoff points for EBV antibody levels. The optimal PFS cutoffs for Rta-IgG, Zta-IgA, and EBNA1-IgA were 29.07 U/mL (sensitivity, 0.75; specificity, 0.332; AUC, 0.491), 1.19 signal-to-cutoff (S/CO) (sensitivity, 0.852; specificity, 0.386; AUC, 0.609), and 1.84 S/CO (sensitivity, 0.556; specificity, 0.602; AUC, 0.557), respectively. Examination of the correlations between these antibody levels and various clinicopathological features revealed that patients with high EBV-DNA levels (> 1,500 copies/mL) were more likely to have high Rta-IgG (> 29.07 U/mL) and high Zta-IgA levels (> 1.19 S/CO) (all p < 0.05) (Table 2). Patients aged ≥ 50 years were more likely to have high Rta-IgG levels, while patients with a history of smoking were more likely to have high Zta-IgA levels. However, there was no significant difference in sex or histology between patients with high and low EBV antibody levels (all p > 0.05).
3. Correlations between EBV biomarker levels and the eighth edition of the AJCC staging system
The relationships between high EBV antibody levels and T staging were not statistically significant (all p > 0.05). Patients with advanced N category (N2/3) and clinical stage IVA were more likely to have high Rta-IgG levels (> 29.07 U/mL, all p < 0.05) (Table 3). The Spearman rank correlation coefficients for advanced N category and clinical stage IVA were 0.129 (p=0.007) and 0.324 (p=0.035), respectively. High Zta-IgA levels were more likely to occur among patients with advanced N category (N2/3) and clinical stage IVA (all p < 0.05; Spearman rank correlation coefficients 0.148 [p=0.002] and 0.120 [p=0.013], respectively). The EBV-DNA level was more likely to be high with increasing N and clinical staging (Spearman correlation coefficients 0.211 [p < 0.001] and 0.22 [p < 0.001], respectively).
4. Correlations between EBV biomarkers and EBV DNA levels
We did not observe a statistically significant relationship between EBNA1-IgA and EBV DNA levels (p=0.282). Patients with high EBV-DNA levels were more likely to have high Rta-IgG (correlation coefficient, 0.126; p=0.008) and Zta-IgA levels (correlation coefficient, 0.125; p=0.009).
5. Prognostic value of EBV antibody levels in patients with NPC
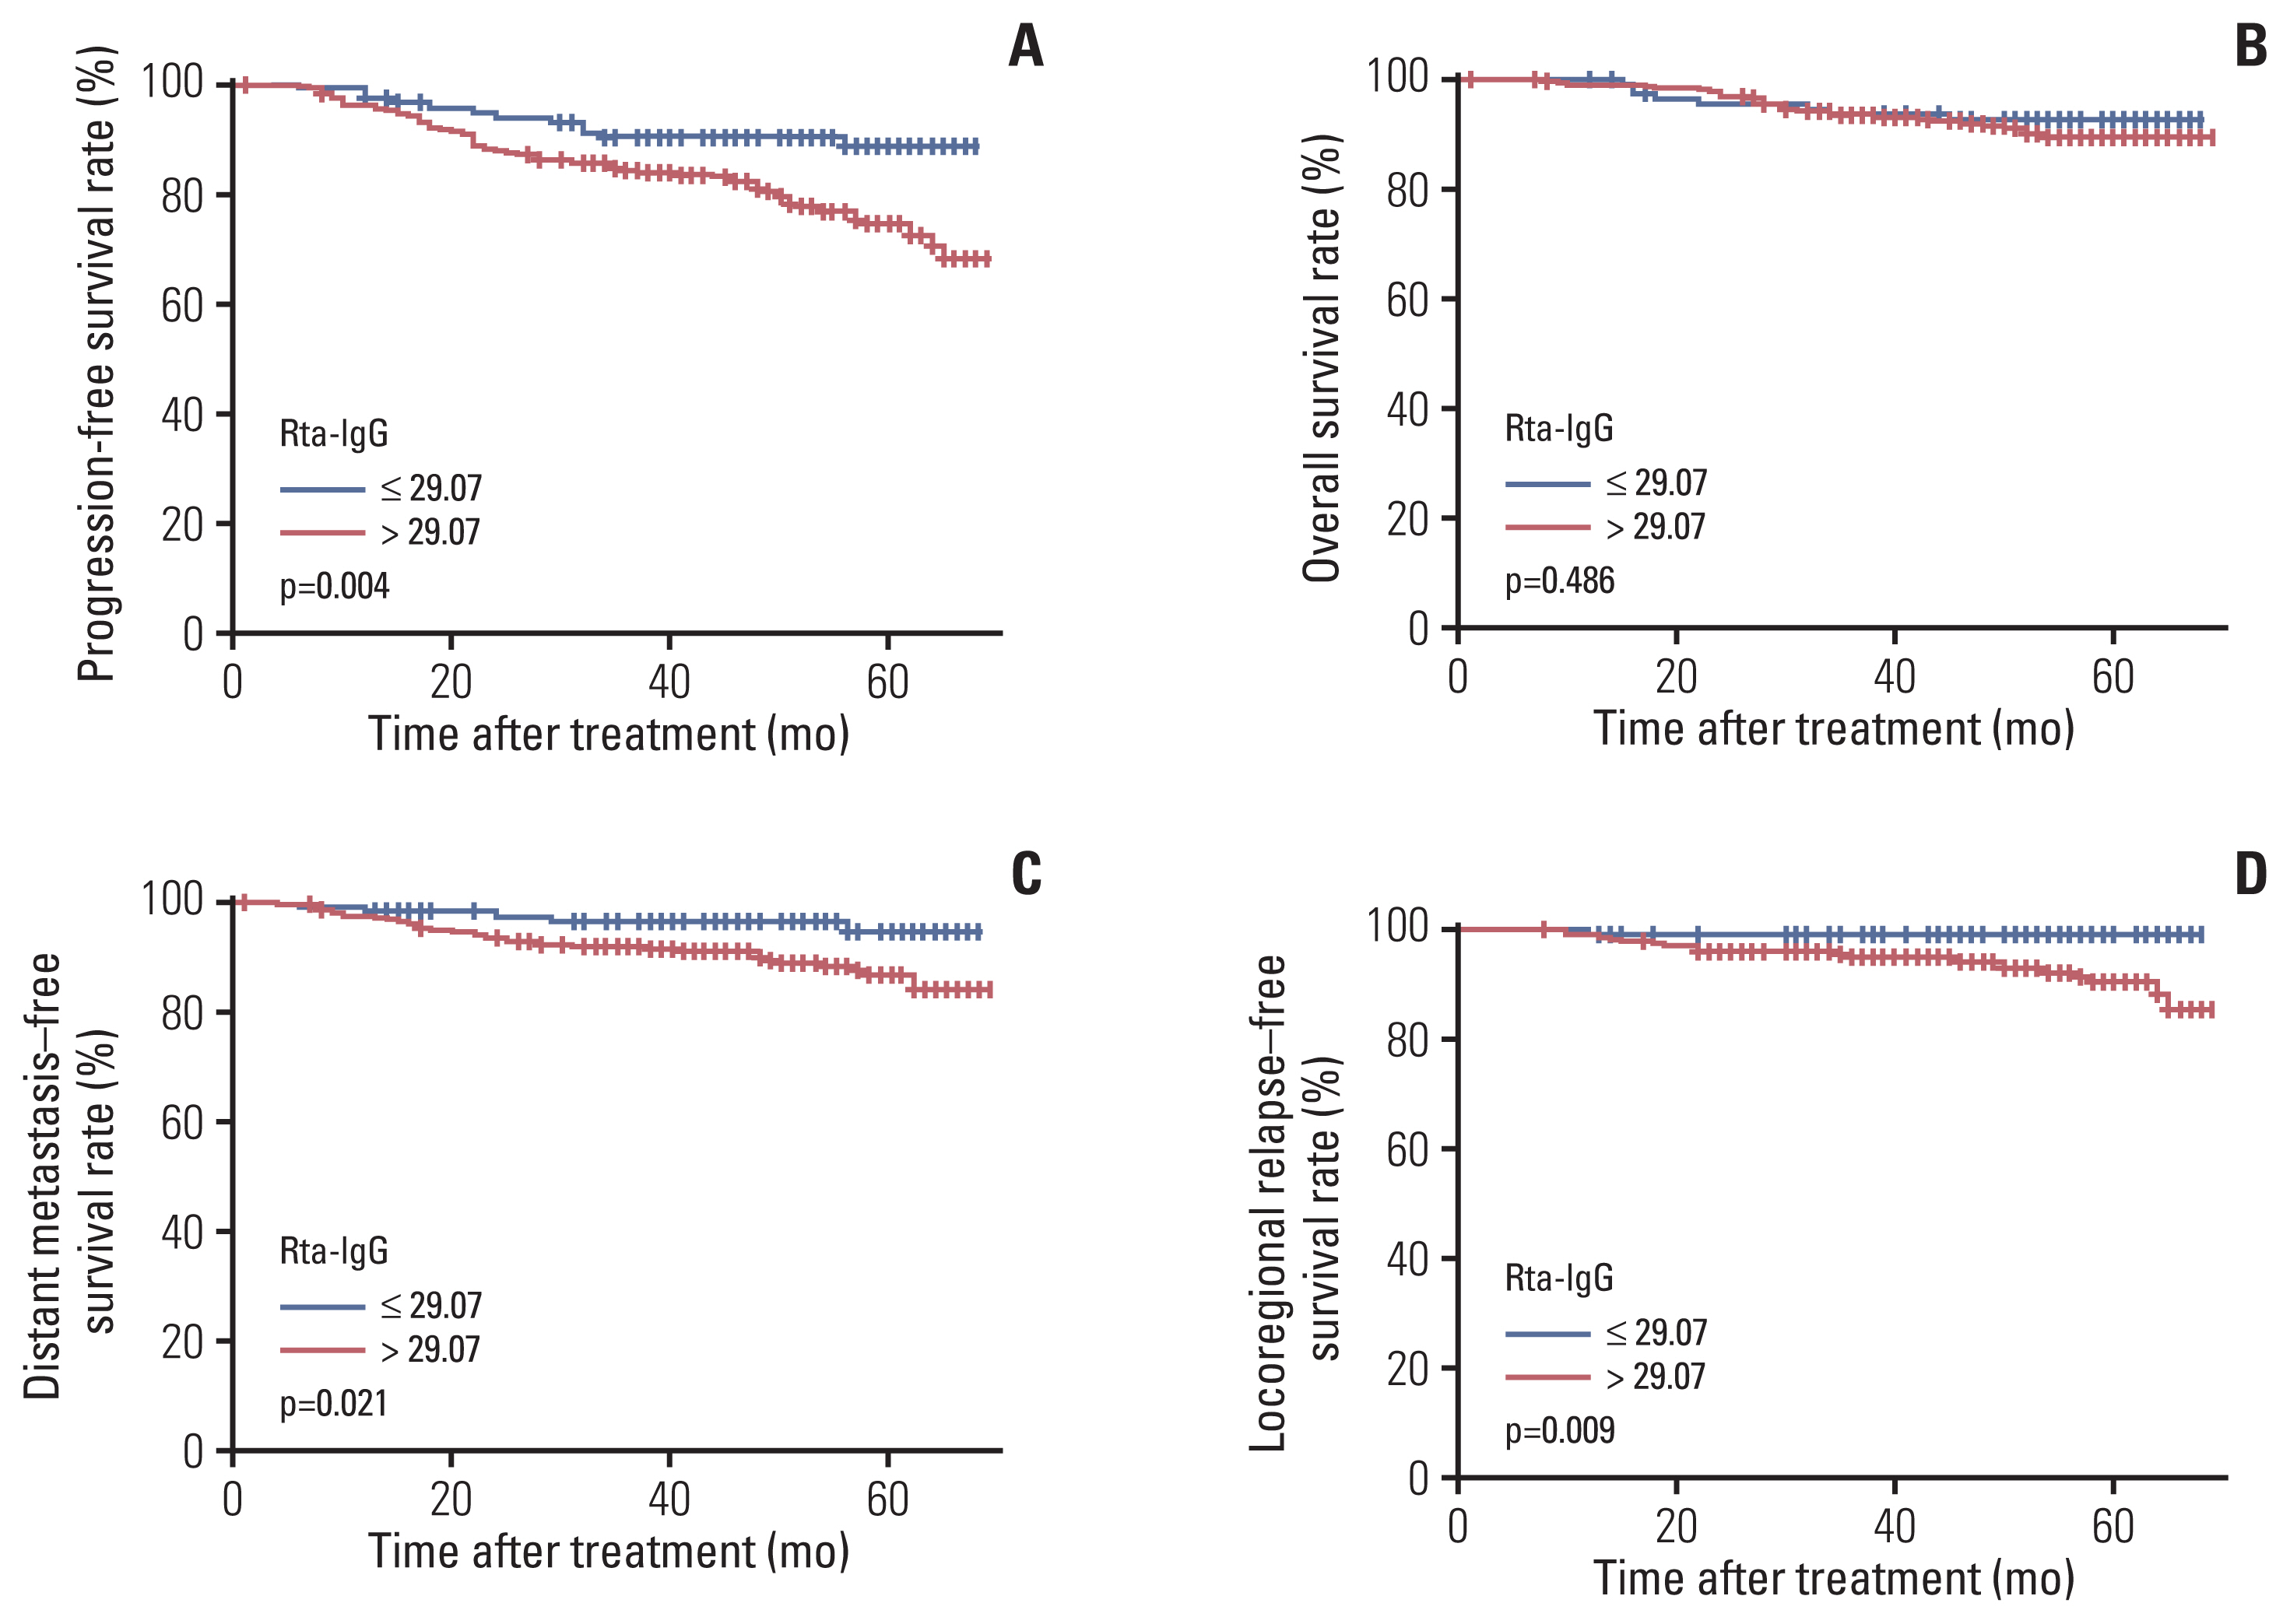
The results of univariable analyses are shown in Table 4. In log-rank tests, high Zta-IgA levels were not associated with inferior PFS (hazard ratio [HR], 1.213; 95% confidence interval [CI], 0.741 to 1.986; p=0.443), OS (HR, 0.904; 95% CI, 0.447 to 1.830; p=0.780), DMFS (HR, 1.442; 95% CI, 0.690 to 3.013; p=0.331), and LRFS (HR, 1.616; 95% CI, 0.660 to 3.955; p=0.293). Likewise, we did not observe any difference in survival between patients with high EBNA1-IgA and low EBNA1-IgA levels regarding PFS (HR, 1.509; 95% CI, 0.914 to 2.491; p=0.108), OS (HR, 0.933; 95% CI, 0.469 to 1.858; p=0.844), DMFS (HR, 1.468; 95% CI, 0.722 to 2.987; p=0.289), and LRFS (HR, 2.272; 95% CI, 0.869 to 5.937; p=0.094). However, patients with high Rta-IgG levels had a significantly inferior prognosis in terms of PFS (77% vs. 89.8%, p=0.004), DMFS (88.3% vs. 95.8%, p=0.021), and LRFS (91.2% vs. 98.3%, p=0.009) than that in patients with low Rta-IgG level (Fig. 1). Thus, the Rta-IgG level may be a better predictor than levels of the other two EBV anti-bodies for patients with locoregionally advanced disease.
We also found that patients with high levels of all three antibodies had a significantly inferior prognosis in terms of PFS (75.9% vs. 84.2%, p=0.026) and LRFS (89.2% vs. 96.3%, p=0.003) compared to the other patients.
The combination of EBV DNA and Rta-IgG levels improved prognostic stratification.
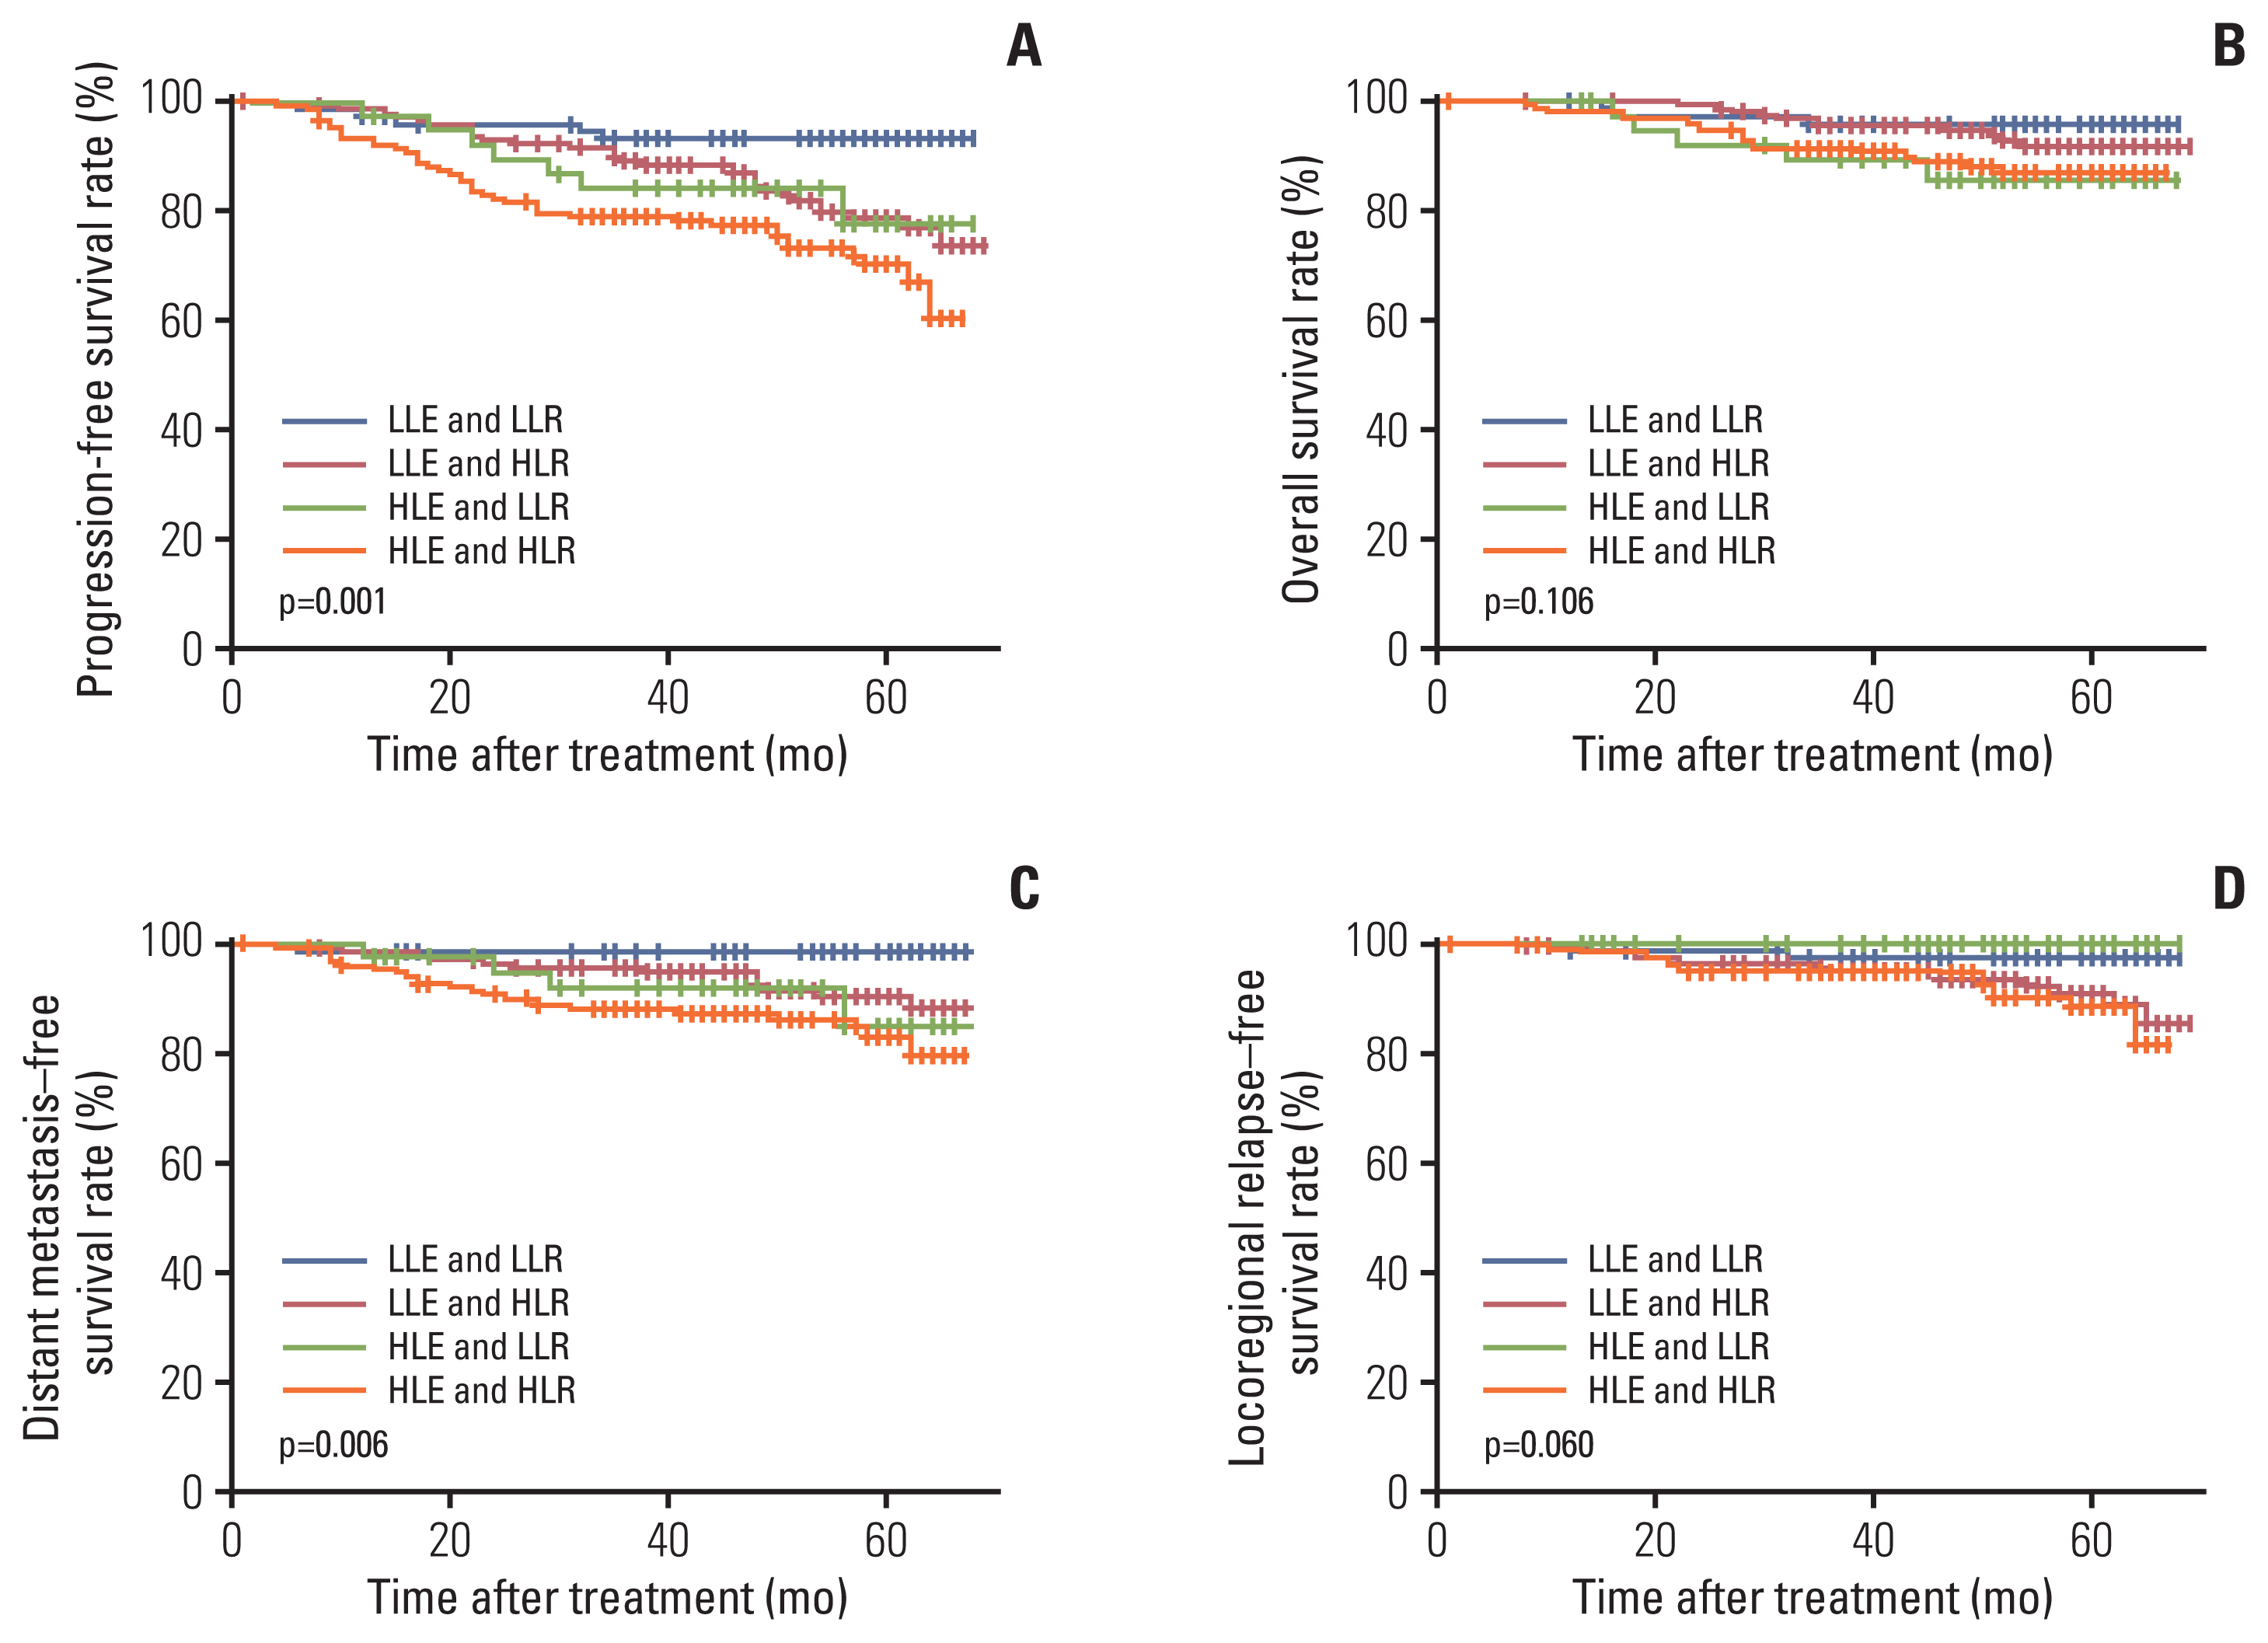
The aforementioned analysis showed that the EBV DNA level is an independent prognostic factor for PFS and DMFS (Table 5). The Rta-IgG level was an independent prognostic factor for PFS and LRFS. Therefore, we stratified the entire population into four groups using the two prognostic factors of pretreatment EBV DNA level and Rta-IgG level: low-level EBV DNA and low-level Rta-IgG group (LLE and LLR), low-level EBV DNA and high-level Rta-IgG (LLE and HLR), high-level EBV DNA and low-level Rta-IgG group (HLE and LLR), and high-level EBV DNA and high-level Rta-IgG (HLE and HLR). Among these patients, the proportions of LLE and LLR, LLE and HLR, HLE and LLR, and HLE and HLR were 17.7% (77 of 435), 37.2% (162 of 435), 9.4% (41 of 435), and 35.6% (155 of 435), respectively. In the low-level EBV DNA group,patients with high-level Rta-IgG had a significantly inferior prognosis in terms of PFS (80.9% vs. 93.5%, p=0.013) (Fig. 2A) and DMFS (91.4% vs. 98.7%, p=0.028) (Fig. 2C) than patients with low Rta-IgG. In the high-level EBV DNA group, there was no significant difference in survival between patients with high Rta-IgG and low Rta-IgG in terms of PFS (72.9% vs. 82.9%, p=0.244), OS (88.4% vs. 87.8%, p=0.792), DMFS (85.2% vs. 90.2%, p=0.483), or LRFS (91% vs. 100%, p=0.063). As shown in Fig. 2, the HLE and HLR group had the poorest survival outcomes, while the LLE and LLR group had the best survival outcomes. Compared with the LLE and LLR group, the HLE and HLR group had poor PFS (72.9% vs. 93.5%, p < 0.001), DMFS (85.2% vs. 98.7%, p=0.001), and LRFS (91% vs. 97.4%; p=0.038). The HLE and HLR groups also had worse PFS (72.9% vs. 80.9%, p=0.028) and DMFS (85.2% vs. 91.4%, p=0.049) than the LLE and HLR groups.
6. Prognostic value of Rta-IgG in NPC patients with early or advanced T/N category
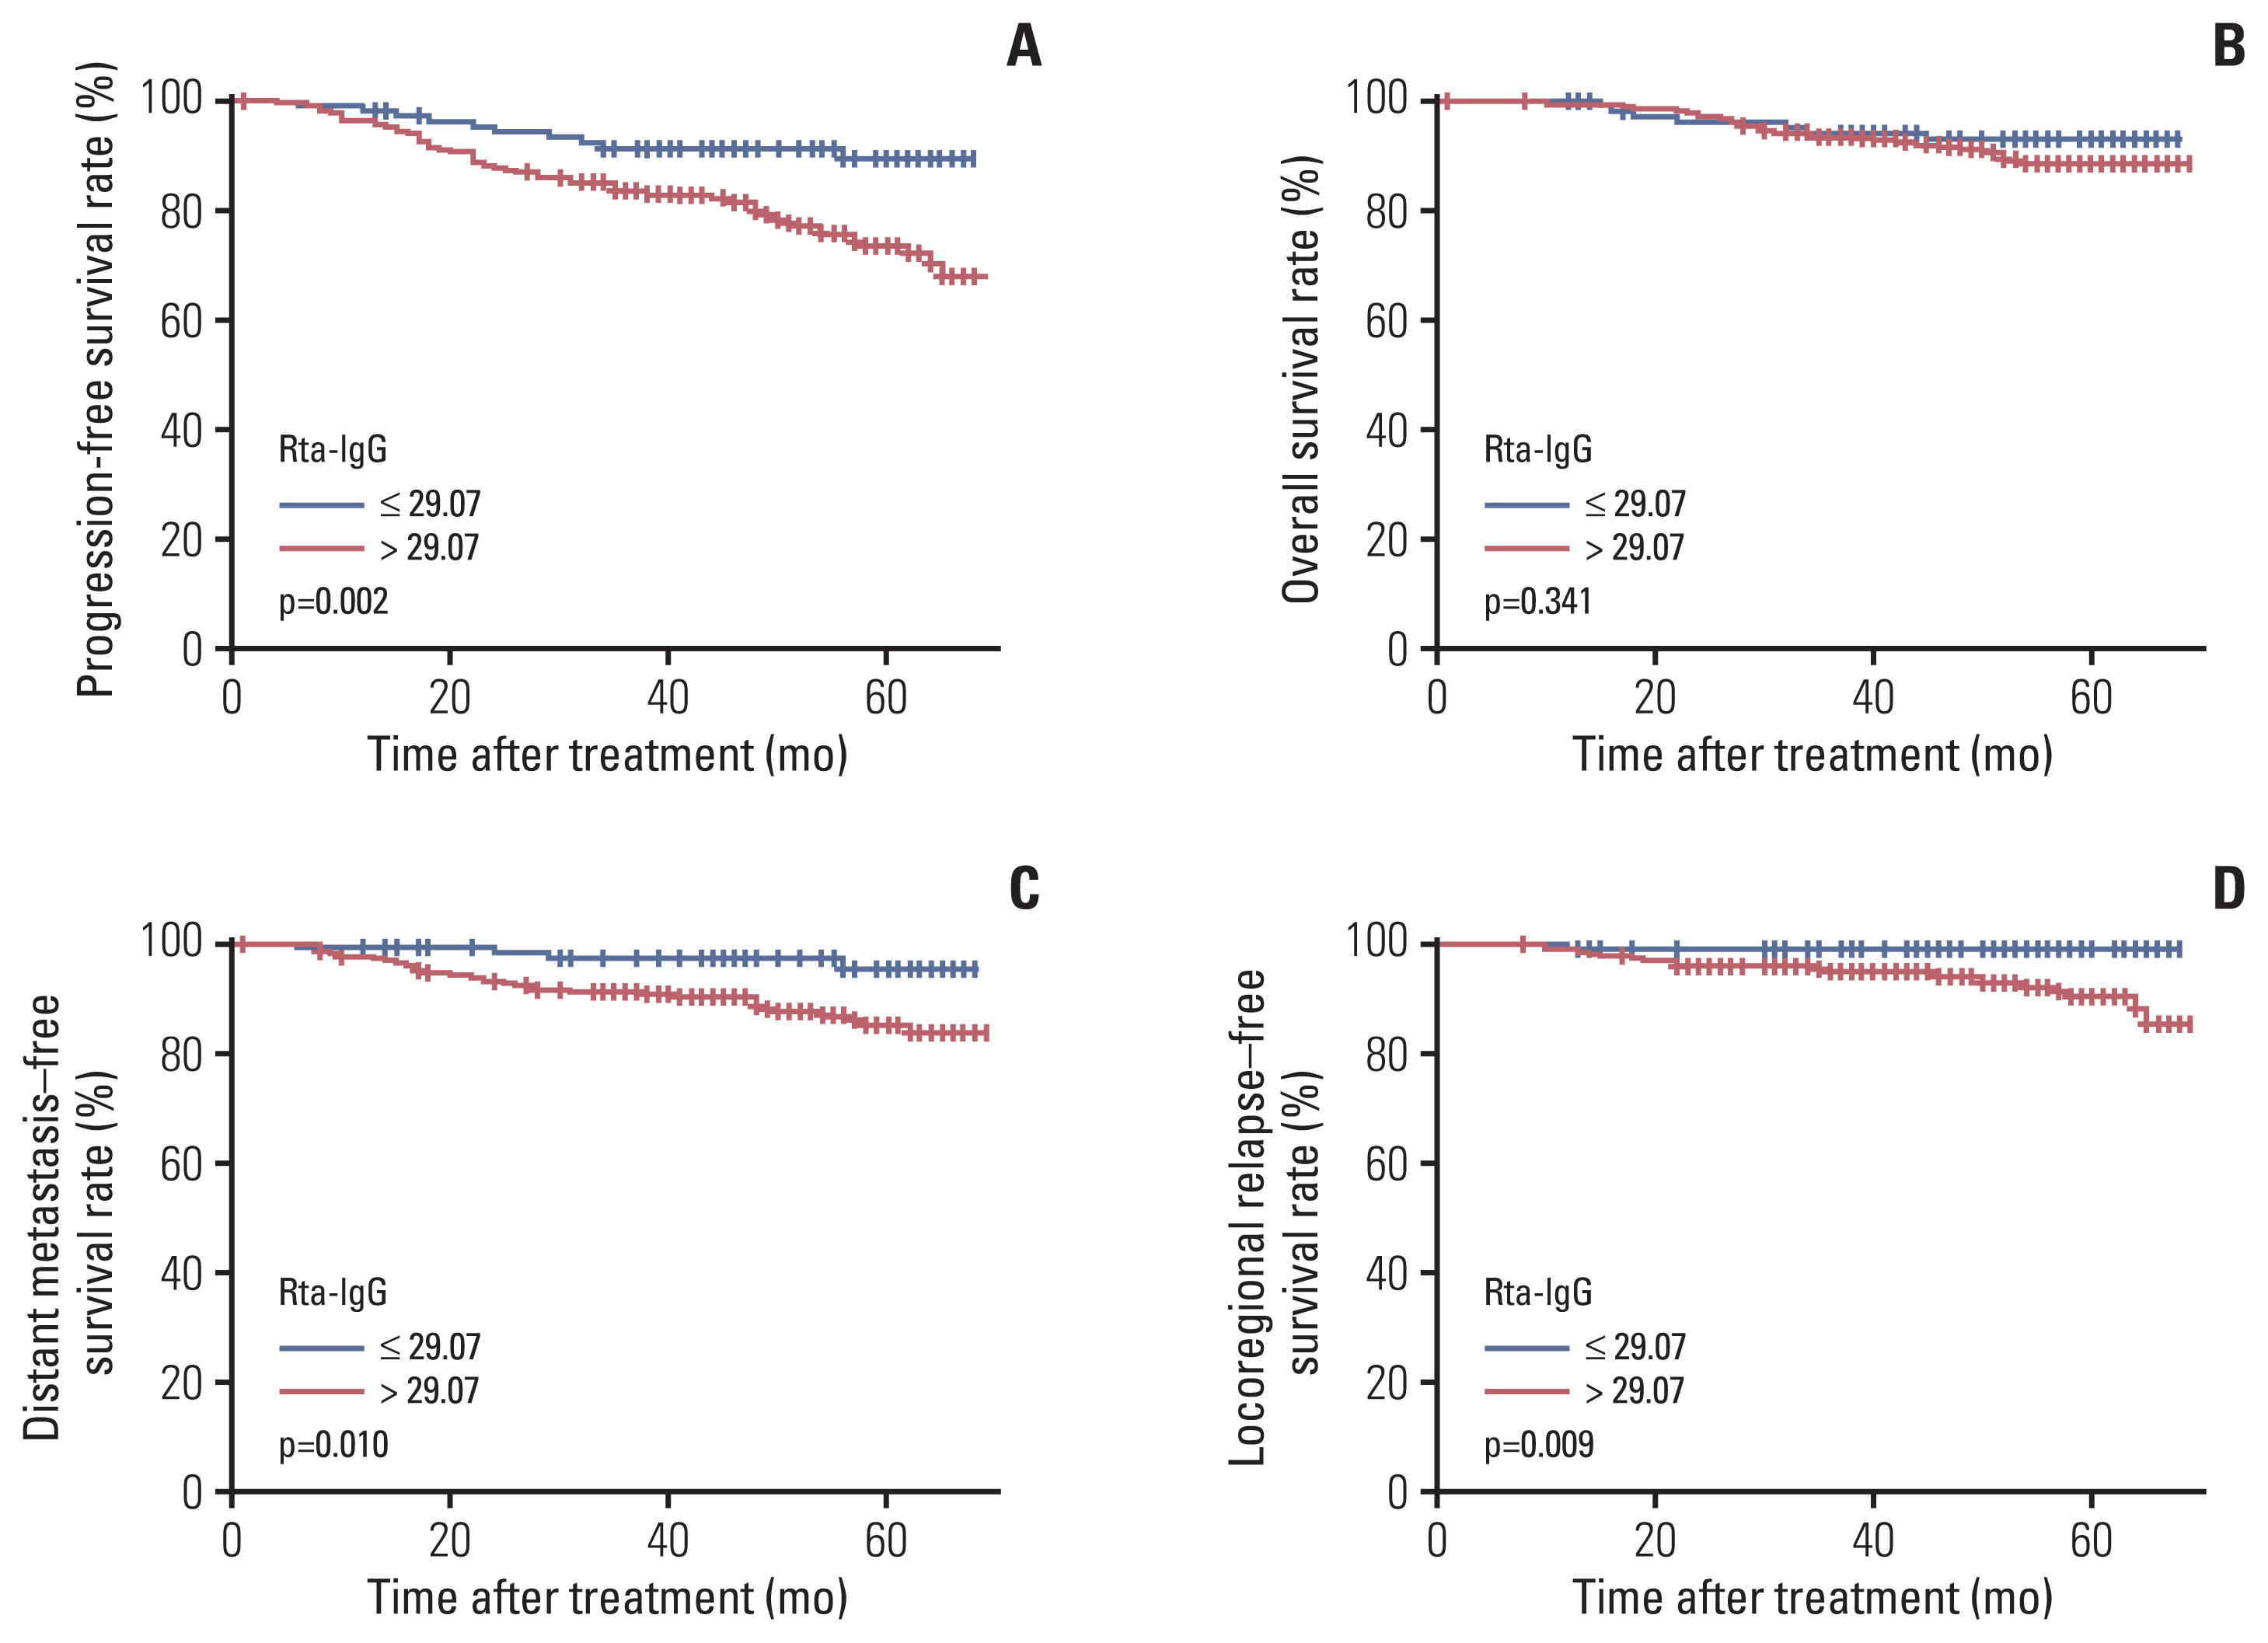
We further analyzed the prognostic value of Rta-IgG in the subgroups of NPC patients with early and advanced T categories. In the advanced T category (T3–4) subgroup, we observed a significant difference in survival between patients with high and low Rta-IgG levels in terms of PFS (75.9% vs. 90.7%, p=0.002), DMFS (87% vs. 96.3%, p=0.010), and LRFS (91.9% vs. 99.1%, p=0.009) (Fig. 3). There was no significant difference in survival between patients with high Rta-IgG and low Rta-IgG in terms of PFS (83% vs. 80%, p=0.046), OS (95.7% vs. 90%, p=0.473), DMFS (95.7% vs. 90%; p=0.934), or LRFS (87.2% vs. 90%, p=0.506) among patients with early T category (T1–2).
In the early N category (N0–1) subgroup, there was a significant difference in survival between patients with high Rta-IgG and low Rta-IgG in terms of PFS (77.1% vs. 95.7%, p=0.010) and LRFS (90.6% vs. 100%, p=0.038) (Fig. 4). However, Rta-IgG level was not associated with PFS (76.9% vs. 85.9%, p=0.087), OS (89.6% vs. 90.1%, p=0.939), DMFS (87.8% vs. 94.4%, p=0.105), or LRFS (91.4% vs. 97.2%, p=0.077) among patients with advanced N category (N2–3).
7. Prognostic value of Rta-IgG in NPC patients with advanced T category and low EBV DNA levels
We screened the group of patients with both advanced T category and low EBV DNA level (a total of 208 patients). In this subgroup, patients with high-level Rta-IgG had a significantly inferior prognosis in terms of PFS (78.4% vs. 94.2%, p=0.006), DMFS (90.6% vs. 98.6%, p=0.038), and LRFS (90.6% vs. 98.6%, p=0.036) than patients with low Rta-IgG.
8. Prognostic value of Rta-IgG in NPC patients with early N category and low EBV DNA levels
We also screened the group of patients with both early N category and low EBV DNA level (a total of 100 patients). In this subgroup, we observed a significant difference in survival between patients with high and low Rta-IgG levels in terms of PFS (73.8% vs. 97.1%, p=0.006) and LRFS (87.7% vs. 100%, p=0.034) (Fig. 5).
9. Prognostic value of Rta-IgG in NPC patients with advanced T category, early N category, and low EBV DNA levels
In this subgroup (a total of 100 patients), there was a significant difference in survival between patients with high Rta-IgG and low Rta-IgG in terms of PFS (73.8% vs. 97.1%, p=0.006) and LRFS (87.7% vs. 100%, p=0.034).
Discussion
The results of previous studies showed that the prognostic value of EBV antibodies in patients with NPC is far from clearly defined. In endemic areas, previous studies [11,16–18] mainly focused on the impact of EA-IgA and VCA-IgA in NPC. To our knowledge, our study is the first large-scale study to determine the impact of Rta-IgG, EBNA1-IgA, and Zta-IgA levels on the prognosis of patients with locoregionally advanced NPC. Since the seventh edition of the AJCC/UICC staging system for NPC was published in 2009, several studies have demonstrated the relationship between EBV antibodies and the staging system [8,10,19]. This retrospective review of 435 patients with locoregionally advanced NPC is the first to explore the correlations between the levels of serological biomarkers of EBV and the TNM classifications of the eighth edition of the UICC/AJCC staging system. Our results showed that serological biomarkers of EBV can be used as independent indicators of disease stage and survival outcome in patients with locoregionally advanced NPC.
1. Significance of studying EBV antibodies
The detection of pEBV DNA in NPC has created new possibilities for the early detection of tumor progression [20–22]. EBV-encoded RNA signals are present in all NPC cells and induce lytic infection by triggering capillary expansion, altered protein localization, gene activation, DNA damage responses, and mutations during viral replication [23,24]. NPC progression may induce EBV to enter the replication phase and express EBV antibodies. Therefore, the titers of antibodies against EBV may represent the level of EBV replication. The serum EBV antibody level in patients with NPC also reflects the tumor burden. Therefore, the measurement of serum EBV antibody levels in patients with NPC contributes to the early diagnosis of the disease and provides reliable indexes for clinical TNM staging [25,26]. However, the role of serum Rta-IgG, EBNA1-IgA, and Zta-IgA in the disease evaluation of NPC is not commonly discussed.
2. Correlation between EBV antibody levels and clinicopathological characteristics
A positive association has been reported between EBV antibody (VCA-IgA and EA-IgA) levels and histological subtype [8]. However, we failed to detect this association, which may be due to the lower proportion of WHO II (2.3%) or the relatively small sample size (435 patients). Previous studies reported that patients aged > 50 years at initial diagnosis were more likely to show high EBV antibody titers [11]. We also observed high Rta-IgG levels in patients aged > 50 years. This may be due to the potentially longer exposure time to EBV in these older patients. We also observed a positive relationship between smoking and serum Zta-IgA level, consistent with that reported by He et al. [27]. This finding suggests that smoking might indirectly contribute to NPC risk by synergistically elevating anti-IgA levels [27]. We also observed that Rta-IgG and Zta-IgA levels were positively related to EBV DNA levels. The relatively small sample size may explain the negative result for the association with EBNA1-IgA levels.
3. Correlation between EBV antibodies and clinical TNM staging
The associations between serum EBV antibodies and clinical TNM staging have been reported previously, in which pretreatment serum VCA-IgA and EA-IgA titers increased with disease stage in the AJCC staging system, seventh edition [8,26]. The results of the present study showed that Rta-IgG, Zta-IgA, and EBV-DNA levels were related to N and clinical stages (eighth edition of the AJCC staging system) in NPC, with increasing titers associated with increasing stage. Rta is one of the most important activators that regulate the switch from latency to the lytic cycle [28]. The expression of Zta-IgA indicates that EBV is activated to enter the lytic infection phase. As the range of lymph node metastasis increases, the antibody level also increases [28,29]. No significant differences in the serum level of Rta-IgG were observed among T category classifications of NPC, contrary to the findings reported by Xu et al. [28].
4. Predictive validity of serum EBV antibodies
Our findings demonstrated that a high Rta-IgG level may be a risk factor for survival. High Rta-IgG level was significantly associated with inferior PFS, DMFS, and LRFS in log-rank tests, and was also significantly associated with inferior PFS and LRFS in multivariable analyses. Because of the predictive validity of pEBV DNA, we also stratified the entire population into four groups using the two prognostic factors of pretreatment EBV DNA and Rta-IgG levels. We found that patients with high levels of EBV DNA (> 1,500 copies/mL) and Rta-IgG (> 29.07 U/mL) had the poorest survival outcomes, while those with low levels of EBV DNA (≤ 1,500 copies/mL) and Rta-IgG (≤ 29.07 U/mL) had the best survival outcomes. Among patients with low EBV DNA levels, those with high Rta-IgG levels had a significantly inferior prognosis in terms of PFS and DMFS compared to patients with low Rta-IgG levels. However, among patients with high EBV DNA levels, we did not observe significant differences between those with high and low Rta-IgG levels. This result may be due to the poor prognosis of patients with high EBV DNA levels overall. Combined stratification was an independent and negative factor for PFS and DMFS. Thus, the combination of factors improved the prognostic ability.
In this study, we measured serum EBV antibody levels in 435 stage III-IVA NPC patients. Summarizing the eighth AJCC staging system, stage III includes T3anyN and TanyN2, while stage IVA dose T4anyN and TanyN3. So all patients with N0–1 categories should have had T3–4 categories, while those with N2–3 categories may have any-T categories. In other words, the patients with early N category may have had advanced T categories more frequently than those with advanced N categories. Subgroup analyses revealed a significant difference in survival between patients with high and low Rta-IgG levels in terms of PFS, DMFS, and LRFS in patients with advanced T category and PFS and LRFS in patients with early N category. And subgroup analyses of combined EBV DNA level and T/N category showed the same result. We did not observe a significant difference in patients with early T category or advanced N category. This difference may be due to the poor prognosis of patients with advanced N category disease. The results of this study revealed that, among patients with advanced T category, early N category, and low EBV DNA level, those with high Rta-IgG levels had a significantly inferior prognosis in terms of PFS and LRFS compared to patients with low Rta-IgG levels. In summary, we guessed that Rta-IgG levels have better prognostic stratification value in patients with low EBV level and advanced T category.
The predictive validity of serum EBV antibodies has been previously reported. Xu et al. [28] reported decreased serum concentrations of Rta-IgG in NPC patients after effective radiation therapy, suggesting that Rta-IgG might be a promising tool to determine the prognosis of NPC in individualized therapy. However, Cai et al. [29] reported no association between serum EBV antibody levels and survival outcomes. These contrary results may be due to highly heterogeneous study cohorts. In the present study, we also found that patients with high levels of all three antibodies had a significantly inferior prognosis in terms of PFS and LRFS compared to other patients. However, further investigation is required to fully determine the predictive validity of serum EBV antibody levels in patients with NPC.
5. Predictive validity of pEBV DNA level
Previous studies reported the pretreatment EBV DNA level to be an important prognostic factor for NPC [4,5,20]. Some study findings indicated that the pretreatment pEBV DNA level reflects the NPC gross tumor burden and that the pEBV DNA level is strongly correlated with the TNM classification and overall stage [9,27]. Many studies have demonstrated that a pretreatment cutoff EBV DNA level of 1,500 copies/mL has a better prognostic value [30]. The present study also applied this optimal cutoff and found that high EBV DNA level predicted high risk and worse survival outcomes. High EBV DNA level was significantly associated with inferior PFS, OS, and DMFS by log-rank tests and was also significantly associated with inferior PFS and DMFS in multivariable analyses. According to our stratification of locoregionally advanced NPC, patients with high EBV DNA levels (> 1,500 copies/mL) had worse survival outcomes than those with low EBV DNA level (≤ 1,500 copies/mL). Moreover, among patients with low EBV DNA levels, those with high Rta-IgG levels had worse survival outcomes compared to patients with low Rta-IgG levels. However, the exact mechanism associated with poor survival in the high-risk group is not clear and further investigation is required. However, the intensity of therapy can be adjusted according to our classification.
6. Limitations and future directions of study
The first limitation of our study is that the measurement of serum EBV antibodies is not yet globally standardized. Another limitation is that the data were obtained exclusively at one center; thus, additional population-based studies are required to confirm our conclusions.
Our future research is dedicated to determining the changes in antibody levels before and after treatment. We would also like to compare the prognostic value of Rta-IgG with EA-IgA and VCA-IgA.
The results of this study provide evidence of the correlation between EBV serological markers and TNM classification in NPC, according to the eighth edition of the UICC/AJCC staging system. Both serum EBV antibody (Rta-IgG/Zta-IgA) and pEBV DNA levels were strongly correlated with TNM classifications. Otherwise, the Rta-IgG level was a negative prognostic factor in locoregionally advanced NPC patients, especially in the subgroup with advanced T category or low EBV DNA levels (≤ 1,500 copies/mL).