Introduction
Neoadjuvant chemotherapy (NAC) followed by interval debulking surgery (IDS) can be an alternative to primary debulking surgery for treating advanced-stage ovarian cancer when optimal cytoreduction cannot be achieved [1,2]. Chemotherapy sensitivity has been a well-known prognostic factor for survival, and evaluation of NAC response is mostly based on computed tomography (CT) imaging after three to four cycles of NAC. Earlier evaluation of NAC response would allow for avoidance of unnecessary surgical complications and toxicity due to ineffective treatment.
Recently, several studies have shown that 18F-fluorodeoxyglucose positron emission tomography/computed tomography (18F-FDG-PET/CT) may be useful for predicting early response to NAC in other malignancies [3-9]. However, there are only a few studies on the use of PET/CT for evaluation of response to NAC in ovarian cancer [10-13]. Avril et al. [10] showed that the sequential 18F-FDG-PET/CT after one cycle of NAC predicted patient’s outcome. Other than the result of this study [10], there is no data on the use of PET/CT after one cycle of NAC to predict chemotherapy response before IDS.
Histopathological changes seen at IDS reflect direct NAC response [14-17]. However, there is no consensus regarding the prognostic value of the pathologic grading system to assess NAC response at IDS. Recently, Böhm et al. proposed the 3-tier chemotherapy response score (CRS) system for ovarian cancer, and our group performed an external validation of this system confirming a high reproducibility and prognostic value [18,19]. As pathologic response could be a surrogate endpoint, we evaluated how the early tumor metabolic change during NAC correlated with histopathological response observed at IDS. The aim of this study was to investigate the ability of PET parameters after one cycle of chemotherapy to predict NAC response in advanced-stage ovarian cancer patients.
Materials and Methods
1. Patients
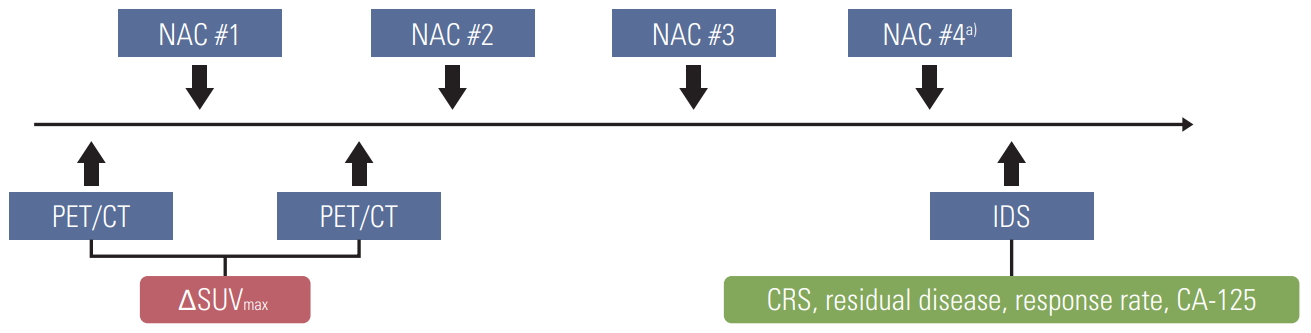
From 2016 to 2018, 40 consecutive patients diagnosed with International Federation of Gynecology and Obstetrics stage IIIC or IV high-grade serous ovarian cancer underwent baseline 18F-FDG-PET/CT before starting NAC. Thirty-eight of 40 patients underwent diagnostic laparoscopy showing Fagotti score ≥ 8 [20] before NAC, while two patients received NAC after histologically confirmed by cytologic evaluation of ascites without diagnostic laparoscopy. All of them underwent a second 18F-FDG-PET/CT examination after one cycle of NAC. After the completion of NAC, 39 patients underwent IDS (Fig. 1). One patient did not receive IDS because she refused surgery and follow-up loss after four cycles of NAC.
2. Protocol-based treatment
Diagnostic work-up included contrast-enhanced CT scan of the chest/pelvis as well as FDG-PET/CT were obtained for all patients at baseline to determine the tumor burden.
In our institution, NAC was performed as the primary treatment strategy, when one of the following three selection criteria was met [21]: (1) pulmonary and/or hepatic parenchymal metastases observed on initial imaging work-up, (2) patients with poor performance status and high operative risk due to medical comorbidities, or (3) optimal debulking surgery (i.e., ≤ 1 cm of residual disease at debulking surgery) was unsuitable due to high tumor burden (Fagotti score ≥ 8). During diagnostic laparoscopy, the degree of tumor burden was described by Fagotti score.
All patients, preferably, are recommended to receive three cycles of NAC and IDS, as well as three cycles of postoperative adjuvant chemotherapy (POAC). For NAC and POAC, all patients received platinum-based combination chemotherapy (paclitaxel [175 mg/m2]+carboplatin [area under the curve of 5 to 6]).
All patients underwent surgery with the intent to achieve complete cytoreduction (no gross residual disease) and followed the same routine, beginning with complete omentectomy, hysterectomy, bilateral salpingo-oophorectomy, and removal of all macroscopically detectable lesions using surgical resection. Furthermore, 29 patients underwent IDS following hyperthermic intraperitoneal chemotherapy.
3. 18F-FDG-PET/CT imaging and imaging analysis
All subjects were requested to fast for over 8 hours before PET acquisition. Blood glucose concentrations were confirmed to be < 140 mg/dL at the time of FDG injection.
Intravenously, 5.5 MBq of 18F-FDG per kg body weight were injected. After 60 minutes, integrated FDG-PET/CT was performed using a dedicated PET/CT scanner (Discovery STE, GE Healthcare, Milwaukee, WI). Whole body spiral CT scan was performed from the vertex of the skull to the mid-thigh using the following parameters: 120 kVp, 30 mA, 0.8-second rotation time, 3.75 mm helical thickness, 27 mm per rotation (speed), 2.5 mm scan reconstruction, with a reconstruction index of 1.25 mm, 15.7 cm field of view, and a 512×512 matrix. PET scan was acquired from the cerebellum to the proximal thigh, and acquisition time was 3 minutes per bed position using the 3D-mode. Attenuation corrected PET data were reconstructed iteratively using an ordered-subset expectation maximization algorithm.
4. PET parameter
All 18F-FDG-PET/CT images were reviewed blinded to the clinical outcome by two nuclear medicine physicians. Each region with a higher FDG uptake than the background was considered significant. The maximum standardized uptake values (SUVmax) were measured by drawing a circular region of interest (ROI) at the site of the maximum 18F-FDG uptake on the transaxial PET images. The SUV of the ROI was calculated as follows: (decay-corrected activity [MBq] per tissue volume [mL])/(injected 18F-FDG dose [MBq] per body mass [g]).
Seven tumor lesions (right upper quadrant, left upper quadrant, sub-hepatic area, mesentery, pelvis, right ovary, and left ovary) per patients were identified; and SUVmax at each examination were calculated. The SUVmax after one cycle of NAC was compared with that of the baseline study. Multiple metastatic tumors observed by 18F-FDG-PET/CT were found in all patients. Therefore, we used the lesion with the lowest change in 18F-FDG uptake for the study analysis based on the rationale that the metastatic tumor with the worst response would determine survival. The change in SUVmax after one cycle of chemotherapy was expressed as ΔSUVmax (%)=100×(1st cycle SUVmax–baseline SUVmax)/baseline SUVmax.
5. Assessment of response to NAC
1) Cancer antigen 125 normalization
Cancer antigen 125 (CA-125) levels were determined before diagnostic laparoscopy, before each NAC cycle, and before IDS. CA-125 response criterion was a complete normalization of CA-125 levels before IDS (< 35 U/mL).
2) Imaging response (CT) by Response Evaluation Criteria in Solid Tumors
Patients’ radiological responses to NAC were generally estimated with contrast-enhanced CT before IDS and classified according to the Response Evaluation Criteria in Solid Tumors (RECIST) as complete response (CR), partial response (PR), stable disease, and progressive disease [22].
3) Residual tumor after IDS
During IDS, we collected information on the maximal diameter of the residual lesion for evaluation of the residual disease. Residual disease was reported using the following criteria: from no gross (microscopic) residual disease, 0.0-0.5 cm, 0.5-1.0 cm, 1.0-2.0 cm, or residual disease > 2.0 cm in the largest diameter.
4) Histopathological response by CRS
For the assessment of NAC-induced histopathological changes, specimens were taken from each of these three sites (omentum, right adnexa, and left adnexa) during IDS. All available hematoxylin and eosin–stained slides were reviewed by an experienced gynecologic pathologist (H.-S.K.). As Bohm et al. [18] and Lee et al. [19] reported significant correlations between outcome and omental CRS, we analyzed the histo-pathological response to NAC with omental CRS.
Specimens with no or minimal tumor response, appreciable tumor response, and complete or near-CR were indicated as CRS 1, 2, and 3, respectively. Patients with CRS 1 or 2 were considered as histopathological non-responders, while patients with CRS 3 were considered as histopathological responders.
6. Statistical analysis
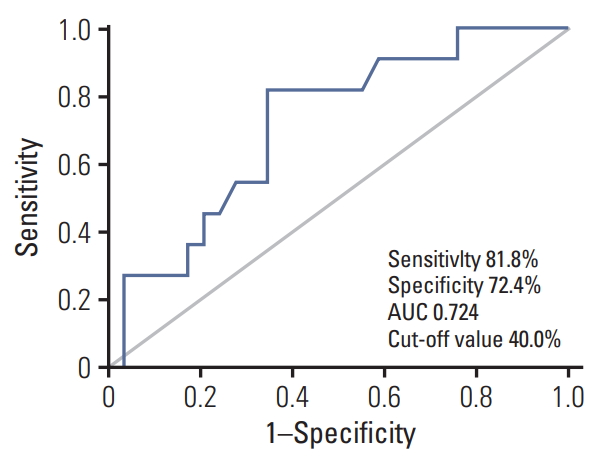
Correlations between CRS and PET parameter were examined with the Mann-Whitney U test. The predictive performance regarding the identification of CRS 3 was evaluated using the receiver operating characteristic (ROC) curve analysis.
Associations between metabolic response and NAC parameters were examined with the chi-square and Fisher’s exact tests. Progression-free survival (PFS) and overall survival (OS) were analyzed by the Kaplan-Meier method, and the difference of survival rates between metabolic responders and non-responders were compared by the log-rank test. Statistical analyses were conducted using IBM SPSS ver. 25.0 for Windows (IBM Corp., Armonk, NY). All tests were two-sided and p-values less than 0.05 were considered to indicate statistical significance.
Results
Eighty PET/CT scans were performed in 40 patients. The patients’ clinical, surgical, and pathological characteristics at baseline are summarized in Table 1.
The baseline 18F-FDG-PET/CT was performed before initiation of NAC at a median interval of 4.5 days (range, 1 to 17 days). The median time interval between the first cycle of NAC and the second (after the first cycle of NAC) 18F-FDG-PET/CT was 19 days (range, 7 to 24 days). Median decrease in SUVmax between the baseline and after one cycle of NAC was 36.7% (range, –6.8% to 74.4%). One patient showed an increase in SUV after one cycle of NAC, and she was a metabolic non-responder. Of 39 patients who received IDS, we observed CRS 3 in 11 patients (27.5%) and no residual disease rate at IDS in 20 patients (50.0%). Median follow-up time was 19.7 months (range, 2.2 to 43.9 months). During this period, 18 patients experienced recurrence and eight of them died. Analysis of all 40 patients showed a median PFS of 21.0 months (95% confidence interval [CI], 17.8 to 24.3), and the median OS was not reached.
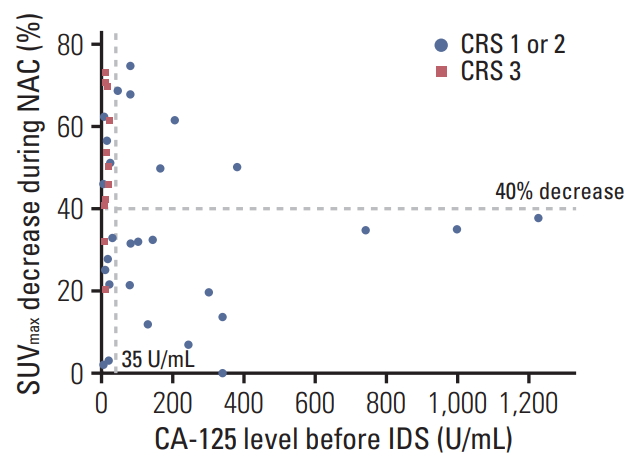
1. The ΔSUVmax threshold value and CRS (CRS 1 or 2 vs. CRS 3–metabolic response)
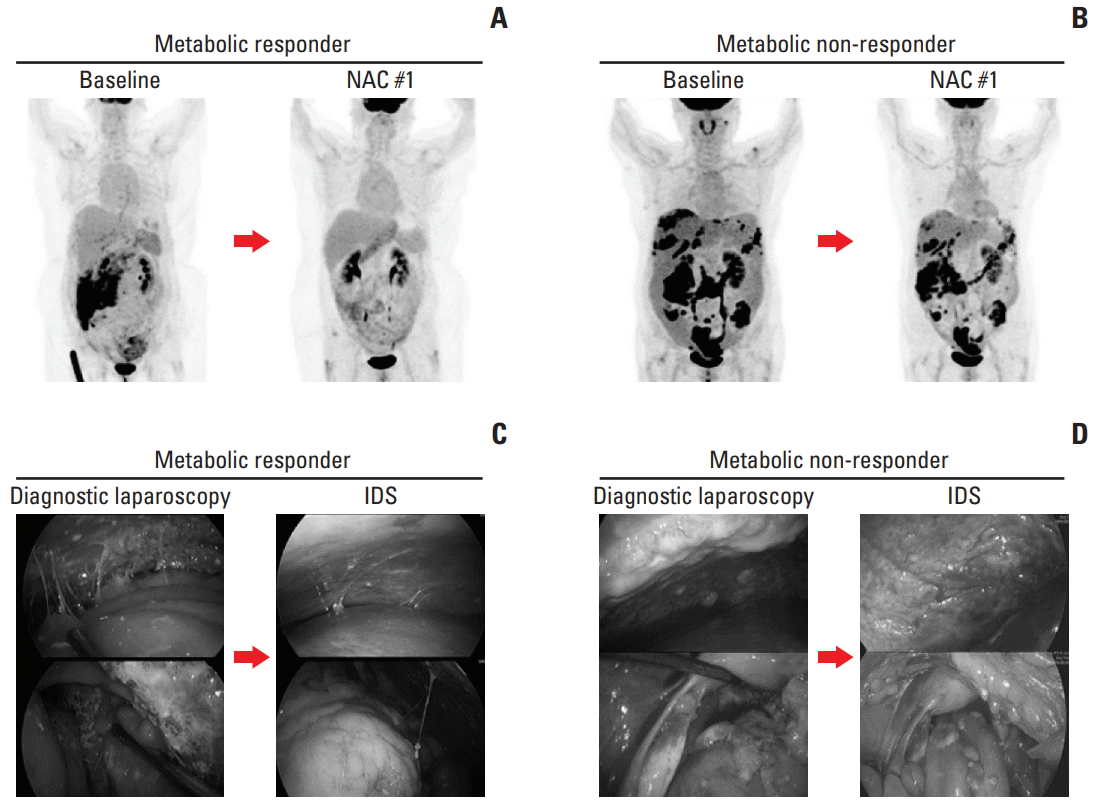
A cut-off of 40% of SUVmax decrease in metastatic sites offered the best accuracy in predicting CRS 3 (CR or near-CR) with a sensitivity of 81.8%, specificity of 72.4%, and area under the curve of 0.72. The ROC curve is presented in Fig. 2. We selected the 40% cut-off to define the metabolic response; there were 17 (42.5%) metabolic responders (≥ 40% decrease in SUVmax) with a median decrease in SUVmax of 53.5% (range, 40.7% to 74.4%) and 23 (57.5%) metabolic non-responders (< 40%) with a median decrease of 25.0% (range, –6.8% to 39.7%). After one cycle of NAC, a threshold of 40% decrease in SUVmax was found to differentiate between pathologic non-responders (CRS 1 or 2) and responders (CRS 3) (Fig. 3). Fig. 4 shows that examples of metabolic responder and non-responder observed in PET/CT and surgical findings before and after NAC.
2. Association between PET parameters and NAC parameters
There was a significant correlation between 18F-FDG-PET/CT metabolic response and CRS. Metabolic responders had higher CRS 3 rate than metabolic non-responders (52.9% vs. 8.7%, p=0.003). Furthermore, there was a close relationship between 18F-FDG-PET/CT metabolic response and CA-125 normalization (< 35 U/mL) before IDS (76.5% vs. 39.1%, p=0.019). No residual tumor rate at IDS was 70.6% within metabolic responders and 31.8% within non-responders; and a significant correlation was observed between 18F-FDG-PET/CT metabolic response and residual tumor at IDS (p=0.025). Only CR or PR were found as radiological response rate before IDS, and there was no significant correlation radiological response rate before IDS between metabolic responder and non-responder (p=0.069) (Table 2).
3. Metabolic response and survival
There was a significant association between metabolic response in 18F-FDG-PET/CT after one cycle of NAC and PFS (p=0.021), but not OS (p=0.335). Using defined 40% threshold for decrease in SUVmax from baseline after one cycle of NAC, median PFS was not reached in metabolic responders (n=17) compared with 18.5 months (95% CI, 13.9 to 23.0 months) in non-responders (n=23, p=0.021) (S1 Fig.).
Discussion
Our results demonstrated that tumor metabolic change after one cycle of NAC can be a valuable predictor of early response to chemotherapy, and potentially could identify metabolic responders and non-responders using a cut-off value of 40%.
In advanced-stage ovarian cancer, it is important to assess NAC response before IDS, as patients who do not respond to NAC seem to have less benefit from IDS. There is increasing need for sensitive and specific non-invasive imaging methods for evaluating chemotherapy response for proper decision making in the management of ovarian cancer patients. 18F-FDG-PET/CT is a promising imaging method to evaluate NAC response and help to identify patients who response to treatment in ovarian cancer [10-13]. Avril et al. [10] showed that the sequential 18F-FDG-PET/CT after one cycle of NAC predicted patient outcome. Nishiyama et al. [11] evaluated the ability of 18F-FDG-PET/CT after five or six cycles of NAC to predict the response of NAC. Martoni et al. [12] reported the ability of 18F-FDG-PET/CT after three cycles of NAC to identify patients who would obtain benefits from prolonged NAC. Vallius et al. [13] evaluated the usefulness of 18F-FDG-PET/CT after three or four cycles of NAC for identifying patients who would not respond to NAC.
Furthermore, an early change of the treatment strategy could be considered to avoid delay of second-line chemotherapy and risk of unnecessary postoperative complications. Therefore, it would also be valuable for detecting metabolic responders and non-responders at an early time-point. In consistent with results of Park et al. [9], we demonstrated that early tumor metabolic change after one cycle of NAC could predict chemotherapy response before IDS. To date, other than the results of these two studies, there are no data on the use of PET/CT after one cycle of NAC to assess treatment response.
In this study, the optimal threshold of ΔSUVmax that discriminate between metabolic responders and non-responders after one cycle of NAC was 40%. Considering the kinetics of tumor cell kill and the relationship to 18F-FDG-PET/CT, we hypothesized that early metabolic change would differentiate chemotherapy response. As the number of NAC cycles increases, the number of cancer cells that can be detected by 18F-FDG-PET/CT decreases while the SUVmax value falls below the threshold that produced the difference in metabolic responder and non-responders; therefore, the metabolic difference between the two groups disappeared.
In 2009, Wahl et al. [23] proposed the PET response criteria in solid tumors (PERCIST) as a new standardized method by which the chemotherapy response was assessed by metabolic changes. The SUL (lean body mass corrected SUV) is determined for up to five measurable target lesions, typically the five hottest lesions. A metabolic response is considered more than a 30% decrease in SUL peak between the preand posttreatment scans, although not necessarily the same lesion. Moreover, our study shows that the metabolic response needed to be associated with a histopathologic response to NAC should be more than the SUVmax changes of the PERCIST criteria.
Since multiple metastatic tumors and sites were present in advanced-stage ovarian cancer, it is difficult to evaluate the metabolic response in only one lesion. In this study, we evaluated metabolic change regarding heterogeneous chemotherapy response according to metastatic sites. 18F-FDG-PET/CT parameters such as the SUVmax of the right and left upper quadrant, sub-hepatic area, mesentery, pelvis, as well as the right and left ovary were assessed in all patients. Chemotherapy response is expected to vary depending on the location of primary and metastatic lesions due to intratumor heterogeneity in genomic profiles [24]. We mainly focused on the SUVmax values of the metastatic lesion with the lowest change in 18F-FDG uptake, as the metastatic tumor with the worst response would determine survival.
There were several strengths in our study. First, we used CRS system to assess the pathologic response at IDS. We assessed the pathologic grading scale such as CRS system, which validated its prognostic significance, and high reproducibility [18,19]. Second, our study was the homogenous study cohort consisting of advanced-stage ovarian cancer patients who received protocol-based treatment at our institution [21]. Third, a definite value for SUVmax change that discriminates between metabolic responders and non-responders was presented using the ROC curve analysis in this study.
One of the limitations in our study was its retrospective design. Another was the small number of patients, and the short follow-up period. It may be a factor in which metabolic response did not reflected in OS. Interpretation of this study must be confined to short-term results, and further investigation with a prospective design and large population is needed.
In this study, using sequential 18F-FDG-PET/CT and histo-pathological response evaluation with CRS system, we identified patients who did not respond to NAC and were not likely to benefit from IDS. It is important to identify poor metabolic response patients to avoid the risk of unnecessary surgical complications and toxicity due to ineffective treatment. In patients without metabolic response to NAC, the chemotherapy regimen may be changed to the second-line therapy or earlier oncologic surgery should be considered before the performance status gets worse. 18F-FDG-PET/CT could provide initial information on tumor response in patients without clinical or radiologic progression on whether to continue the same NAC regimen, change to a different regimen, or to discontinue the regimen.
In conclusion, the change in SUVmax after one cycle of NAC offers powerful stratification of patient outcomes, early, during treatment. Therefore, 18F-FDG-PET/CT can be useful in identifying patients who will not respond to NAC and metabolic non-responder might be candidates for second-line chemotherapy and clinical trials, instead of IDS.