Introduction
Pancreatic neuroendocrine neoplasms (PanNENs) are solid tumors of the pancreas with neuroendocrine differentiation, which show synaptophysin and/or chromogranin expression [1]. PanNENs are the second most common solid neoplasms of the pancreas, and comprise 3%-4% of all pancreatic tumors [1]. As a change from the hybrid staging-based 2000 World Health Organization (WHO) classification of PanNEN, the proliferative activity (based on the Ki-67 labeling index [Ki-67–LI] and mitotic index [MI]) has become the basis for grading these tumors since 2010, based on evidence that PanNENs with increased proliferative activity are significantly more aggressive and portend poor prognoses [2]. In this 2010 classification, PanNENs were classified as G1 pancreatic neuroendocrine tumor (PanNET), G2 PanNET, and pancreatic neuroendocrine carcinoma (PanNEC), large cell or small cell type, with the implication that G3 tumors were by definition poorly differentiated PanNECs [2]. However, since the 2010 classification, several studies have identified an uncommon group of PanNENs that are well-differentiated but breach the threshold for the high-grade PanNEC category (Ki-67–LI > 20% and/or MI > 20/high-power fields [HPFs]), advocating the use of the terminology “G3 well-differentiated PanNETs” and its separation from true PanNECs [3,4]. PanNECs commonly harbor genetic changes seen in ductal adenocarcinoma such as RB1 and TP53 mutations, while mutations in DAXX, ATRX, or MEN1 that are characteristic of PanNETs are absent in PanNECs [5,6]. In addition, a recent study of G3 PanNENs by Raj et al. [7] demonstrated that while response to platinum and alkylating agents was similar in both G3 PanNET and PanNEC patients, the overall survival was significantly longer in G3 PanNETs, again providing evidence for the separation of these two tumors.
With this background, the most recent 2017 WHO classification of PanNEN has refined the three-tiered 2010 classification by separating G3 PanNET from PanNEC [1,5-9]. However, there is a lack of clinicopathological studies on these high-grade PanNENs, especially on primary pancreatic PanNECs which are extremely rare. Here, we performed a nationwide multicenter study on Korean PanNENs to explore the differences in the clinicopathological and immunohistochemical features between PanNECs and G3 well-differentiated PanNETs.
Materials and Methods
1. Patients
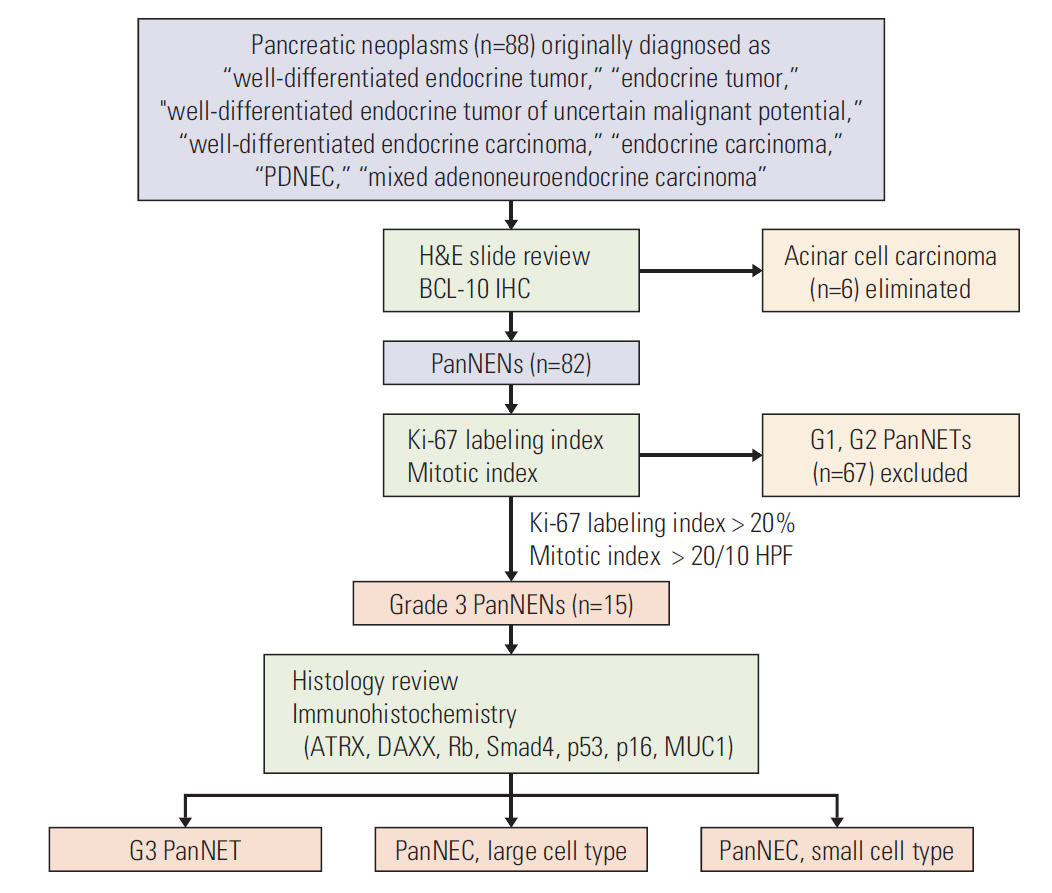
The case selection procedure is summarized in Fig. 1. To evaluate patient survival with adequate follow-up, PanNEN cases with more than 9 years of follow-up were included in the present study. Eighty-eight surgically resected specimens over a period of 10 years (2000-2010) diagnosed as “well-differentiated endocrine tumor,” “well-differentiated endocrine tumor of uncertain malignant potential,” “well-differentiated endocrine carcinoma,” “endocrine tumor,” “endocrine carcinoma,” or “poorly differentiated neuroendocrine carcinoma (NEC)” were retrieved from 16 institutions in South Korea. All cases were primary surgical resection specimens. Biopsy specimens, recurrences or metastatic tumors were not included. In addition, secondary involvement of the pancreas (e.g., metastatic neuroendocrine tumors [NET], pancreatic invasion of ampullary or biliary NECs) was excluded. Representative hematoxylin and eosin–stained recut slides, unstained slides, and the clinicopathological information retrieved from the pathology archives and electronic medical records of each institution were submitted for central review. The clinicopathological data included age at surgery, sex, type of surgery performed, location of tumor, tumor size, macroscopic growth pattern (expansile vs. infiltrative), multiplicity of tumor, presence of genetic syndromes (e.g., multiple endocrine neoplasia [MEN], von Hippel-Lindau [VHL] syndrome), functional status of the tumor (e.g., insulin, glucagon, or gastrin secretion), pathologic T category (according to the American Joint Committee on Cancer 8th edition), lymph node metastasis status, presence of peripancreatic soft tissue and/or adjacent organ invasion, tumor margin (expansile, infiltrative, or mixed), presence of lymphatic, venous or perineural invasion, local recurrence, and distant metastasis. Overall survival was defined as the interval between surgery and death or latest follow-up, and disease-free survival as the interval between surgery and local recurrence or distant metastasis.
2. Immunohistochemistry
The initial screening immunohistochemical analysis was performed on the submitted 4-μm-thick unstained sections for BCL-10 (1:200, clone 331.3, Santa Cruz Biotechnology, Santa Cruz, CA) and Ki-67 (1:100, clone MIB-1, Dako, Carpinteria, CA) using the BenchMark XT automated equipment (Ventana Medical System Inc., Tucson, AZ). Six cases demonstrated histological and immunohistochemical features compatible with acinar cell carcinoma (acinar or solid architecture, granular cytoplasm, prominent nucleoli, and strong BCL-10 expression), and therefore excluded from further analysis. The Ki-67–LI and MI were determined from the remaining 82 PanNENs. The Ki-67–LI was calculated as the percentage of tumor cells with nuclear Ki-67 staining, by obtaining digital photomicrographs of hot spots at ×400 HPFs on an Olympus BX50 microscope (Tokyo, Japan) and counting the nuclei with and without labeling semi-manually with the ImageJ analysis software (downloaded from imagej.nih.gov/ij, ver. 1.47). The MI was calculated by examining 50 HPFs in the submitted representative tumor sections and expressed as mitoses per 10 HPFs according to the guideline of the 2017 WHO classification [1]. NETs that fulfilled the G3 criteria (Ki-67–LI > 20% and/or MI > 20/10 HPF) were subjected to further histological assessment by two expert pancreatobiliary pathologists (H.K. and M.S.H.) and immunohistochemical analysis. The histopathological factors examined included (1) presence of lymphovascular or perineural invasion, (2) presence of a low-grade PanNET component (e.g., grade 1 or 2), (3) presence of organoid growth pattern (e.g., trabecular, nested, gyriform patterns), (4) solid growth, (5) regular intratumoral vascular patterns, (6) tumor necrosis (geographic or punctate), (7) extensive apoptosis (apoptotic bodies conspicuous in most HPFs), (8) marked nuclear atypia, (9) prominent nucleoli, (10) fusiform nuclei, and (11) amount of tumor cell cytoplasm (ample/abundant granular or scant). Marked nuclear atypia was defined as having the following features in > 20% of the tumor cells: more than 5-fold nuclear enlargement compared with normal islet cell nuclei, irregular nuclear contour, coarsely clumped chromatin, and nuclear hyperchromasia, as described elsewhere [10]. Based on the above histological criteria, cases were categorized as G3 PanNETs and PanNECs. PanNECs were further classified as small cell and large cell types based on the updated 2017 WHO classification [8].
Additional immunohistochemistry was performed for the high-grade PanNENs using the following antibodies: ATRX (polyclonal, 1:300, Sigma-Aldrich, St. Louis, MO), DAXX (1:100, polyclonal, Sigma-Aldrich), retinoblastoma (Rb; 1:100, clone G3-245, BD Biosciences, Bedford, MA), p53 (1:1,000, clone DO-7, Dako), Smad4 (1:100, clone B-8, Santa Cruz Biotechnology), p16 (clone E6H4, ready-to-use, Ventana Medical System Inc.) and MUC1 (1:200, clone MA695, Novocastra, Newcastle upon Tyne, UK). Complete loss of ATRX, DAXX, Rb, and Smad4 labeling were regarded as abnormal. Strong p53 expression in > 20% of the tumor cells or complete absence of p53 expression was regarded as abnormal expression [11]. Diffuse or patchy strong cytoplasmic expression of MUC1 and p16 were regarded as positive, while the presence of occasional scattered MUC1 or p16-positive tumor cells were regarded as negative. Based on the immunohistochemical stain results, we calculated the final immunoscore as the sum of the following components: presence of ATRX or DAXX loss (–1), Rb loss (+1), Smad4 loss (+1), abnormal p53 (+1), diffuse p16 (+1), and diffuse MUC1 expression (+1). By this method, the immunoscore ranged from –1 to 5.
3. Statistical analysis
Statistical analyses were performed using STATA ver. 14.0 (StataCorp., College Station, TX) and SPSS 19.0K (SPSS Inc., Chicago, IL). The clinicopathological features were compared between the various groups of PanNETs using an independent t test, Mann-Whitney U test or Kruskal-Wallis test for the continuous variables, and chi-square test or the Fisher exact test for the categorical variables, as deemed appropriate. The discriminatory potential of the immunoscore was analyzed by the receiver operating characteristics (ROC) analysis, and the optimal cut-off value was determined by the Youden index. Survival analyses for overall and disease-free survivals were performed by the Kaplan-Meier method and log-rank test. Statistical significance was defined as p < 0.05.
4. Ethical statement
The study was approved by the institutional review board (Seoul National University Hospital [1809-140-975], Seoul National University Bundang Hospital [B-1603-340-302], Asan Medical Center [2015-0387], Inje University Seoul Paik Hospital [IIT-2015-353], and Seoul St. Mary’s Hospital, The Catholic University of Korea [KC16SIMI0250 2016-0748-0001]). Informed consent was waived due to the retrospective nature of the study.
Results
1. Case characteristics
The overall clinicopathological features of all 82 PanNENs are summarized in S1 Table. The median age at surgery was 53 years (range, 12 to 81 years) and the male to female ratio was 1.3:1. The mean follow-up period was 57 months (range, 0 to 145 months). All specimens reviewed were surgically resected pancreata for primary PanNENs.
2. Comparison of the clinicopathological characteristics of reclassified PanNENs according to grade
Based on the MI and Ki-67–LI, 20 cases (24.4%) were reclassified as G1 PanNETs, 47 cases (57.3%) as G2 PanNETs and 15 cases (18.3%) fulfilled the criteria for G3 PanNENs (PanNETs or PanNEC). Grade discordance (either MI or Ki-67–LI not fulfilling the WHO criteria) was seen for none of the G1 PanNETs, 29 G2 PanNETs (61.7%), all of the G3 PanNETs (100%), and two of PanNECs (28.6%). In detail, for G2 PanNETs, “G2” was assigned based on the Ki-67–LI for 15 cases (31.9%) in which the MIs were G1 (0-1/10 HPF), while the MI determined the grade for 14 cases (29.8%) with Ki-67–LI < 3%. Interestingly, none of the G3 PanNETs were concordant; the grade was determined based on the Ki-67–LI for six cases (75%) and the MI for two cases (25%). For PanNECs, all seven cases showed Ki-67–LI exceeding 20%, and two of these cases (28.6%) showed MI ≤ 20/10HPF.
The differences in the clinicopathological characteristics of the PanNENs according to grade are summarized in Table 1. Tumor size was significantly larger with increasing grade (p=0.005) and higher grade tumors were significantly associated with adjacent organ invasion (p=0.001), higher pathologic T category (p=0.001), and more frequent lymphatic (p=0.007), venous (p=0.002) and perineural invasion (p=0.010). Hormonal secretion was more frequent in G1 PanNETs (55.0%, p < 0.001) and all of the G3 tumors were non-functioning tumors. Associated genetic syndromes were present in three G1 PanNETs (MEN type 1) (15%), in one G2 PanNET (VHL syndrome) (2.1%), and in none of the G3 PanNENs. Distant metastasis was more frequent in the higher grade NETs (p < 0.001). In general, the patient age increased with higher grade (median age: G1, 49 years; G2, 53 years; G3, 58 years), although statistical significance was not reached. There was no difference in sex distribution among the WHO grades.
3. Comparison between G3 PanNET and PanNEC
1) Comparisons of clinicopathological characteristics between G3 PanNET and PanNEC
The G3 PanNENs were further classified into eight G3 PanNET (9.8%) and seven PanNECs (8.5%), and the baseline and histopathological features of the individual cases are summarized in detail in Table 2 and S2 Table, respectively. There were no differences in age or sex between G3 PanNET and PanNEC. None of the G3 PanNEN cases were functioning tumors, and none had underlying genetic syndromes. While G3 PanNETs were equally distributed in location (head/uncinate process, 50%; body/tail, 50%), PanNECs occurred more frequently in the pancreatic head (57.1%) compared to the body or tail (28.6%). No significant differences were seen between the two groups with regard to tumor size, pT category and the presence of lymphatic, venous or perineural invasion. Adjacent organ invasion (p=0.057) and lymph node metastasis (p=0.072) tended to be more frequent in the PanNECs, although not statistically significant. Distant metastasis occurred in all eight G3 PanNETs (synchronous, 2/8; metachronous, 6/8), and in five of PanNECs (71.4%). The metastatic site was the liver for all cases.
2) Comparisons of histological characteristics between G3 PanNET and PanNEC
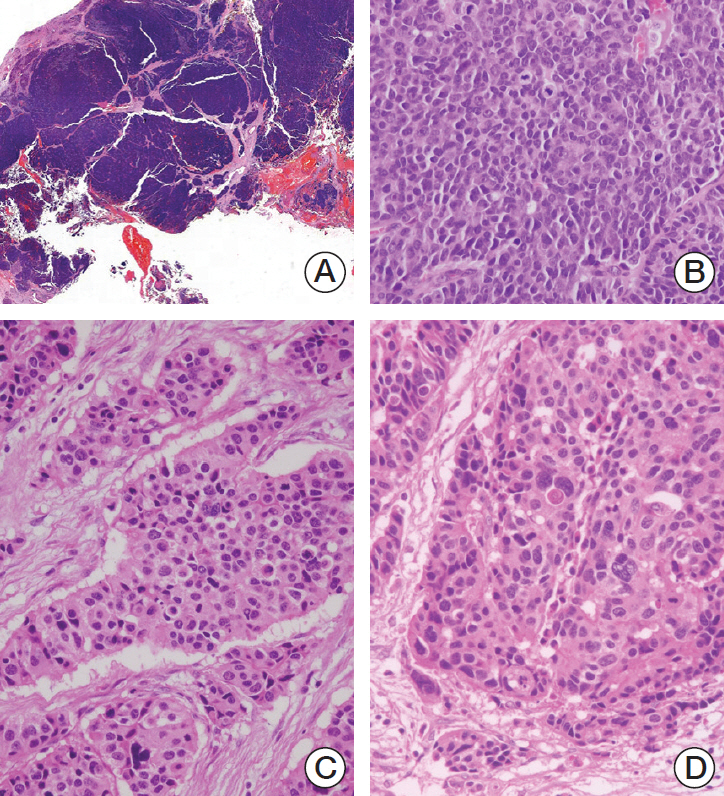
The detailed microscopic features of the individual G3 PanNET and PanNEC cases are summarized in Table 2. Organoid growth patterns were easily identified in all eight G3-PanNETs, including nested, trabecular, and gyriform growth (Fig. 2). In between the tumor cell nests, there were regularly distributed capillary-sized vessels in all cases and 4/8 cases showed hyalinized collagen. Four G3 PanNETs demonstrated a co-existing low-grade component. The tumor cells were mostly cuboidal in shape. Most of the tumor cell nuclei were round-to-oval and uniform in size and shape. The chromatin pattern was mostly the coarsely clumped “salt-andpepper” type. Although nuclear atypia was focally present, diffuse marked nuclear atypia (> 20% of the tumor cells) was seen in only 3/8 cases. Cytoplasm was ample or abundant in all cases, with the eosinophilic and granular feature typical of NETs. Macronucleoli were seen focally in 4/8 cases. Apoptosis was not a frequent feature of G3 PanNETs, with only one exceptional case demonstrating frequent apoptotic bodies. Geographic or punctate tumor necrosis was seen in five cases (Fig. 2).
PanNECs were mostly characterized by a solid sheet-like and infiltrative growth pattern (Fig. 3). Complex organoid patterns were recognized within the tumor in five cases, and regular vascular patterns typical of PanNETs were seen in one large cell (LC)–PanNEC. Low-grade PanNET components were not seen in any of the PanNECs. Punctate or geographic necrosis was seen in 5/7 cases (S3 Fig.) and 6/7 PanNECs demonstrated frequent apoptotic bodies. Diffuse marked nuclear atypia was seen in all seven PanNECs, and macronucleoli were seen in 6/7 cases (Fig. 3). In summary, compared to G3 PanNETs, PanNECs less frequently showed regular vascular patterns (p=0.001) and co-existing low-grade PanNET components (p=0.077), and more frequently demonstrated apoptotic bodies in the tumor (p=0.010). The tumor cells of LC-NECs were round to polygonal in shape with ample or abundant eosinophilic cytoplasm, while none of the small cell (SC)–NECs showed this feature.
SC-PanNECs were easier to identify based on the histological features alone, as all cases demonstrated fusiform nuclei, high nuclear/cytoplasmic ratio, nuclear molding, hyperchromasia and scanty cytoplasm (Fig. 3). However, the histopathological features of LC-PanNECs frequently overlapped with G3 PanNETs, and the discrimination between two groups was more difficult. One case (“PanNEC-1” in Table 3, Fig. 3C and D) demonstrated predominant organoid growth pattern without solid/confluent growth leading to the initial impression of a G3 PanNET; however, the diagnosis of LC-PanNEC was favored due to the marked nuclear atypia of most tumor cells, frequent apoptosis, extensive punctate necrosis, and abundant mitotic figures.
As expected, the Ki-67–LI was higher in PanNEC than in G3 PanNET (PanNEC, 58.2±15.1% vs. G3 PanNET, 22.6±6.1%; p < 0.001) (S4 Fig.). Interestingly, the Ki-67 staining was homogeneously high in all PanNECs, while heterogeneity in Ki-67-positive cell distribution was seen in four G3 PanNETs (50%), where some fields showed higher Ki-67–LI than others. Similarly, the MI was higher in PanNEC compared to G3 PanNET, although statistical significance was not reached (PanNEC, 32.9±24.2/10 HPF; G3 PanNET, 14.4±7.7/10 HPF; p=0.061).
3) Comparisons of immunohistochemical results between G3 PanNET and PanNEC
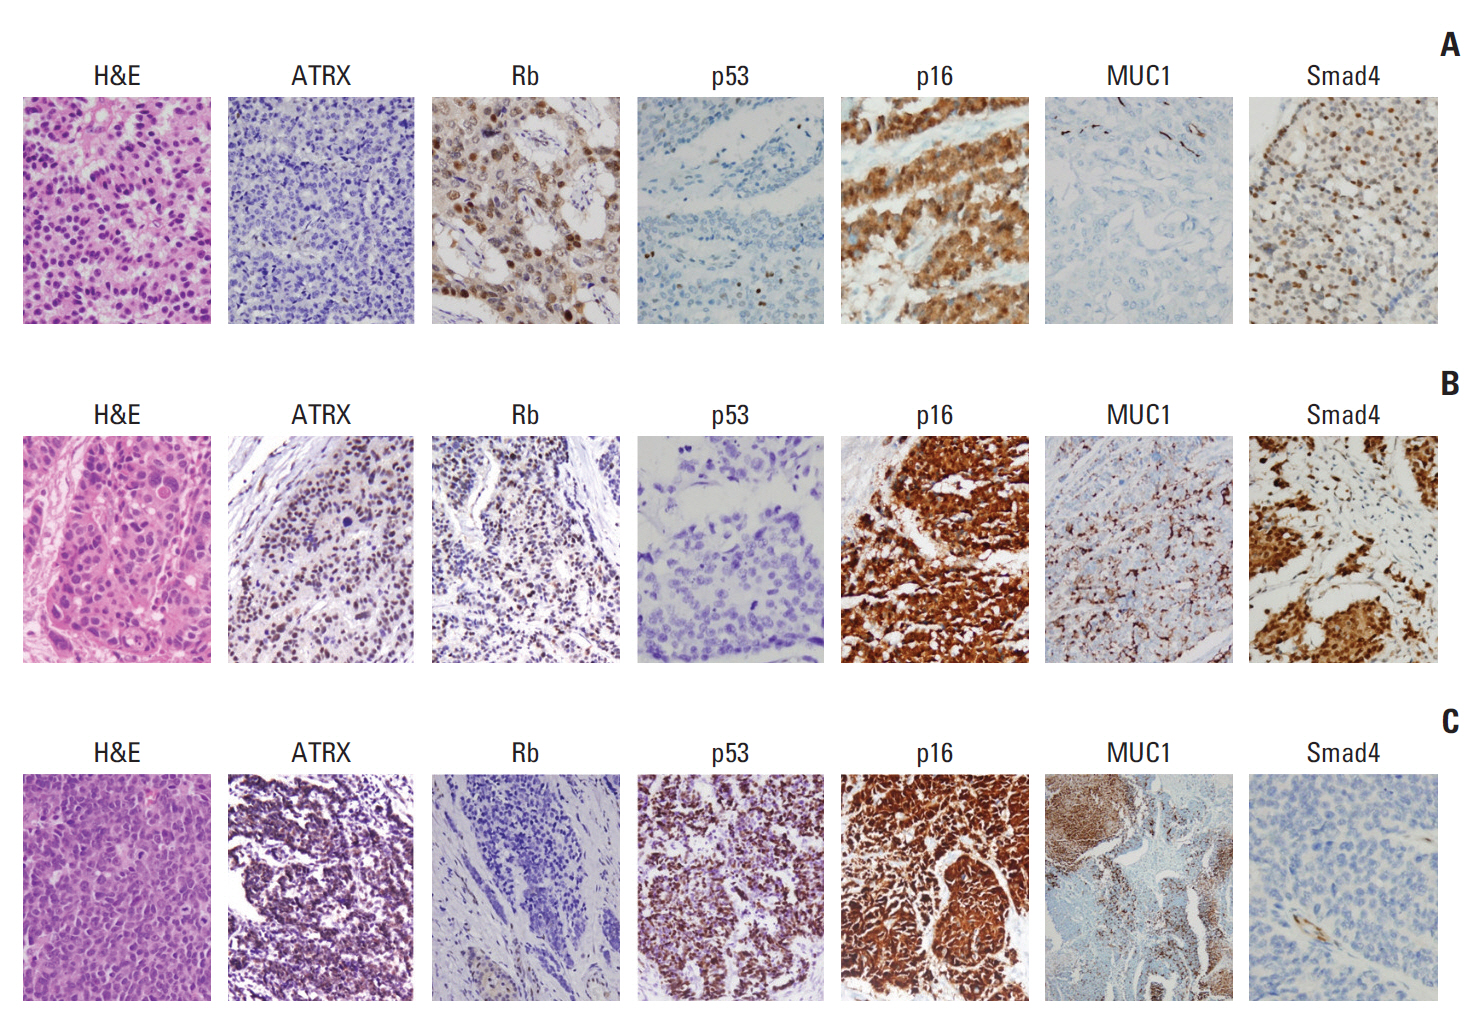
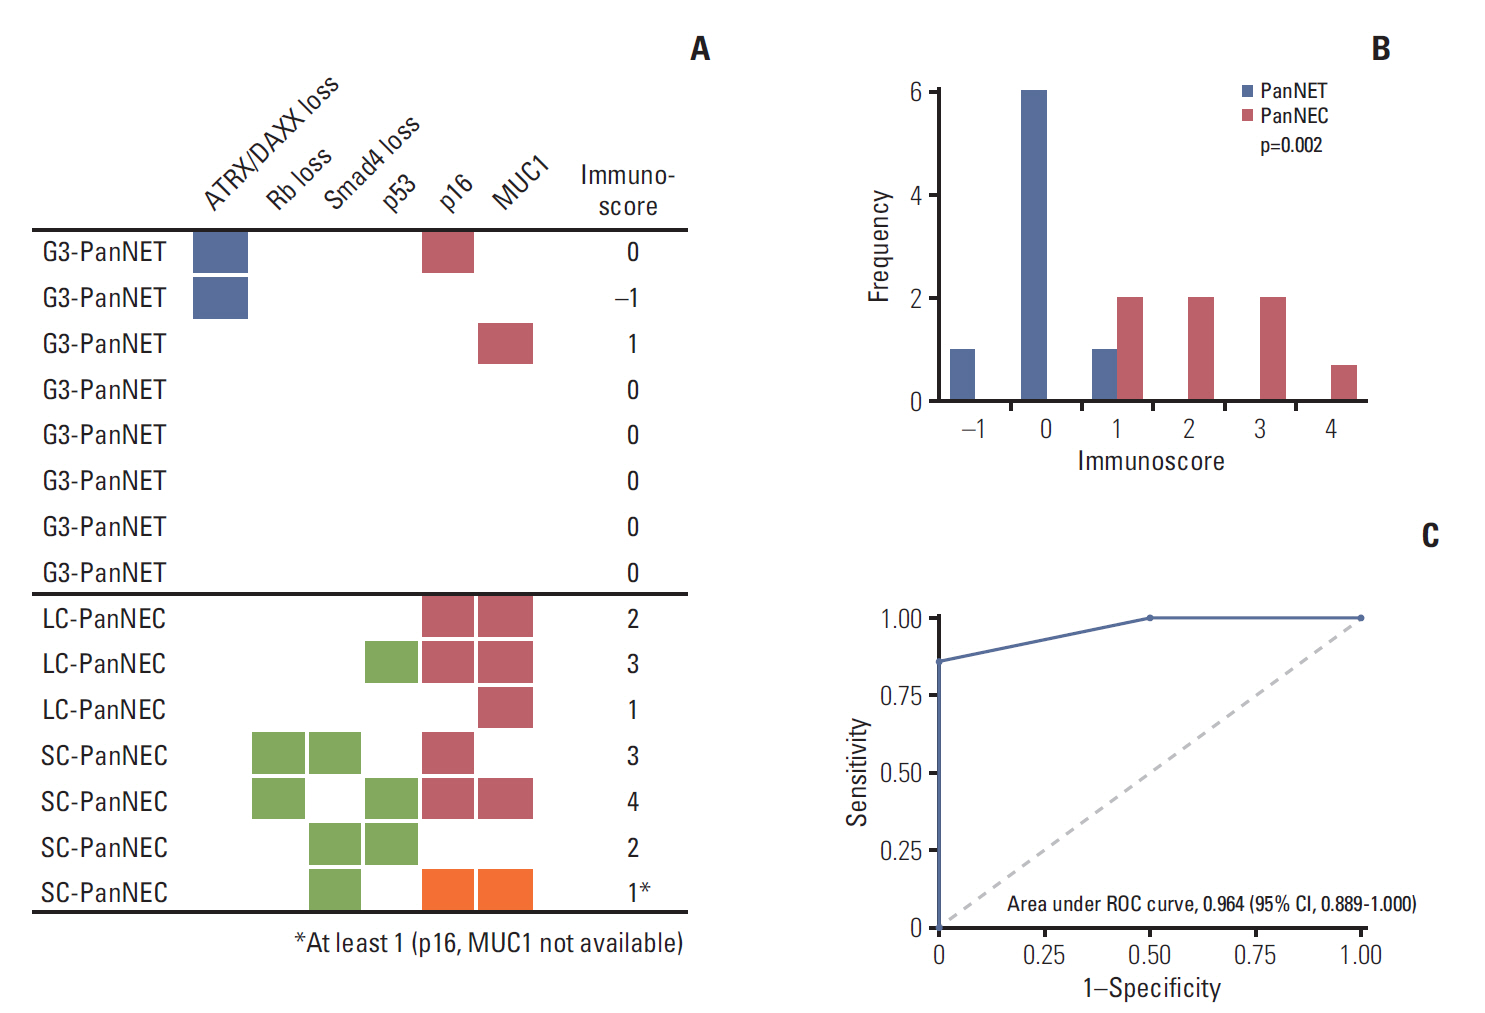
The immunohistochemical stain results are summarized in Figs. 4 and 5. ATRX loss was seen in 2/8 G3 PanNETs, and in none of the PanNECs. Loss of DAXX expression was not seen in any of the PanNENs. Loss of Rb and abnormal p53 expression was seen in 2/7 and 3/7 PanNECs, respectively, while none of the G3 PanNETs demonstrated Rb loss or p53 abnormalities. One SC-PanNEC demonstrated simultaneous loss of Rb expression and p53 overexpression. Loss of Smad4 expression was seen in 3/7 PanNECs, and all three cases were SC-PanNECs. None of the G3 PanNETs or LC-PanNECs demonstrated Smad4 loss. Diffuse p16 and/or MUC1 expression was seen in 2/8 G3 PanNETs and in 5/6 PanNECs with available staining (note: p16 and MUC1 immunohistochemistry was not performed for one SC-PanNEC due to shortage of tissue). Five G3 PanNETs (71%) did not show any abnormal findings by the immunohistochemical panel.
With the aim of better discriminating between G3 PanNETs and PanNECs, we combined the immunohistochemical stain results for the seven antibodies into an immunoscore, and by this method, the immunoscore ranged from –1 to 1 in G3 PanNETs and from 1 to 4 in PanNECs (Fig. 5). The immunoscore was significantly higher in the PanNECs compared to the G3 PanNETs (p=0.002, Mann-Whitney U test). The 4- to 6-marker panels that discriminated PanNECs from G3 PanNETs with 85.7% sensitivity and 100% specificity (area under the curve [AUC], 0.964-0.973; cut-off immunoscore determined by the Youden index, 2) all included TP53, p16, MUC1, and Smad4 (Table 3). Although the addition of Rb and/or ATRX/DAXX to the panel increased the AUC slightly, the sensitivity was not increased. By this method, abnormal expression of at least two of the four markers (p53, p16, MUC1, and Smad4) was helpful in identifying PanNECs.
4. Survival analysis results
The disease-free survivals and overall survivals were analyzed for the PanNENs according to the WHO 2017 classification (Fig. 6). The median disease-free survival times of G2 PanNETs, G3 PanNETs, and PanNEC were 55, 16, and 9 months, respectively. The median disease-free survival time for G1 PanNETs was not reached; the 5-year survival rate was 83.1%. The disease-free survival significantly decreased with increasing grade (overall comparison, p < 0.001), and there were significant survival differences between the different grades (G1 vs. G2 PanNET, p=0.026; G2 vs. G3 PanNET, p < 0.001). However, the difference between G3 PanNET and PanNEC was not statistically significant (p=0.262), possibly due to the small number of cases.
The median overall survival times of G3 PanNETs and PanNEC were 87 and 60 months, respectively. The median overall survival times for G1 and G2 PanNETs were not reached. Similarly to disease-free survival, overall survival significantly decreased with increasing WHO 2017 grade (p < 0.001, overall), and G3 PanNET showed decreased overall survival compared to G2 PanNET (p=0.023). However, there were no differences in overall survival between G1 and G2 PanNETs, and the difference between G3 PanNET and PanNEC did not reach statistical significance.
Discussion
According to the current 2017 WHO classification, G3 PanNETs and PanNECs are two distinct entities that are genetically different and have different clinical implications. G3 PanNETs share morphological, immunophenotypical and genetic features with other low-grade PanNETs, while there is increasing evidence that PanNECs are genetically more closely related to conventional pancreatic carcinomas than to PanNETs [12]. With this background, the recent TNM classification for PanNECs follows the criteria for classifying ductal adenocarcinomas [13]. It is therefore important that G3 PanNETs and PanNECs are distinguished in diagnostic pathology practice; however, the morphological distinction between these two entities, especially between LC-PanNEC and G3 PanNET, has not been clearly established and remains an area of diagnostic difficulty. Due to the rarity of primary pancreatic G3 PanNENs, we performed a multicenter study from 16 different institutions in South Korea to further evaluate the clinicopathological differences between PanNECs and G3 PanNETs.
High Ki-67–LI (> 20%) is one of the diagnostic criteria for discriminating between G3 and low-grade PanNETs. Interestingly, although high Ki-67–LI were observed in both groups, there were differences in labeling patterns. While PanNECs demonstrated high Ki-67–LI in all fields examined (homogeneous labeling), there was heterogeneity in Ki-67–labeling in G3 PanNETs. This heterogeneity in Ki-67–labeling may result in underestimation of WHO grade for G3 PanNETs on small or fragmented samples, such as biopsied tissues [14]. In addition, the entire Ki-67–stained slide should be examined at low power magnification before counting the Ki-67–LI in G2 or G3 PanNETs.
Four of eight G3 PanNETs were associated with low-grade components, and heterogeneity in Ki-67 labeling distribution (suggestive of the presence of low-grade components) was seen in another G3 PanNET in this study. It has been suggested that the presence of a low-grade PanNET component within the same tumor is helpful in discriminating between G3 PanNETs and PanNECs [4]. For the other three G3 PanNETs where such low-grade components or Ki-67 heterogeneity were absent, the typical organoid growth pattern and uniform nuclear features were helpful. In one of these cases, there was marked nuclear atypia, prominent nucleoli, and a solid growth pattern; however, this case was designated G3 PanNET on the basis of the mitotic activity (26/10 HPF) as the Ki-67–LI was less than 20%.
As for PanNECs, the small cell type was not difficult to determine due to the characteristic cytomorphological features; however, determining LC-PanNECs from G3 PanNETs was not easy. The absence of a low-grade component, presence of marked nuclear pleomorphism with hyperchromasia, frequent apoptosis, solid growth pattern and high proliferative activity with a homogeneous Ki-67 labeling distribution were important discriminating features in this study. In addition, LC-PanNECs may be difficult to distinguish from acinar cell carcinomas in practice as the histological features overlap. The presence of a granular cytoplasm and a prominent acinar architecture may be helpful for the diagnosis of acinar cell carcinomas, as well as immunohistochemical markers for acinar differentiation such as trypsin, chymotrypsin, and BCL-10.
Although tumor necrosis is not described as a histological feature of PanNETs [1], we found geographic or punctate tumor necrosis in both G3 PanNETs and PanNECs, with similar frequencies. In fact, necrosis has been identified in G3 PanNETs by Tang et al. [4], and therefore, the presence of tumor necrosis may not be helpful in discriminating between these two entities [4].
In order to explore the utility of immunohistochemical marker panels for the discrimination between G3 PanNETs and PanNECs, we performed stains for ATRX, DAXX, p53, Rb, Smad4, p16, and MUC1 and calculated the immunoscore. As expected, ATRX loss was seen in 25% of our G3 PanNETs and in none of the PanNECs. The frequency of ATRX/DAXX loss in PanNETs was lower than that of previous reports (36%-50%) from Western countries [6,11,15] but was similar to that of one previous study in a Korean cohort [16]. We stained the low-grade PanNETs (n=67, eliminated in the case selection process) for ATRX and DAXX and found ATRX or DAXX loss in 21% and 43% of G1 and G2 PanNETs, respectively. Loss of Rb expression and abnormal p53 expression have been reported to occur only in PanNECs with frequencies of 42%-90% and 56%-67%, respectively [4,6,11,15]. Similarly, in our cases, loss of Rb expression or abnormal p53 expression was seen only in PanNECs, again with lower frequencies than previously reported (29% and 43%, respectively). Loss of Smad4 expression was seen in three PanNECs, all cases being SC-PanNECs, and in none of the G3 PanNETs. As MUC1 and p16 expression have recently been reported to be more frequent in PanNECs compared to PanNETs [12], we added these two markers to the immunohistochemical panel. We found similar findings to Konukiewitz et al. [12]; diffuse p16 staining was present in 67% of PanNECs compared to 25% of G3 PanNETs, and MUC1 was also positive in 67% and 25% of PanNECs and G3 PanNETs, respectively.
We performed ROC analyses for all combinations for the seven markers (1- to 7-marker panels) and identified six combinations that discriminated PanNECs from G3 PanNETs with AUC > 0.95. As the purpose of the immunohistochemical study was to confirm the diagnosis of PanNEC in histologically ambiguous cases, we focused on the panels with high specificity, and found that the inclusion of p53, p16, MUC1, and Smad4 in the immunohistochemical panel helped to identify PanNECs with 100% specificity and 85.7% sensitivity.
Interestingly, five of eight cases of G3 PanNETs (63%) showed no aberrant expression of the seven immunohistochemical markers, including loss of ATRX and/or DAXX labeling. For such cases, application of additional markers reported to be aberrantly expressed specifically in G3 PanNETs, such as carbonic anhydrase 9 or progesterone receptor, could be helpful for differentiating G3 PanNETs and PanNECs [17,18].
This study has some limitations. First, to ensure adequate follow-up, cases were selected from 2000 to 2010; however, as archival formalin-fixed paraffin-embedded tissue blocks were used, Ki-67 immunostaining was suboptimal in some cases. Antigen decay, especially for nuclear antigens such as Ki-67, has been described in old archival paraffin blocks [19]. Two of our cases showed very weak nuclear Ki-67 labeling, and both were from year 2001. In addition, due to the multicenter nature of this study, it is plausible that the different block storage conditions in the participating institutions may have affected the antigenicity of the archival tissues. For cases in which suboptimal Ki-67 labeling was suspected, the Ki-67 immunostaining was repeated manually with various antigen retrieval methods (pH 6.0, pH 7.5, and pH 9.0); however, there were no differences according to the staining method. Therefore, the Ki-67–LI in G3 PanNETs or PanNECs may have been underestimated in this study, and the grading for some cases relied on the MI. Second, as the main focus of this study was to retrieve as many high-grade neuroendocrine neoplasms (NENs) as possible, the cases collected from each institution mainly comprised pancreatic tumors originally diagnosed as “well-differentiated endocrine tumor with uncertain behavior”, “well-differentiated endocrine carcinoma” or “poorly differentiated neuroendocrine carcinoma,” resulting in the enrichment of higher grade NENs in this study (8.5% compared to the reported incidence of < 2%-3%) [8]. Third, due to the rarity of G3 PanNETs and PanNECs, the statistical power of the analysis between G3 PanNETs and PanNECs in this study may be too weak to determine solid conclusions, and further multi-institutional studies with larger numbers of G3 PanNETs or PanNECs are required. Finally, this study is the result of a central review of single representative sections from 82 cases and therefore, histopathological assessment may have been incomplete for some cases, especially those with large tumors.
In summary, in this series of 15 high-grade PanNENs, the discriminative histological features supporting PanNEC over G3 PanNET were the absence of a low-grade PanNET component in the tumor, the presence of diffuse marked nuclear atypia, solid growth pattern, frequent apoptosis and markedly increased proliferative activity with homogeneous Ki-67 labeling. The presence of abnormal expression of at least two of p53, Smad4, p16, or MUC1 also may be helpful in distinguishing PanNECs from G3 PanNETs in histologically ambiguous cases, especially in diagnostic practice when only small biopsied tissues are available.