Introduction
Radical prostatectomy (RP) is frequently recommended as curative treatment for patients with localized prostate cancer. Although RP provides excellent cancer control, approximately one-third of patients experience recurrence during long-term follow-up [1]. An increase of serum prostate-specific antigen (PSA) > 0.2 ng/mL, termed biochemical recurrence, is usually the initial sign ofrecurrence. If left untreated, 65% of those patients will develop overt clinical failure and/or metastases and the majority will die from prostate cancer [2]. Postoperative radiotherapy (PORT), the only potentially curative treatment for such patients, sterilizes microscopic diseases around the surgical bed. As a salvage treatment for biochemical failure after RP, PORT significantly reduces the risk of disease progression by diminishing the incidence of distant metastasis and overall mortality [3,4]. In addition, adjuvant PORT, even before biochemical failure after RP, has a proven clinical benefit for patients with unfavorable features, such as positive surgical margins, extracapsular extension, or involvement of the seminal vesicles [5,6].
Nevertheless, long-term outcome data after PORT in patients who undergo RP are still limited and the natural history of those men is not fully understood. In addition, the optimal management of PORT in men with prostate cancer is still under investigation. Only a few analyses about the delivery of PORT, for example regarding the timing of radiotherapy (RT), total dose, field size, or a combination of other treatments, have been performed. There is a lack of consensus on the definition of biochemical failure after PORT, so most studies have had to use their own definition to evaluate the clinical endpoint. Due to the long interval before prostate cancer shows clinically evident recurrence after biochemical failure [7], longer follow-up periods with larger sample sizes would be appropriate for clinical assessments. In addition, most previous studies were based on data from Western countries, and clinical data after PORT in the Korean population are very limited. The Korean Radiation Oncology Group (KROG) 18-01 protocol was designed to evaluate clinical outcomes, including biochemical failure-free survival (BCFFS), clinical failure-free survival (CFFS), distant metastasis-free survival (DMFS), overall survival (OS), and cancer-specific survival (CSS) after PORT as a multi-institutional retrospective study. Prognostic variables predicting outcomes and long-term toxicity associated with PORT were also assessed.
Materials and Methods
1. Patient populations
This study included patients who were treated with PORT from January 2001 to December 2012 at 19 KROG member institutions. Inclusion criteria were patients who received PORT either adjuvant or salvage after RP for histologically confirmed localized adenocarcinoma of the prostate, and who completed the entire PORT schedule until December 2012. Patients who had evidence of distant metastases, prior pelvic radiation or prostate brachytherapy, previous or concurrent cytotoxic chemotherapy for prostate cancer, insufficient follow-up after PORT (< 12 months), or a history of another malignancy were excluded. We identified 1,117 patients with prostate cancer, drawn from 19 institutions, who met the study inclusion criteria. The patients were followed up through June 2018. The routine postoperative follow-up generally included a digital rectal examination and serum PSA measurements every 3 months during the first 2 years, every 6 months over the next 3 years, and annually thereafter.
2. Treatments
All patients underwent RP. The most common type of RP was retropubic RP (n=575), followed by robotic-assisted RP (n=365), transperineal RP (n=104), and laparoscopic RP (n=73). When PORT was given, radiation was delivered to the prostate bed only (n=456), and in addition to the seminal vesicular bed (n=226), true pelvis (including regional lymph nodes) (n=18), whole pelvis (including common iliac lymph nodes) (n=414), and whole pelvis plus para-aortic area (n=3). The dose fractionation scheme consisted of conventional fractionation (n=842), hypofractionation (n=274), and mixed conventional and hypofractionation (n=1). To adjust for different dose fractionation, the total equivalent dose was calculated in 2 Gy fractions for prostate cancer (α/β ratio=2.0). A median RT dose of 66.7 Gy (interquartile range [IQR], 64.6 to 70.0) was delivered to the clinical target volume (CTV). The RT techniques used at each institution were three-dimensional (3D)-conformal RT (n=568), intensity-modulated RT (n=530), two-dimensional-RT (n=7), proton beam therapy (n=5) and a combination of 3D-conformal RT and intensity-modulated RT (n=7). Androgen deprivation therapy (ADT) was administered before the PORT referral (n=106) or concurrently with PORT (n=579). Adjuvant PORT was defined as PORT given when PSA < 0.2 ng/mL within 1 year from RP, and with no history of ADT. Salvage PORT was defined as PORT given for biochemical or clinical failure after PORT.
3. Statistical analysis
Time to recurrence and follow-up were calculated from the first day of PORT. Biochemical failure after PORT was defined as serum PSA level ≥ nadir+2.0 ng/mL or the initiation of salvage ADT regardless of the PSA value, based on the result of a pooled analysis conducted using the Radiation Therapy Oncology Group (RTOG) 0534 protocol [8]. Distant metastasis was defined as radiographic or histological evidence of prostate cancer involving distant organs or non-regional lymph nodes. Clinical failure referred to any type of disease progression, including local failure, regional failure, and distant metastasis diagnosed by radiological or histological examinations. OS was defined as the interval between the first day of PORT and the date of death due to any cause. CSS was defined as the interval between the first day of PORT and the date of death from progressive prostate cancer or treatment complications. The curves for BCFFS, CFFS, DMFS, OS, and CSS were constructed using the Kaplan-Meier method and compared in univariate analysis using the log-rank test. A Cox proportional hazards model was used for the multivariate analysis. The variables included for predicting outcomes were: initial preoperative PSA (≤ 20 ng/mL vs. > 20 ng/mL), Gleason score (2-7 vs. 8-10), pathologic T category (T2 vs. T3a vs. ≥ T3b), resection margin status (negative vs. positive), pre-PORT PSA level (≤ 0.5 ng/mL vs. > 0.5-1.0 ng/mL vs. > 1.0 ng/mL), treatment aim (adjuvant vs. salvage), total RT dose (< 70 Gy vs. ≥ 70 Gy), RT volume (surgical bed vs. surgical bed+regional lymphatic area), and concurrent ADT (none vs. short-term vs. long-term). Initial PSA levels were divided into ≤ 20 ng/mL and > 20 ng/mL based on the PSA cutoff value for the high-risk group stratification [9]. Total RT dose was divided into < 70 Gy and ≥ 70 Gy, with reference to another dose escalation study [10]. The efficacy of elective nodal irradiation was assessed for patients with pN0-Nx disease. Patients who had a history of ADT use longer than 6 months before PORT were excluded from the assessment regarding concurrent ADT. Concurrent ADT included ADT given within the period from 6 months before PORT to any time after PORT as the (neo)adjuvant, but not as salvage for biochemical failure after PORT. Short- and long-term ADT referred to courses < 12 and ≥ 12 months, respectively. p-values of < 0.05 were considered significant. The hazard ratio and corresponding 95% confidence intervals were calculated using the Cox proportional hazards model in subgroup analysis of the association of long-term ADT with OS. The chi-square test was used to compare differences in the baseline characteristics between two groups. Radiation-related toxicity was evaluated according to the RTOG radiation toxicity criteria. Statistical analyses were carried out using STATA software (ver. 9.0, Stata Corp., College Station, TX).
4. Ethical statement
KROG 18-01 was approved by the institutional review boards of each participating hospital and performed in accordance with the ethical principles of the Declaration of Helsinki and the International Conference on Harmonization guideline E6: Good Clinical Practice. Written informed consent was waived due to retrospective nature of the study.
Results
The patient characteristics are summarized in Table 1. The median age at diagnosis and at PORT was 66 years (IQR, 61 to 70 years) and 67 years (IQR, 62 to 72 years), respectively. A total of 433 patients (38.7%) had a Gleason score of 8-10 in the pathologic specimen and 777 patients (69.6%) were of pathologic stage T3-4. Most patients had negative lymph nodes, except 60 patients who had N1 disease (5.4%). Sixty-three patients (5.6%) presented with local recurrence after RP at the time of referral for PORT. The median initial PSA (preoperative) and pre-PORT PSA were 12.4 ng/mL (IQR, 7.5 to 23.9 ng/mL) and 0.30 ng/mL (IQR, 0.06 to 0.64 ng/mL), respectively. The median interval from surgery to initiating PORT was 11.5 months (IQR, 4.5 to 27.6 months). Escalated dose RT (≥ 70 Gy) and elective nodal irradiation were delivered to 38% and 39% of all patients, respectively. ADT given for longer than the 6-month period before PORT referral (pre-PORT ADT) was identified in approximately 10% of patients (n=106). Concurrent ADT was administered to 42% of patients (n=473): short-term in 16% (n=178) and long-term in 26% (n=295). ADT was not given to 538 patients (48%).
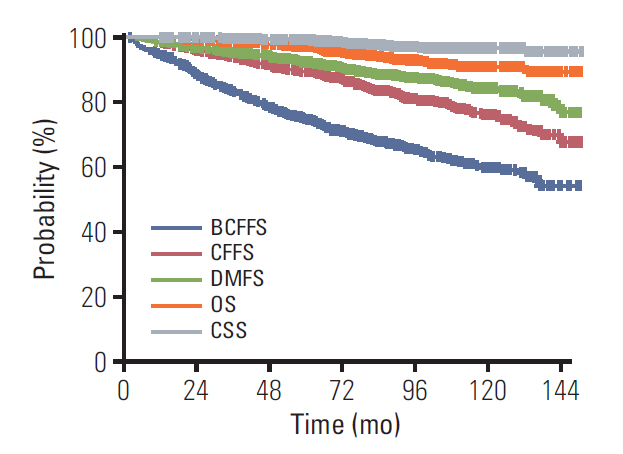
The median follow-up duration was 84 months (IQR, 67 to 108 months) from the first day of PORT and 103 months (IQR, 79 to 130 months) from RP. Overall, the estimated 10-year BCFFS, CFFS, DMFS, OS, and CSS were 60.5%, 76.2%, 84.4%, 91.1%, and 96.6%, respectively (Fig. 1). A total of 343 patients (31%) experienced biochemical failure and 186 patients (17%) developed clinical failure. Clinical failure was seen in 100 patients with loco-regional failure and 128 patients with distant metastasis (42 patients had both types of recurrence). Sixty-nine men (6.1%) died during the observation period and 25 (2.2%) died due to progression of prostate cancer. The Kaplan-Meier curves for BCFFS, DMFS, CFFS, OS, and CSS were generated according to the pre-PORT PSA level for four groups (< 0.2 vs. 0.2-0.5 vs. 0.5-1.0 vs. ≥ 1.0). As shown in Fig. 2A, higher pre-PORT PSA level showed unfavorable results in all five endpoints (p < 0.05). The pre-PORT PSA < 0.2 and 0.2-0.5 groups showed no significant differences in BCFFS, DMFS, CFFS, OS, or CSS; hence, we combined them into one group with pre-PORT PSA < 0.5 for the prognostic factor analysis. Additionally, Kaplan-Meier curves were generated for BCFFS, DMFS, CFFS, OS, and CSS in three groups classified according to the Gleason score (2-6 vs. 7 vs. 8-10). As shown in Fig. 2B, the results showed that a higher Gleason score was associated with unfavorable outcomes in all five endpoints (p < 0.05). Due to the small number of patients with Gleason scores of 2-6, they were combined with those with a Gleason score ≤ 7 for the prognostic factor analysis.
The results of the univariate analysis of prognostic factors are shown in Table 2. Among variables related to conditions before the PORT referral, higher Gleason score, advanced pathological T category, and higher pre-PORT PSA level were significant predictors of unfavorable clinical outcomes on all five clinical endpoints, including BCFFS, CFFS, DMFS, OS, and CSS. Initial PSA level and resection margin status were not associated with any clinical endpoints. Adjuvant PORT showed significantly better BCFFS and CFFS than salvage PORT. An escalated RT dose was significantly associated with an improved BCFFS, but not with any other endpoint. Elective nodal irradiation was associated with worse CFFS and DMFS compared to surgical bed-only RT in pN0-Nx patients (n=1,051). The use of concurrent ADT, particularly long-term, was associated with improved BCFFS, CFFS, and OS.
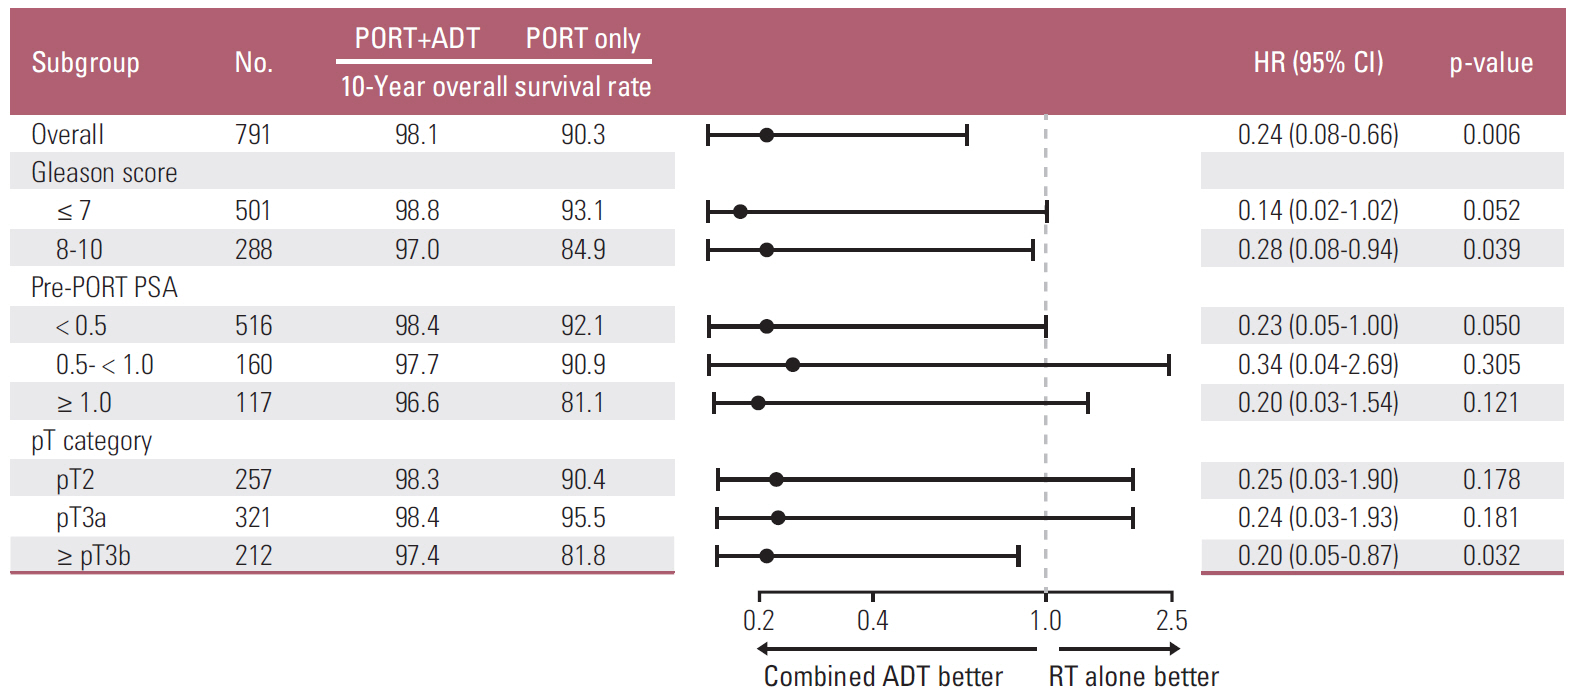
The results of the multivariate analysis for prognostic factors are summarized in Table 3. The most important determinants of an increased risk of biochemical failure were Gleason score 8-10, pT3a and ≥ pT3b, and pre-PORT PSA 0.5 to < 1.0 and ≥ 1.0. Adjuvant PORT, escalated RT dose, and concurrent short- and long-term ADT were associated with improved BCFFS. In terms of CFFS, Gleason score 8-10, ≥ pT3b, and pre-PORT PSA 0.5 to < 1.0 and ≥ 1.0 were significantly related to increased risk of clinical failure. On the other hand, concurrent long-term ADT was associated with a decreased risk. Regarding DMFS, Gleason score 8-10, ≥ pT3b, and pre-PORT PSA ≥ 1.0 were associated with a poor outcome of DMFS. In both OS and CSS, patients who had a Gleason score of 8-10 or pre-PORT PSA ≥ 1.0 had a significantly higher risk of death after treatment. In contrast, combined long-term ADT was related to an increased OS. We conducted subgroup analyses according to Gleason score, pre-PORT PSA level, and pathological T category to further analyze survival improvements due to concurrent long-term ADT with PORT (Fig. 3). Patients who had a history of prePORT ADT and pathological N(+) were excluded from this analysis. As shown in Fig. 3, the effect of concurrent long-term ADT on OS was most pronounced in the unfavorable subgroups, including Gleason score 8-10 and pathology ≥ T3b.
In general, long-term radiation-related toxicity was acceptable during the observation period (Table 4). In total, 145 patients (13%) experienced grade II genitourinary toxicity, and 44 patients (4%) developed grade III genitourinary toxicity, mostly gross hematuria requiring intervention. Forty-eight patients (4%) reported grade II gastrointestinal toxicity, and nine patients (1%) had grade III gastrointestinal toxicity with rectal bleeding requiring endoscopic coagulation. Concerning the interval from PORT to severe adverse events (≥ grade III), a much longer time was taken for genitourinary toxicity to manifest (51.9 months) than gastrointestinal toxicity by PORT (10.7 months).
Discussion
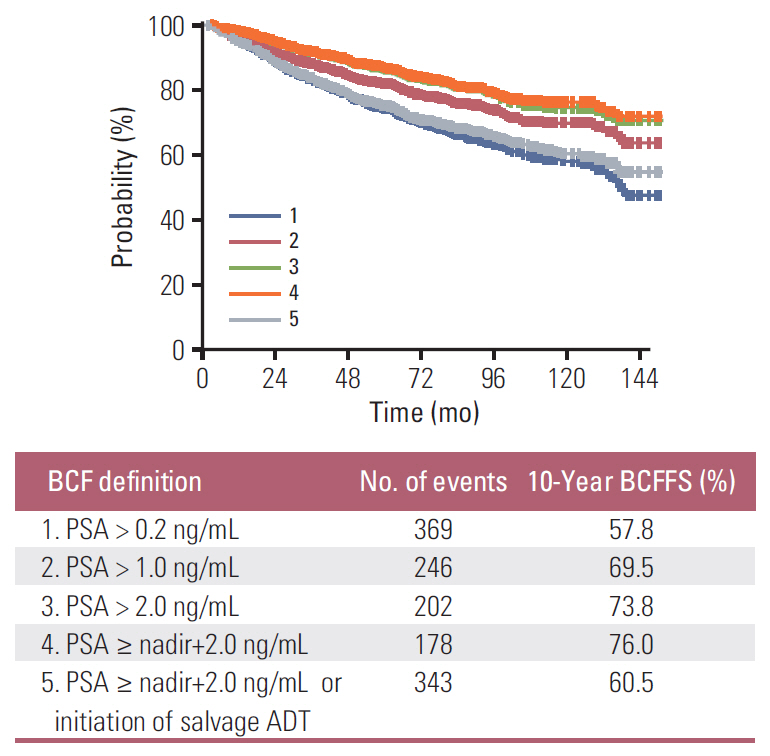
This study analyzed the long-term outcomes of PORT in Korean patients with prostate cancer who underwent RP. The estimated 10-year OS and CSS rates were 91% and 97%, respectively, and were comparable to or higher than those reported for western countries. Previous large retrospective series reported 10-year OS rates of 77%-89% and 10-year CSS rates of 82%-90% after PORT [3,11], including patients with relatively poor prognoses who had median pre-PORT PSA levels of 0.6-0.7 ng/mL compared to a median of 0.3 ng/mL in the present study. Approximately 60% of patients remained free of biochemical failure at 10 years after PORT. The efficacy of PORT was quite impressive, as most patients had already experienced a biochemical failure before PORT. Because KROG 18-01 adopted the definition of biochemical failure used for definitive RT cases, such as the Phoenix definition [8] of a serum PSA level ≥ nadir+2.0 ng/mL, BCFFS may be higher than in other studies in which a lower PSA cutoff value was used for biochemical failure [12]. The BCFFS rates according to various definitions of biochemical failure are illustrated in Fig. 4. As shown, the 10-year BCFFS rate increased with a higher PSA cutoff value. However, when we considered initiation of ADT before PSA had reached the nadir+2.0 ng/mL as biochemical failure (BCF definition #5), the 10-year BCFFS rate was similar to that of BCF definition #1 (60.5% vs. 57.8%, respectively). The optimal biochemical failure cutoff for predicting the ultimate survival outcome remains controversial and will be a topic for further research.
In the prognostic factor analysis, a lower Gleason score and the use of PORT at a lower PSA level were strongly associated with a favorable outcome on all endpoints. The survival disadvantage related to higher pre-PORT PSA level was only seen when the value was ≥ 1.0 ng/mL. A pre-PORT PSA level of 0.5-1.0 ng/mL was a significant predictor of poor BCFFS, CFFS, and DMFS outcomes, but was not predictive of OS or CSS. Stephenson et al. [12] conducted a multi-institutional cohort study with 1,540 patients to assess the prognostic determinants after PORT with a median follow-up of 56 months. Their primary endpoint of “progression-free probability” referred to a serum PSA value ≥ 0.2 ng/mL above the nadir, initiation of systemic therapy, or clinical progression [12]. In their study, pre-PORT PSA level, Gleason score, PSA doubling time, surgical margins status, ADT before or during PORT, and lymph node metastasis were significant determinants of progression-free probability [12]. When Pre-PORT PSA level was stratified into four groups, of ≤ 0.50, 0.51-1.00, 1.01-1.50, and > 1.50 ng/mL, a significant difference in progression-free probability was observed among the groups [12]. Stish et al. [11] conducted a retrospective analysis of 1,106 patients with prostate cancer who received PORT. They estimated the clinical outcomes, including OS and the cumulative incidence rates of biochemical failure, distant metastases, and cause-specific mortality, with a long follow-up of approximately 9 years. In the prognostic factor analysis, pathological tumor stage, Gleason score, and pre-PORT PSA level were significant predictors of biochemical failure, distant metastasis, cause-specific mortality, and OS [11]. The 10-year cumulative incidence rates for biochemical failure, distant metastasis, and cause-specific mortality were significantly different between pre-PORT PSA level ≤ 0.5 ng/mL and > 0.5 ng/mL groups [11]. Overall, our study yielded similar results to these previous studies, demonstrating decrea-sed survival with a higher pre-PORT PSA level. Starting PORT before reaching a serum PSA level < 0.5 ng/mL (or 1.0 ng/mL at the latest) appears to be critical to achieve a favorable outcome, although the earlier PORT is initiated, the better.
Approximately 7% of patients in this study receiving adjuvant PORT demonstrated significantly better BCFFS and CFFS compared to patients who received salvage PORT (Table 2). Interpretation of these results requires caution because we cannot exclude the possibility of lead-time bias in the comparisons. Randomized clinical trials have shown that adjuvant RT after RP provides significantly lower rates of disease progression and a possible improvement in survival compared with watchful waiting in patients with adverse features in pathologic specimens [5,6]. However, arguments against adjuvant PORT include increased morbidity from treatment, high financial cost, unnecessary treatment of 50%-60% of patients, and high initial salvage rates in some patients [13]. For these reasons, clinicians have been hesitant to proceed with PORT in patients with undetectable PSA after RP [14], as we report in the present study. As an alternative, close surveillance and selective PORT for biochemical recurrence is a preferable option after RP. Briganti et al. [15] conducted a propensity-matched analysis to compare adjuvant RT versus initial observation followed by early salvage RT in pathological T3 prostate cancer [15]. In their study, early salvage RT given at a postoperative PSA ≤ 0.5 ng/mL showed a comparable PSA control rate to those of adjuvant RT [15]. The findings of the present study support those results. As shown in Fig. 2A, few differences were observed between the pre-PORT PSA subgroups (< 0.2 ng/mL vs. 0.2-0.5 ng/mL) among the clinical endpoints. Although neither the interval since RP nor the effect of prePORT ADT use were considered, these results suggest that early salvage PORT when PSA < 0.5 ng/mL has persistent efficacy and could be a reasonable treatment option after RP.
The prescribed RT dose of ≥ 70 Gy significantly improved BCFFS, but not the other endpoints, in our study. Although primary RT for localized prostate cancer has sufficient data supporting dose-escalated RT [16], the dose-response relationship is not fully understood in PORT. King and Kapp [17] analyzed the dose-response relationship of PORT and BCFFS in published data and compared it with that of primary RT for macroscopic disease. Of note, they demonstrated very similar dose-response curves for PORT and primary RT, and dose-escalated PORT achieved significantly better BCFFS [17]. Some researchers have suggested that a 66.6 or 70 Gy threshold dose of PORT is associated with improved BCFFS [18,19]. Latacz et al. [20] compared 66 and 70 Gy doses delivered to the prostate bed in patients referred for salvage PORT. The 70 Gy PORT group showed significantly improved BCFFS compared to the 66 Gy PORT group in a multivariate analysis with a mean follow-up of 28 months [20]. The SAKK 09/10 is an ongoing randomized clinical trial performed by the Swiss Group, comparing 64 and 70 Gy PORT in patients with prostate cancer [10]; in the near future, its results should answer questions related to dose-response.
The optimal CTV for PORT remains an unresolved issue. In particular, whether CTV should include regional nodes or not remains controversial, particularly in high-risk patients. In the present study, elective nodal irradiation was a significant predictor for decreased CFFS and DMFS in univariate analysis; however, the results were non-significant in multivariate analysis. The discrepancy might have been due to confounding factors, such as selection bias in retrospective analyses, particularly in relation to baseline characteristics (Table 5); men who initially had advanced or high-risk disease were more likely to receive a wider field of radiation, including regional lymphatic coverage. Overall, excellent loco-regional control after elective nodal irradiation was offset by increased distant metastasis. In addition, larger RT field was associated with an increased risk of adverse effect (Grade 2 or higher) in our sub-analysis (S1 Table). Caubet et al. [21] conducted a retrospective analysis comparing prostate bed RT with whole-pelvic RT in patients with high-risk prostate cancer after RP. Postoperative whole-pelvic RT failed to show any benefits in terms of disease progression, exhibiting only a lower OS and increased toxicity compared to prostate bed RT [21]. On the other hand, Pollack et al. [22] announced the preliminary results of a three-arm randomized trial, the NRG Oncology/RTOG 0534 SPPORT trial, in which they compared freedom from progression after prostate bed RT (arm 1), prostate bed RT plus short-term ADT (arm 2) or whole-pelvic RT plus short-term ADT (arm 3) in postoperative patients with recurrent prostate cancer. They reported that whole-pelvic RT results in meaningful reductions in failure compared to prostate bed RT with or without short-term ADT after a median follow-up of 5.4 years [22]. Nevertheless, because of the potential increased risk of complications from the extended RT field, postoperative whole-pelvic RT cannot be recommended outside of a clinical trial until the advantages become evident.
When combined with RT in prostate cancer, the major benefits of ADT are control of subclinical distant metastasis and some local effects [23]. Because a combined RT and ADT regimen is the treatment of choice for locally advanced prostate cancer [24], this combination may be a rational approach for high-risk prostate cancer. The RTOG 9601 trial reported that adding 24 months of bicalutamide to PORT significantly prolongs patient survival compared to PORT alone, and also decreases distant metastasis [25]. The 12-year cancer-specific mortality rate decreased even further, from 13.4% to 5.8%, in the group receiving bicalutamide (p < 0.001) [25]. The effect of short-term ADT combined with PORT was also investigated in the GETUG-AFU 16 trial [26]. patients assigned to PORT plus short-term ADT had a significantly lower likelihood of disease progression than those in the PORT alone group at 5 years (80% vs. 62%, p < 0.001) [26]. Our results are generally consistent with the findings of those randomized studies. In the multivariate analysis, concurrent long-term ADT and PORT contributed not only to lower hazard ratios of BCFFS and CFFS, but also that of OS compared to PORT alone. Clinical benefits of concurrent short-term ADT were also seen for BCFFS, but not for any other endpoint. We identified 106 patients who had a history of ADT use longer than 6 months before PORT, and excluded these patients from the analysis regarding the efficacy of concurrent ADT. For those patients, postoperative ADT was given prior to PORT referral for various reasons (but mostly due to disease progression), which led to a subsequent delay of PORT, which may have negatively affected the outcome of PORT.
In the RTOG 9601 trial, a post-hoc analysis performed to determine the efficacy of concurrent long-term ADT showed that the greatest OS improvement was seen in patients with more aggressive disease, such as the subgroup with prePORT PSA > 1.5 ng/mL or Gleason score ≥ 7 [25]. However, the OS improvement in the subgroup with a Gleason score of 8-10 was not statistically significant, probably due to the small number of patients in that subgroup [25]. As shown in Fig. 3, in the current study OS improvement due to concurrent long-term ADT was most notable in patients with unfavorable features (Gleason score 8-10 and ≥ pT3b). Although significant OS improvement was not seen in all subgroups regarding pre-PORT PSA, the improvement was much greater in the higher pre-PORT PSA group (6.3% in subgroup PSA < 0.5 vs. 15.5% in subgroup PSA ≥ 1.0). To achieve sufficient statistical power, a larger sample in the subgroup with pre-PORT PSA ≥ 1.0 would be required (n=117). On the other hand, patients with a Gleason score ≤ 7, ≤ pT3a, or pre-PORT PSA < 1.0 were less likely to obtain a survival benefit from concurrent ADT. Further studies are warranted to determine the patients who would benefit most from adjuvant ADT.
Approximately 4% and 1% of patients suffered from severe genitourinary and gastrointestinal toxicity in this study. Late genitourinary toxicity ≥ grade 3 after PORT has been reported as 7%-10% cases in other studies [25,27]. We observed that most of the gross hematuria caused by radiation occur many years after PORT (median, 52 months). Cozzarini et al. [27] analyzed clinical factors predicting severe urinary toxicity after PORT in 742 patients, and suggested a history of ≥ grade 2 acute toxicity, older age, and greater radiation dose as predictors for an increased rate of severe toxicity after salvage PORT. Filling of the bladder is a common procedure to prevent toxicity; however, this procedure can be difficult because patients often experience problems maintaining consistent bladder-filling after a prostatectomy [28]. Even given the technological advances in RT for prostate cancer, the conformal technique was less effective at reducing the risk of bladder toxicity compared to late radiation-induced proctitis [29]. Because most patients undergoing PORT have a long life expectancy (over 90% had 10-year OS in the present study), clinicians may have to pay close attention to men at risk.
A limitation of this study was its retrospective nature, which may have led to unknown selection biases. However, we attempted to minimize potential bias in the analysis by using a large sample size and a multivariate analysis, to account for variables potentially affecting the outcomes. In addition, given the fact that pre-PORT PSA values are a significant prognostic factor predicting OS and DSS, there could be a lead-time bias when calculating survival from the day of the first PORT instead of the day of RP. To eliminate this lead-time bias, we re-calculated the survivals from the day of RP. In this analyses, pre-PORT PSA was consistently a significant factor predicting OS (p=0.003) and CSS (p < 0.001) (S2 Fig.). Although PSA doubling time has proven to be an important predictor for the prognosis of PORT [4,12], we were unable to calculate this parameter because of the low number of PSA tests performed, due in turn to early PORT in some patients and inconsistent use of ADT. Meanwhile, this study provides valuable data on clinical outcomes after PORT in a Korean population with prostate cancer. Although the prognosis after PORT is primarily affected by intrinsic factors related to tumor and host factors, we identified several modifiable treatment-related factors. Early administration of PORT before the PSA level reaches 0.5 ng/mL seemed to be an essential component of successful treatment.
In conclusion, the clinical outcomes of PORT in a Korean population with prostate cancer were very similar to those published in Western countries. Gleason score and lower serum PSA level at the time of PORT were significantly associated with favorable outcomes in all clinical endpoints. Adding long-term ADT (≥ 12 months) to PORT should be considered in patients with an unfavorable prognosis with Gleason scores of 8-10 or ≥ T3b. Further studies are warranted to refine treatments based on their unique risks and benefits.