Introduction
With increasing implementation of endoscopic screening programs and rapid progress in endoscopic techniques recently, the incidence of endoscopic resection in early colorectal cancer (CRC) has been increasing. Although endoscopic resection of Tis (carcinoma in situ) lesion is accepted as a curative therapy, endoscopic resection of T1 CRC should be used selectively because lymph node metastasis (LNM) occurs 7%-15% in T1 CRC cases [1-5]. For patients with T1 CRC, predicting LNM after endoscopic resection is crucial in determining whether T1 CRC patients should undergo additional surgery.
The histopathological risk factors for LNM include vascular invasion, high-grade histology, deep submucosal invasion, and budding [4-9]. According to current guidelines, the prediction of LNM in T1 CRC cases is assessed in a dichotomous way, including high- or low-risk. If a patient has any risk factors post-endoscopic T1 CRC resection, the patient is classified as high-risk and advised to undergo additional surgery [6,10-13]. However, there is a serious drawback in this dichotomous method of prediction in that, when the positive predictive value (PPV) is very low, overtreatment is likely to result [14].
Therefore, a new prediction model is required to determine the risk of LNM in T1 CRC patients to reduce the current likelihood of overtreatment, while not hampering the oncological safety. This study aimed to establish a new prediction model for the probability of LNM in T1 CRC patients that could assist with determining individually-tailored treatment strategies for patients with T1 CRC.
Materials and Methods
1. Study cohort
Between January 2001 and December 2016, 995 T1 CRC patients underwent endoscopic or surgical resection at the National Cancer Center, Korea. The exclusion criteria included preoperative chemoradiation therapy (n=3), synchronous advanced CRC (n=85), metastasis (n=8), and loss of follow-up (n=5). Patients with T1 CRC who had undergone endoscopic resection and a follow-up period of < 24 months, were also excluded (n=55). The patients whose the status of LNM could not be estimated were excluded as well (n=6). Finally, a total of 833 T1 CRC patients (154 endoscopic resections and 679 surgical resections) were included in the development set. The database of the National Cancer Center and patients’ clinical charts were reviewed retrospectively (Fig. 1).
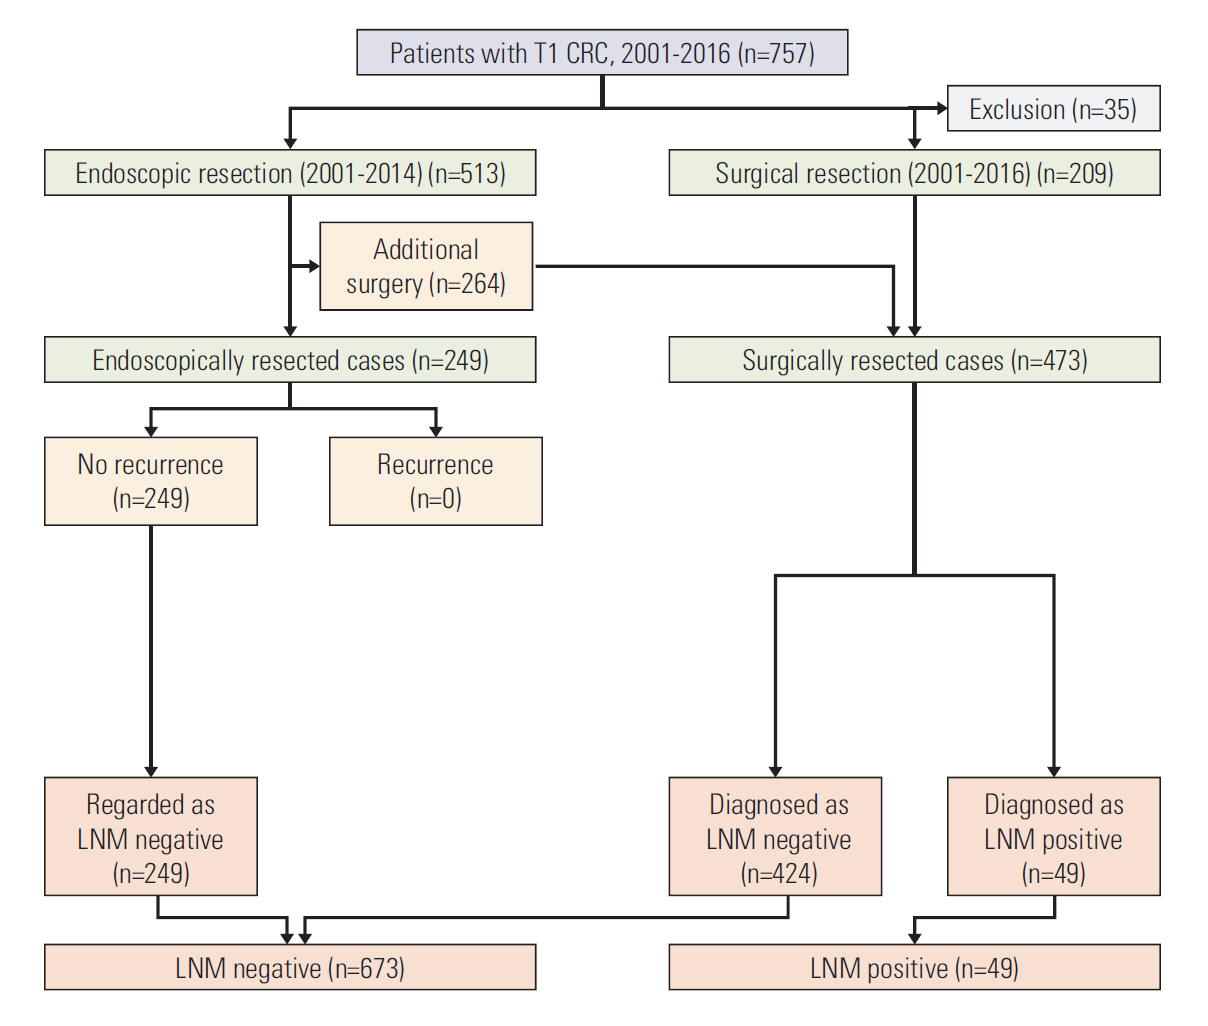
For external validation, we utilized the CRC database from Daehang Hospital, a specialist colorectal hospital. Based on the same inclusion criteria as that of the development set, a total of 722 T1 CRC patients (249 endoscopic resections and 473 surgical resections) were included in the validation set. The database of the Daehang Hospital and patients’ clinical charts were reviewed retrospectively (Fig. 2).
2. Clinicopathological variables
Endoscopic tumors were classified into two types: polypoid and non-polypoid, according to the Paris classification [15]. The polypoid type include pedunculated (0-Ip) and sessile (0-Is) tumors. The non-polypoid type include slightly elevated (0-IIa), flat (0-IIb), slightly depressed (0-IIc), and excavated (0-III) tumors. The tumor locations were classified into three groups, namely, right colon (cecum to splenic flexure), left colon (splenic flexure to the rectosigmoid junction), and rectum (rectosigmoid junction to the anal verge). In surgically resected specimens, the depth of submucosal invasion (SM depth) was evaluated using Kudo’s classification, as follows: infiltration into the upper third (sm1), middle third (sm2), or lower third (sm3) of the submucosal layer. For endoscopically resected sessile and flat tumors, the cut-off between sm1 and sm2 was 1,000 μm, according to the Paris classification, with an SM depth > 2,000 μm defined as sm3. For endoscopically resected pedunculated tumors, the cut-off between sm1 and sm2 was at the level of the neck, and an SM depth > 3,000 μm from the neck was defined as sm3. Deep submucosal invasion was defined as an SM depth ≥ sm2. Differentiation of adenocarcinomas was classified according to World Health Organization criteria: grade 1 (well differentiated), grade 2 (moderately differentiated), or grade 3 (poorly differentiated) [16]. Grades 1 and 2 were defined as histologically low grade tumors, while a grade 3 tumor, a mucinous carcinoma, signet ring cell carcinoma, and carcinoma with neuroendocrine differentiation were defined as histologically high-grade tumors. An isolated cell or a small cluster of < 5 tumor cells in the invasive front was defined as a “budding” focus, and > 10 budding foci viewed at 200× magnification was defined as budding positive [17]. Vascular invasion was defined as the presence of cancer cells within endothelial-lined channels, including angiolymphatic invasion and venous invasion. Vascular invasion of small vessels without a vascular smooth muscle layer was defined as angiolymphatic invasion, and vascular invasion of large vessels with a vascular smooth muscle layer was defined as venous invasion. Background adenoma (BGA) was defined as an adenomatous component microscopically contiguous to the resected carcinoma. Clinicohistological parameter details were evaluated with respect to the LNM status.
3. Estimation of the status of LNM in endoscopically resected group
The LNM status of the endoscopically resected group was determined indirectly, based on follow-ups and pathological results of salvage surgery.
Patients in the endoscopically resected group were followed-up by colonoscopy, performed between 3 and 6 months after resection and annually thereafter, and with an annual computed tomography scan of the abdomen and chest and an annual measurement of serum carcinoembryonic antigen concentration. Patients were followed-up for a minimum of 24 months.
Patients with no evidence of recurrence during the follow-up period were regarded as negative for LNM. In patients with recurrence, those diagnosed as LNM negative (rpN0) on salvage surgery were regarded as initially LNM negative, while those diagnosed as LNM positive (rpN+) on salvage surgery were excluded because it was not possible to demonstrate that LNM was already existed at the time of the initial endoscopic procedure or that LNM had developed in the regional area following the endoscopic procedure. The patients with recurrence who did not undergo salvage surgery due to multiple metastases were also excluded due to the possibility of skip metastases.
4. Statistical analysis
The distributions of risk factors affecting LNM were summarized as mean±standard deviation, or median (interquartile range [IQR]) for continuous variables, and frequency (percentages) for categorical variables. The differences of characteristics between development and validation datasets were tested using an independent t test or a Wilcoxon rank-sum test for continuous variables and Pearson’s chi-squared test for categorical variables. A logistic regression model was used to construct a model to predict the LNM. First, we examined whether 10 risk factors affected LNM in the univariable model, and then all variables were included in the multivariable model. The final multivariable prediction model was determined using a backward variable selection method with an elimination criterion of a p > 0.05. To assess the performance of the prediction model, discrimination was evaluated using the receiver operating characteristic (ROC) curves with area under the ROC curve (AUC), and calibration was assessed using the Hosmer-Lemeshow (HL) goodness-of-fit test. The prediction model is considered good in discrimination when the AUC is greater than 0.75. Model calibration assessment was considered adequate when p > 0.05. The validation of the prediction model was conducted using internal and external validation. First, the internal validation was performed using a bootstrap approach of 2,000 times resampling to correct the bias [18]. The external validation was performed using an independent new dataset to support generalizability. We illustrated the nomogram to facilitate the interpretation of the results, and calculated the predicted probability of LNM risk for individuals. p-values < 0.05 were considered statistically significant. All statistical analyses were performed using SAS ver. 9.4 (SAS Institute Inc., Cary, NC) and R software, ver. 3.3.3 (R Project for Statistical Computing, Vienna, Austria).
Results
1. Clinicopathologic characteristics
Among the 833 patients included in development database set, 160 underwent endoscopic resection and 679 underwent surgical resection. Among the 160 endoscopically resected cases, 150 had no recurrence, and were regarded as LNM negative. Among 10 patients who had recurrence after endoscopic resection, four were diagnosed as LNM negative (rpN0) on salvage surgery, and considered initially LNM negative. Five patients diagnosed as LNM positive on salvage surgeries, and one who did not undergo salvage surgery due to multiple metastases, were excluded (Fig. 1).
Among the 722 patients included in validation database set, 249 underwent endoscopic resection and 473 underwent surgical resection. Among the 249 endoscopically resected cases, all 249 had no recurrence, and were regarded as LNM negative (Fig. 2).
The incidence rate of LNM was 11.6% (97/833) in the development set and 6.8% (49/722) in the validation set. The mean age was significantly lower in the development set than in the validation set (61.8±10.6 vs. 67.8±10.6, p < 0.001). The proportion of endoscopic-type tumors was also different between the two datasets (p=0.005). For treatment, more patients underwent additional surgery after endoscopic resection than for endoscopic resection only or for surgery only. The median and IQR (Q1-Q3) of pathologic tumor size was 14 mm (10-20 mm) in the development set and 19 mm (14-27 mm) in the validation set (p < 0.001). The SM depth was distributed evenly in the development set, but the percentage of sm1 was greater (44.0%) in the validation set. There was a statistically significant difference in the incidence of vascular invasion between the development and validation sets (44.1% vs. 16.3%, p < 0.001). No differences of distribution were observed regarding sex, tumor location, histologic grade, background adenoma, and tumor budding between the development and the validation sets (Table 1).
2. LNM risk prediction model
To construct the LNM risk prediction model, 10 candidate predictors were examined in univariable and multivariable logistic regression models (Table 2). As a result, 5 risk factors were included in the final multivariable model. Vascular invasion and high-grade histology were the strongest risk factors (odds ratio [OR], 8.45; 95% confidence interval [CI], 4.56 to 15.66); p < 0.001 and OR, 7.89; 95% CI, 2.89 to 21.52; p < 0.001, respectively). Deep submucosal invasion (sm2/3) and tumor budding were also statistically significant predictors of LNM (OR, 2.14; 95% CI, 1.19 to 3.86; p=0.012 and OR, 1.70; 1.03 to 2.80; p=0.039, respectively). The absence of BGA was associated with 42% lower odds of LNM (OR, 0.58; 95% CI, 0.36 to 0.92; p=0.022).
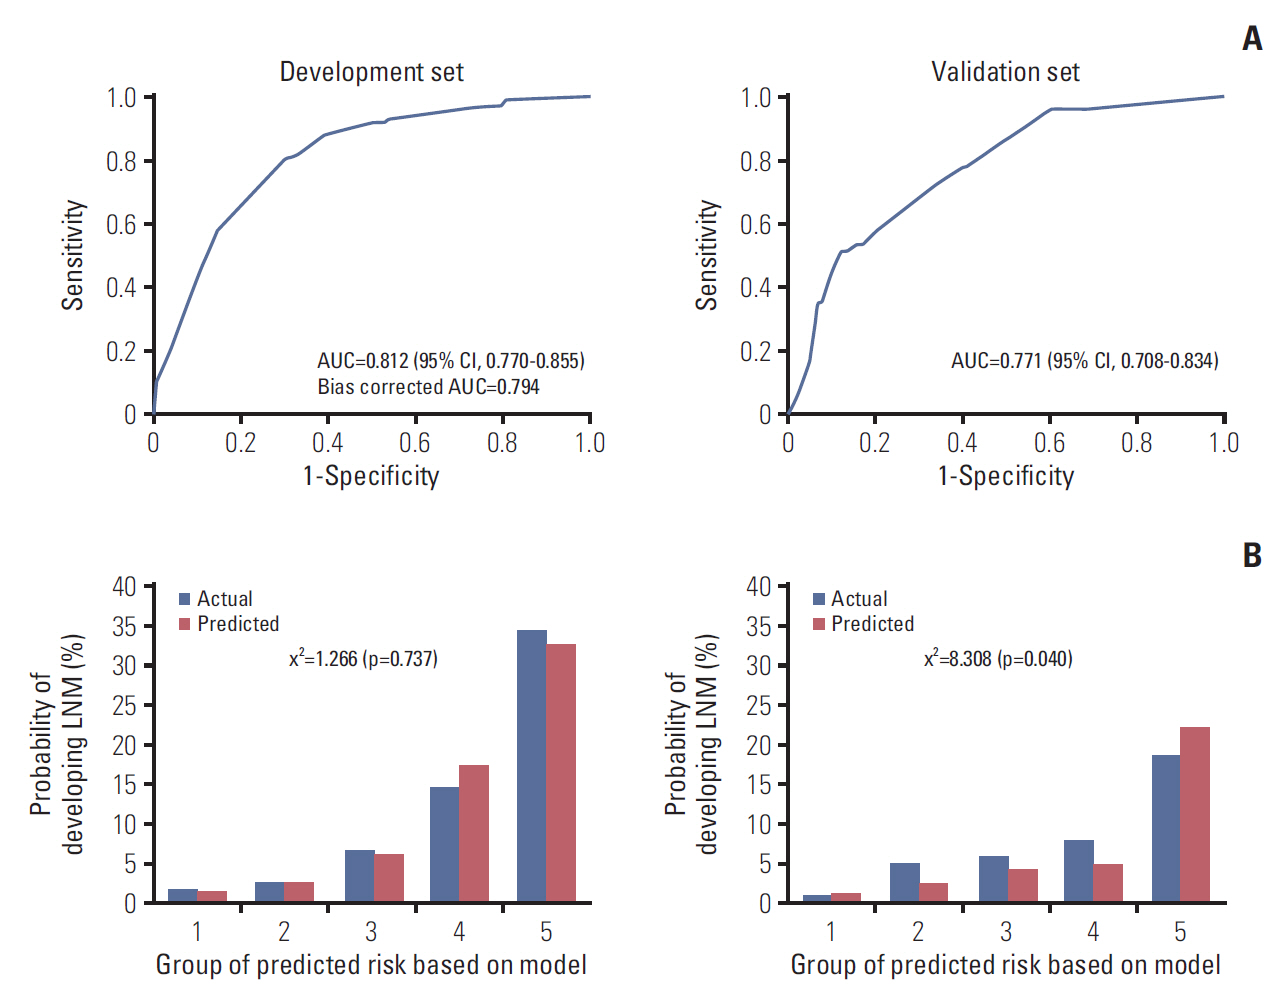
The prediction model using the development set was evaluated with good performance in terms of discrimination and calibration (Fig. 3). The AUC was 0.812 (95% CI, 0.770 to 0.855) and the hazard ratio chi-square test statistic was 1.266 (p=0.737). The bias corrected AUC was 0.794 in internal validation using the bootstrap method. Due to the limitations of internal validation to determine the generalizability of a prediction model, we conducted external validation using an independent new dataset. As a result, the AUC dropped to 0.771 (95% CI, 0.708 to 0.834) and the p-value of the HL chi-squared test was 0.040. Although the validation dataset was very different from the development dataset, the performance of the model remained good.
3. Nomogram
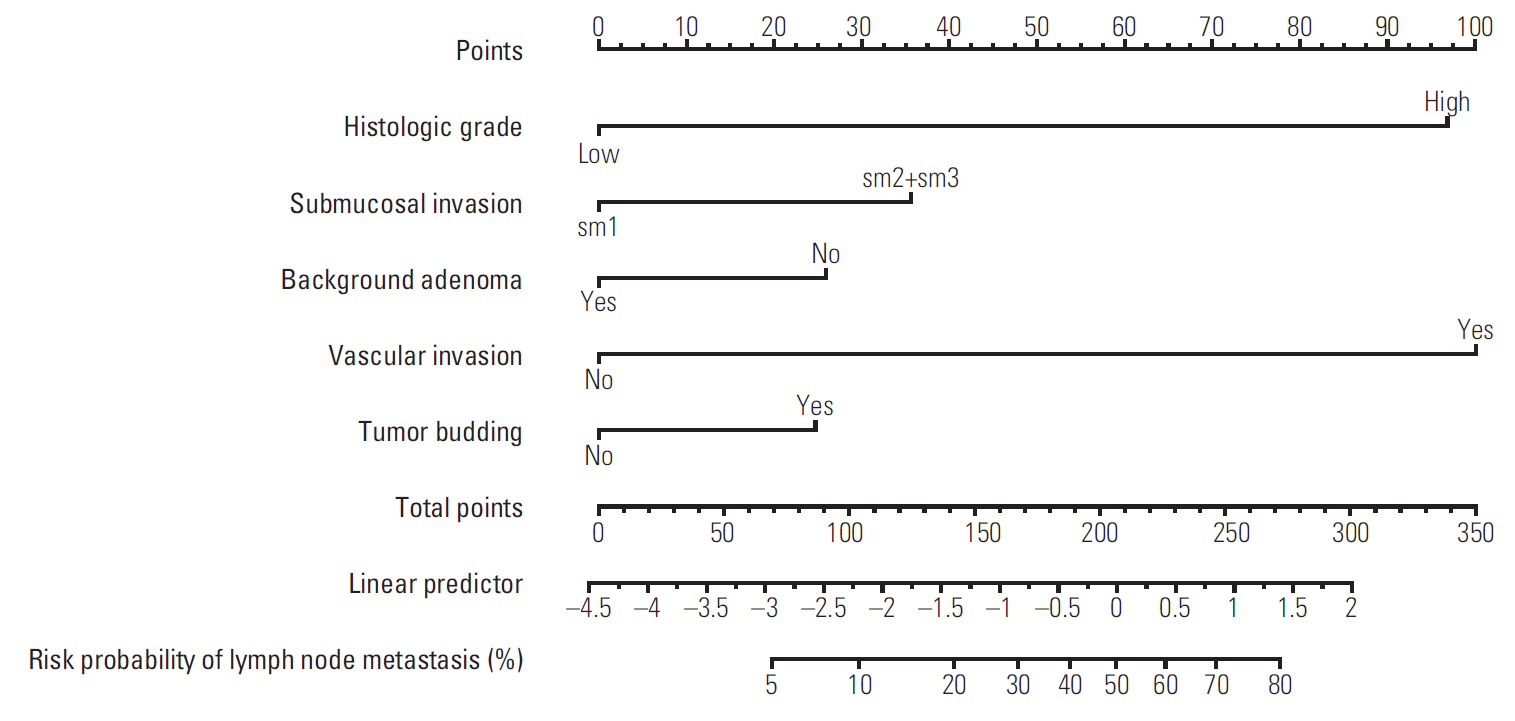
To facilitate user-friendly graphical interfaces, we constructed the nomogram with the final prediction model (Fig. 4). Through ranking the effect estimators, point scores were assigned to each risk factor. The total points accumulated from all the risk factors corresponded to the predicted probability of LNM for individual patients. The incidence rate of LNM was 11.6% in this study; therefore, we suggested sensitivity, specificity, a PPV, and a negative predictive value at each cut-off point to be between 5% and 15% in units of 1% (S1 Table). We calculated the probability of LNM occurrence for all combinations generated using the five risk factors of the final prediction model (S2 Table).
Discussion
After endoscopic resection of T1 CRC, a clinical decision is required to determine whether the patient should undergo additional surgery or not. If endoscopic resection is oncologically safe, the patient may avoid additional surgery and obtain numerous benefits, such as lower morbidities, a shorter recovery period, and an improved quality of life. The oncological safety of endoscopic resection for T1 CRC depends mainly on the probability of LNM.
According to current guidelines, the risk factors for LNM in endoscopically resected T1 CRC include vascular invasion, high-grade histology, deep submucosal invasion, and budding. Additionally, if a patient is identified as having any risk factors after endoscopic resection of T1 CRC, the patient is classified as high-risk and is advised to undergo additional surgery.
Based on our National Cancer Center database, among the patients who underwent additional surgery after endoscopic resection of T1 CRC, only 14% of the patients were finally diagnosed as LNM positive [14]. As a result, more than 80% of patients had undergone unnecessary additional surgeries after endoscopic resection of T1 CRC, and some had experienced various postoperative complications. Such overtreatment may be due to inadequacies in the current method of predicting LNM risk in T1 CRC patients.
In this large retrospective study, we established a new model for predicting the probability of LNM in patients with T1 CRC. Our new prediction model is based on five pathological parameters, involving vascular invasion, high-grade histology, deep submucosal invasion, tumor budding and the absence of BGA. Although the absence of BGA is not widely accepted as a risk factor for LNM in T1 CRC, our previous research demonstrated that the absence of BGA is significantly associated with LNM in T1 CRC [19]. Vascular invasion and high-grade histology were the strongest predictive risk factors correlating with LNM, with an OR of 8.45 and 7.89, respectively (p < 0.001).
According to current guidelines, the probability of LNM in T1 CRC is either high-risk or low-risk. Our new prediction model showed that the probability of LNM ranges widely according to the type and number of risk factors. Using our new prediction model, a clinician can calculate a total score according to the risk factors and then calculate in greater detail the probability of LNM forindividual patients. Because our new prediction model is based on five pathological parameters, the number of all the combinations is 32, and we showed the probability of LNM for all 32 combinations, from 1.2% to 83.5% (S2 Table).
However, it is very difficult to determine the appropriate cut-off value for the decision whether to perform additional surgery or not. When recommending to the patient whether to proceed with additional surgery after an endoscopic T1 CRC resection, the clinician should consider not only the probability of LNM but also surgical co-morbidity, patient quality of life, and the patient’s opinion. With as much information as possible, the patient is further supported to become more actively involved in decision-making, which may improve the patient’s adherence to treatment. This quantified new prediction model is likely to facilitate clinicians and patients to consider treatment options more objectively.
In the current study, there were several significant differences in clinicopathological characteristics between the development set (National Cancer Center Hospital) and validation set (Daehang Hospital). These differences may have been due to most patients in the development set being transferred from other hospitals for further treatment; therefore, more patients with aggressive lesions were involved in the development set. Nevertheless, the performance of the new prediction model was good in both development and validation sets, and a further strength of our new prediction model may be that it is useful for different patient groups.
According to previous research concerning the survival of surgically or endoscopically resected T1 CRC, overall survival was not different between the endoscopically resected group and the surgically resected group, although diseasefree survival was worse in the endoscopically resected patients [20,21]. This finding may indicate that recurrence in patients with endoscopically resected T1 CRC is successfully cured through salvage surgery, although this result may not affect overall survival. Based on this finding, the surveillance and no additional surgery strategy may be applied selectively for patients with endoscopically resected T1 CRC, despite current guideline indications for additional surgery, and our new prediction model may be of assistance in selecting the most appropriate surgical candidates. However, the data and evidence are not yet sufficient to conclude that overall survival does not differ between endoscopically and surgically resected T1 CRC patients. More research in this field may be necessary.
This study has several limitations. First, it was a retrospective cohort study based on clinical records. Second, the number of included patients was relatively small. Third, this new model was validated in only one center; therefore, larger multicentered validation studies are required to support our new prediction model.
In conclusion, we present a new, externally validated model to predict the risk of LNM in T1 CRC patients, which may usefully guide decision-making on whether to perform additional surgery following endoscopic T1 CRC resection.