Introduction
Mucinous adenocarcinoma (MAC) is a histologic subtype of rectal cancer that accounts for 5%-30% [1,2]. Previous investigators demonstrated the distinct difference of MAC in the clinical characteristics and genetic alterations [3]. However, whether mucinous histology is associated with a poor prognosis has been debated thus far. Several investigators reported that MAC did not differ in the clinical behavior from non-mucinous adenocarcinoma (NMAC) [4,5]. However, more recent studies have reported that MAC has a poor response to neoadjuvant chemoradiotherapy (CRT) [6-9].
MAC is characterized by abundant extracellular mucin that exceeds 50% of the tumor volume by histologic examination. Mucinous subtype can be determined based on initial biopsy, but it is often difficult to be determined if the specimen is not representative. To compensate for the histologic diagnosis, pretreatment magnetic resonance imaging (MRI) has been shown to have high accuracy (97%) in predicting MAC [10]. Furthermore, a previous study revealed that patients classified as mucinous by MRI were associated with worse response to CRT [11]. Because mucin has high intensity in T2-weighted MRI, physicians can easily identify the mucin contents in a tumor. This study aimed to investigate the prognostic importance of mucinous histology and mucin status in pretreatment MRI in locally advanced rectal cancer treated with neoadjuvant CRT followed by surgery.
Materials and Methods
1. Patients and treatment
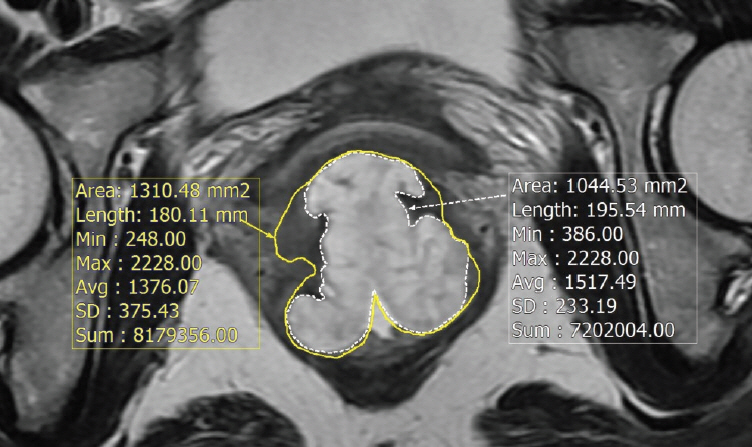
After institutional review board approval, we retrospectively reviewed the records of 306 patients who underwent curative surgery after preoperative CRT for locally advanced rectal cancer, and identified 27 MAC among them by pathologic examination. Patients with distant metastases or any other malignancies at diagnosis were excluded. All patients were examined with a digital rectal examination, laboratory tests, colonoscopy, and computed tomography. MR images of MAC patients were reviewed by a radiologist specialized in gastrointestinal imaging with longer than 20 years of experience. The radiologic proportion of mucin was measured as the percentage of mucin in the representative tumor sections (Fig. 1). The TNM system was used for staging according to the 8th edition of the American Joint Committee on Cancer (AJCC).
After histologic diagnosis of primary rectal cancer, all patients underwent preoperative concurrent CRT followed by total mesorectal excision. Radiotherapy consisted of a total 45-54 Gy in 25-30 fractions (median, 50.4 Gy). The gross tumor volume (GTV) consisted of tumor and suspicious lymph node(s) at diagnostic work-up. The clinical target volume (CTV) covered GTV, mesorectal tissues and regional lymphatics such as the perirectal, presacral, and internal iliac nodes. The planning target volume included the CTV plus a 1 cm margin. All patients were treated with 3D conformal radiotherapy in prone position. Preoperative concurrent chemotherapy consisted of 5-fluorouracil (500 mg/m2) bolus injection for 3 days during the first and last weeks of radiotherapy or capecitabine (1,650 mg/m2) daily on days with radiotherapy. Post-treatment MRI was performed at median 7 weeks from the end of radiotherapy. Surgery was performed median 57 days after preoperative CRT using either low anterior resection or abdominoperineal resection depending on tumor location from the anal verge.
2. Follow-up and statistical analysis
Therapeutic response on surgery specimen was graded as reported previously [12]. In the current study, to evaluate the prognostic effect of CRT response, treated patients were divided into two groups as follows: good response was defined as patients with near total or total regression, and poor response was defined as patients with no regression, minimal or moderate regression. Receiver-operating characteristic (ROC) analysis was performed to determine the optimal cut-off value for the mucin proportion in MRI predicting treatment responses including both negative circumferential resection margin (CRM) and good neoadjuvant CRT response. The mucin proportion of tumor was measured in the MRI taken after CRT, and the change of mucin proportion was also evaluated. Patients were regularly followed-up at 3- to 6-month intervals with digital rectal examination, laboratory test, imaging, and/or colonoscopy.
Overall survival (OS) was calculated as the time from the first date of radiotherapy to the date of death, and disease-free survival (DFS) was defined as the interval from the first date of radiotherapy to any recurrent disease detection. The Kaplan-Meier method was used to estimate survival rate. The log-rank test and the Cox proportional hazards regression model were used for univariate and multivariate analyses, respectively. Variables with a p-value < 0.1 were entered into multivariate analyses. For the statistical analysis between two groups, categorical variables were analyzed with Pearson's chi-square or Fisher's exact test, and continuous variables were compared using Student's t test, paired t test, or Mann Whitney U-test. Factors with a p-value < 0.05 were regarded as statistically significant. The analyses were performed using PASW Statistics for Windows, ver. 23.0 (IBM Corp., Armonk, NY).
Results
1. Patient characteristics
Between 2003 and 2011, 306 patients who were diagnosed as locally advanced rectal cancer were treated with CRT followed by radical surgery. There were 219 male and 87 female patients (Table 1). The median patient age was 58 years (range, 31 to 82 years). Twenty-seven patients had a histologically confirmed MAC, and seven patients (25.9%) showed acellular mucin in the surgical specimen. Compared with NMAC patients, the rate of sphincter preservation was lower in MAC group (p=0.032), despite no difference in tumor location from anal verge. More patients with MAC were treated with capecitabine as a concurrent chemotherapy regimen (p=0.054). Other variables including age, sex, performance status, clinical stage, pre-radiotherapy carcinoembryonic antigen level, and the rate of adjuvant chemotherapy were not significantly different between MAC and NMAC.
In MAC patients, the mean mucin proportions in pre- and post-CRT MRI were 50.0±36.3% and 60.0±32.0%, respectively. There was a significant increase in mucin proportion after CRT (p=0.024). Eleven patients (40.7%) showed an increased proportion of mucin, and 16 patients (59.3%) had decreased or no change in mucin proportion after CRT. The change of mucin proportion was not related to tumor stage (p=0.675) or downstaging (p=0.525).
2. Treatment response according to mucin status in pathologic examination
On pathologic examination, we compared treatment response following neoadjuvant CRT between MAC and NMAC groups (Table 2). Although there was no significant difference in ypT category and CRT response between MAC and NMAC patients, the number of ypN0 patients was significantly low in MAC group (p=0.049). Tumor and nodal downstaging were significantly more common in patients with NMAC (p=0.049 and p=0.011, respectively). Overall downstaging occurred in 44.4% of MAC compared to 72.4% in NMAC (p=0.001). Furthermore, positive CRM status, defined as ≤ 1 mm, was observed more frequently in MAC group (p < 0.001).
3. Treatment response according to mucin status in pretreatment MRI
In the MAC group, the treatment response was evaluated according to mucin proportion in pretreatment MRI (Table 3). The optimal threshold values for tumor response was 30 % for mucin proportion in pretreatment MRI by the ROC analysis. Nine patients showed low mucin proportion (< 30%), and 18 patients had tumor with high mucin proportion (≥ 30%). There was no significant difference in age, sex, tumor location, and clinical T category, but lymph node metastasis was more common in patients with high mucin content (p=0.078). Patients with mucin ≥ 30% had tendency to have more advanced ypT category and positive CRM compared to low mucin group (p=0.072 and p=0.071, respectively). Tumor downstaging tended to occur more frequently in patients with mucin < 30%, though difference was not statistically significant (p=0.071).
4. Survival and prognostic factors in overall patients
With the median follow-up period of 68 months (range, 10 to 128 months), univariate analyses showed that tumor location, ypT category, ypN category, CRM status, CRT response, tumor and nodal downstagings were significantly related to DFS (Table 4). Clinical and pathologic stages, CRM status, CRT response, tumor and nodal downstagings were also associated with OS. Multivariate analyses revealed that tumor location and ypN category were significantly related to DFS, whereas female, negative CRM status, and good CRT response were favorable prognostic factors for OS.
5. Survival and prognostic factors in patients with MAC
Table 5 displays the results from univariate analyses for DFS and OS in MAC patient subgroup. Among patients with MAC, low mucin proportion in pretreatment MRI (< 30%) was associated with better DFS and OS, although statistically insignificant (p=0.092 and p=0.056, respectively) (Fig. 2). In addition, increased mucin proportion after CRT was associated with better DFS (p=0.047). Pathologic nodal stage and overall downstaging were significantly related to DFS (p=0.006 and p=0.047, respectively).
Discussion
In this study, we investigated the prognostic impact of MAC and mucin proportion in pretreatment MRI on treatment response and survival outcomes in locoregionally advanced rectal cancer patients. MAC patients showed lower rate of sphincter-preservation and inferior treatment response, when compared to NMAC patients. Based on the optimal cutoff value for mucin proportion predicting treatment response, MAC patients with high mucin proportion (≥ 30%) in the initial MRI showed worse treatment response. Although we failed to demonstrate the statistically significant survival difference according to histology (MAC vs. NMAC), mucin proportion was associated with survival outcomes among MAC patients. Because patients with MAC are less likely to respond to conventional neoadjuvant CRT, we suggest that a more aggressive preoperative treatment strategy needs to be devised for patients with MAC, especially with high mucin proportion in the initial MRI.
The recent meta-analysis including eight prospective and retrospective studies revealed that MAC showed lower rates of negative CRM, pathologic complete response, tumor downstaging and poor OS [13]. However, the significance of MAC on clinical outcomes has been debated [4-8]. Although there were population-based studies reporting that mucinous histology was not associated with poor survival in colon cancer, rectal MAC was reported to be related with poor prognosis [14-16]. However, Hugen et al. [6] demonstrated that modern treatment approaches result in similar survival outcomes between MAC and NMAC. They analyzed the treatment outcome over a long period using data from large trials and population-based cancer registry. Over time, all rectal cancer patients showed improved 5-year OS (p < 0.001). There was a significant survival difference between MAC and NMAC in 1989, but by 2006 there was no significant difference in OS. Investigators noted that the survival disparity has disappeared from 1999, and this was likely due to progress in imaging, increased TME surgery, and use of neoadjuvant treatment. In the present study, all patients received modern treatment from 2003 to 2011. We also confirmed that MAC patients showed inferior tumor response, CRM status and downstaging, but this did not lead to differences in DFS and OS.
Advanced mucinous colorectal cancer has also been known to have lower response to fluorouracil- or oxaliplatin-based chemotherapy [17,18]. The resistance to conventional chemotherapy with mucinous histology has been explained by the molecular characteristics. Molecular studies described that MAC has high microsatellite instability (MSI), and it was related with a poor response to 5-fluorouracil [19-22]. On the other hand, MSI-high tumors have appeared to be associated with immune responses [23]. Because MSI-high tumors inflict a high mutation rate and increased expression of immune checkpoint molecules such as programmed cell death 1, programmed death ligand 1, and CTLA-4, it has been considered a good candidate for immunotherapy [24,25]. Because radiation also has immunomodulatory effects, radiotherapy may collaborate with immunotherapy to improve neoadjuvant treatment response in MAC patients [26]. Clinical studies combining immunotherapy and radiotherapy should be considered to improve the neoadjuvant treatment response for mucinous carcinoma.
Oberholzer et al. [11] accessed response to CRT with regard to mucin status in MRI. They included 88 patients and categorized carcinoma by pretreatment MRI as mucinous (mucin proportion > 50%, n=21) and as non-mucinous (mucin proportion ≤ 50%, n=67). Mucin status at initial MRI was associated with inferior response to CRT; positive resection margin was more frequent (p < 0.001) and tumor and nodal downstagings were less frequent (p=0.012 and p=0.007, respectively). Among patients classified as mucinous carcinoma by MRI, 16 patients underwent surgery and all except one were diagnosed as MAC on pathologic examination. In the current study, we assessed pretreatment MRI in MAC patients, and the mucin proportion predicting the treatment response was 30% through ROC analysis. Tumor downstaging and CRM status tended to be worse in patients with high mucin proportion. In addition to the prior studies, current study reconfirms a predictive value of mucin status in the pretreatment MRI.
In the present study, increased mucin proportion after CRT was associated with better DFS and OS. Patients with an increased proportion of mucin were those with a relatively increased mucin ratio through a significant tumor regression after treatment. In addition, the mucin proportion at post-CRT MRI was not related to patient outcomes (data not shown). The College of American Pathologists suggest acellular mucin as a treatment response and not as the residual tumor [27]. To analyze the significance of mucin pool, Shia et al. [28] analyzed mucin pools in 33 cases and revealed that acellular mucin pools were not associated with recurrence-free survival. They suggest that mucin pools without tumor cells do not have a significant impact on patient outcomes. Several investigators also reported that it is difficult to distinguish between the true cancer and remaining mucin pool if the lesion shows a high T2 signal intensity after CRT [9,29]. Therefore, these suggest that the mucin status of the MRI performed after the CRT does not have a prognostic significance and the viable cancer volume is more important than the amount of mucin after the treatment.
Current study is not free from the statistical biases due to the inherent nature of the retrospective study design with limited number of MAC patients. The number of MAC patients was small because of the rare incidence of mucinous subtype in rectal cancer. Small sample size of current study may have affected the statistical significance related with survival outcomes. However, considering the paucity of results reporting the value of MRI in MAC patients, current analysis may provide valuable insights to treat mucinous rectal cancer patients. Currently, we are planning a multicenter study with larger cohort to validate the results.
In summary, the current study showed inferior clinical outcome with neoadjuvant CRT for mucinous rectal cancer, especially in those patients with high mucin proportion at pretreatment MRI. Further studies with larger number of mucinous rectal cancer patients are needed to evaluate the role of pretreatment MRI and the more strengthened treatment for mucinous rectal cancer patients.