Introduction
Renal cell carcinoma (RCC) is a common malignancy in urologic cancer; in the United States, over 65,000 cases of newly diagnosed RCC were reported in 2012, with 13,500 associated mortalities [1]. According to the World Health Organization (WHO) classification system [2], clear cell RCC (CCRCC) is the most common type; accounting for up to 80% of cases. The remaining subtypes, papillary, chromophobe, collecting duct, unclassified, and Xp11.2 transposition, are often classified as non-clear cell RCC (NCCRCC). Among these patients, metastatic disease was observed in 20%-30% of newly diagnosed RCC, even in those with localized RCC after curative treatment during follow-up [3].
Systemic therapies for metastatic RCC have consisted primarily of conventional immunotherapies such as with interferon alpha or interleukin 2 [3,4]; however, the outcomes of these drugs were often not satisfactory. Subsequently, novel agents that targeted the members of vascular endothelial growth factor (VEGF) and the mammalian target of rapamycin (mTOR) pathways were introduced as targeted therapy (TT) and recommended as the standard of care in metastatic RCC [5]. More recently, novel immunotherapies targeting the immune checkpoint pathway mediated by the programmed cell death protein 1 receptor and its ligands (PD-L1 and PD-L2) have been adopted, and several randomized trials are underway [6,7].
The International Metastatic Renal Cell Carcinoma Database Consortium (IMDC) model (also known as the Heng criteria) [8,9] was developed and validated for patients diagnosed with metastatic RCC receiving first-line TT and comprises six independent predictors: Karnofsky performance status (KPS) < 80%, time from diagnosis to treatment interval < 1 year, anemia, hypercalcemia, neutrophilia, and thrombocytosis. Another well-known prognostic model, the Memorial Sloan Kettering Cancer Center (MSKCC) risk model [10], had already been introduced in the era of conventional immunotherapy and had five predictors: KPS < 80%, time from diagnosis to treatment interval < 1 year, high serum lactate dehydrogenase, anemia, and hypercalcemia. In both models, patients were classified into favorable (0 factors), intermediate (1-2 factors), and poor (≥ 3 factors) risk groups according to the number of poor prognostic factors. Importantly, both risk models were developed without consideration of the histologic subtypes. Subsequently, the results were presumed to have been strongly affected by CCRCC, the predominant histologic subtype in the study cohorts. Accordingly, whether these two models could be applied to NCCRCC as well has not been well-known [11]. In addition, it is unclear whether both risk models are also relevant to Asian patients. With this regard, we aimed to investigate the applicability of both the IMDC and MSKCC risk models in Korean patients with metastatic NCCRCC (mNCCRCC) treated with conventional immunotherapy and/or TT.
Materials and Methods
1. Study cohort
The Korean Renal Cancer Study group was organized in 2013 and comprises 11 academic institutions nationwide. Data from each institution were collected from March to October 2013; the web-based Korean Kidney Cancer database system for RCC was founded in March 2014. Subsequently, the Korean RCC registry was finally established, and it was divided into metastatic and localized RCC in 2017. This study was based on the Korean metastatic RCC registry. At the time of analysis, the registry covered data on 1,922 patients who have received TT (vascular endothelial growth factor–tyrosine kinase inhibitors [VEGF-TKIs], mammalian target of rapamycin inhibitor [mTORi]) or cytokines as first-line treatments between 2001 and 2016.
All institutions obtained institutional review board approvals before inputting data into the registry. Unified data templates were used for consistent data collection at each institution. Survival data were retrospectively reviewed from medical records or identified from death certificate data.
2. Data acquisition and definition
Progression was defined according to radiographic criteria using the Response Evaluation Criteria in Solid Tumors ver. 1.1 [12]. Treatment was continued until disease progression was detected or intolerable adverse events were reported. We defined first-line progression-free survival (PFS) as the period between the date of the first treatment session and progressive disease and cancer-specific survival (CSS) as the period between the date of the first treatment session and RCC-related death or the last follow-up visit. We defined total PFS as the sum of the first-line PFS and subsequent treatment PFS.
3. Statistical analyses
We used Kaplan-Meier curve analysis to calculate survival estimates for first-line PFS, total PFS, and CSS. Also, we used the log-rank test to compare the different groups: CCRCC vs. NCCRCC and favorable vs. intermediate vs. poor risk groups according to both models. We applied both the IMDC and MSKCC risk models in mNCCRCC patients using Cox regression. We calculated the concordance index (c-index) to evaluate the predictive accuracy of both models; a c-index of 0.5 represents no predictive accuracy and an index of 1 indicates perfect accuracy [13]. In addition, we performed subgroup analyses in the patients who were treated with VEGF-TKIs or mTORi as first-line therapy. We considered a two sided p-value less than 0.05 statistically significant, and we performed all statistical analyses using SAS statistical software ver. 9.4 (SAS Institute Inc., Cary, NC) and R-project software ver. 3.3.3 (R Foundation, Vienna, Austria).
4. Ethical statement
The Institutional Review Board of the National Cancer Center approved this study (approval number: 2018-0103-0001). As the present study was carried out retrospectively, written informed consent from patients was waived. Personal identifiers were completely removed and the data were analyzed anonymously. Our study was conducted according to the ethical standards recommended by the 1964 Declaration of Helsinki and its later amendments.
Results
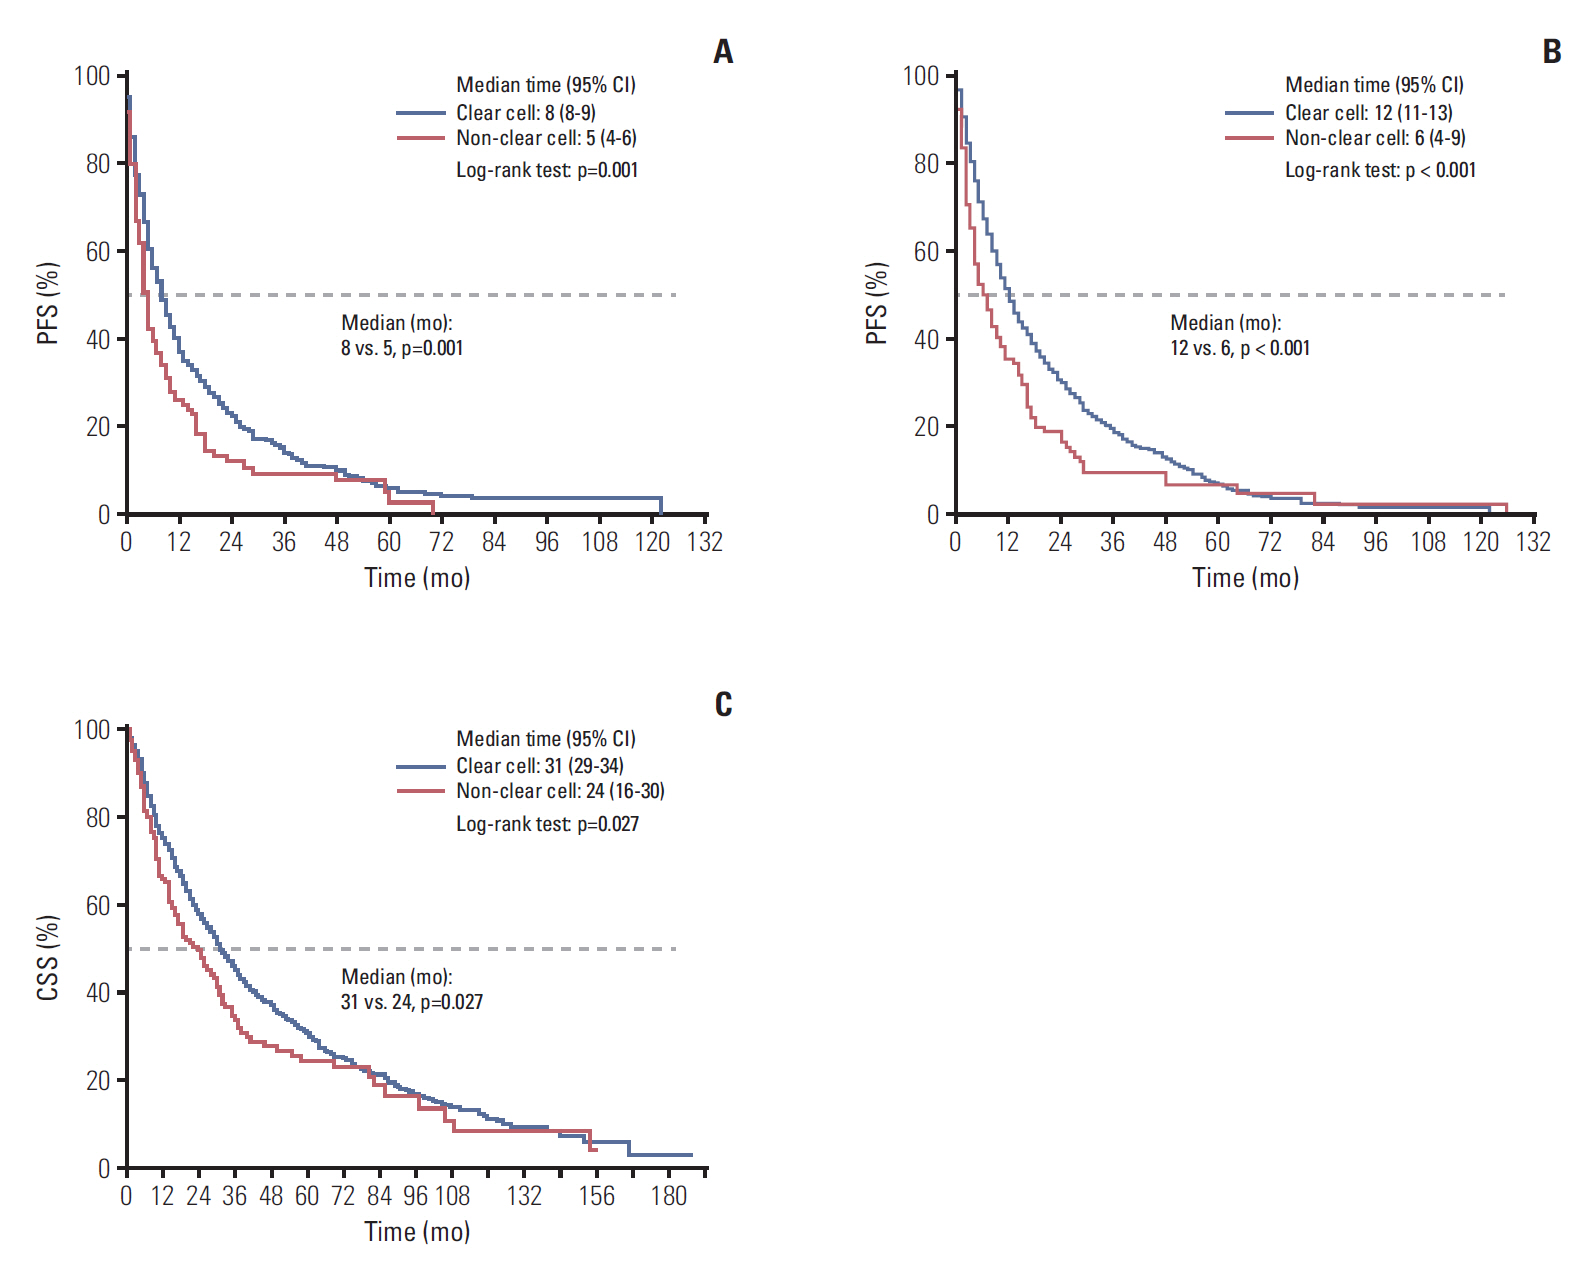
The Korean metastatic RCC registry comprised 1,922 patients at the time of our analyses. Overall, 156 patients (8.1%) had mNCCRCC: 93 papillary RCC (59.6%), 20 chromophobe RCC (12.8%), 18 collecting duct (11.5%), 16 unclassified (10.3%), and nine RCC with Xp11.2 translocation (5.8%) (Table 1). The mNCCRCC cohort had significantly inferior survival outcomes to those for metastatic CCRCC in terms of first-line PFS (median, 5.0 months vs. 8.0 months; p=0.001), total PFS (median, 6.0 months vs. 12.0 months; p < 0.001), and CSS (median, 24.0 months vs. 31.0 months, p=0.027) (Fig. 1).
The baseline characteristics including clinicopathological and laboratory data as described in the development studies of both risk models [8-10] are summarized in Table 1 and S1 Table. The majority of patients were treated with TT (91.0%); only 14 patients (9.0%) were treated with cytokine immunotherapy as the first-line therapy. The lymph nodes were the most common (53.3%) site of metastasis, followed by the lung (46.1%), bone (42.9%), liver (26.6%), and brain (3.3%).
1. IMDC risk model for mNCCRCC
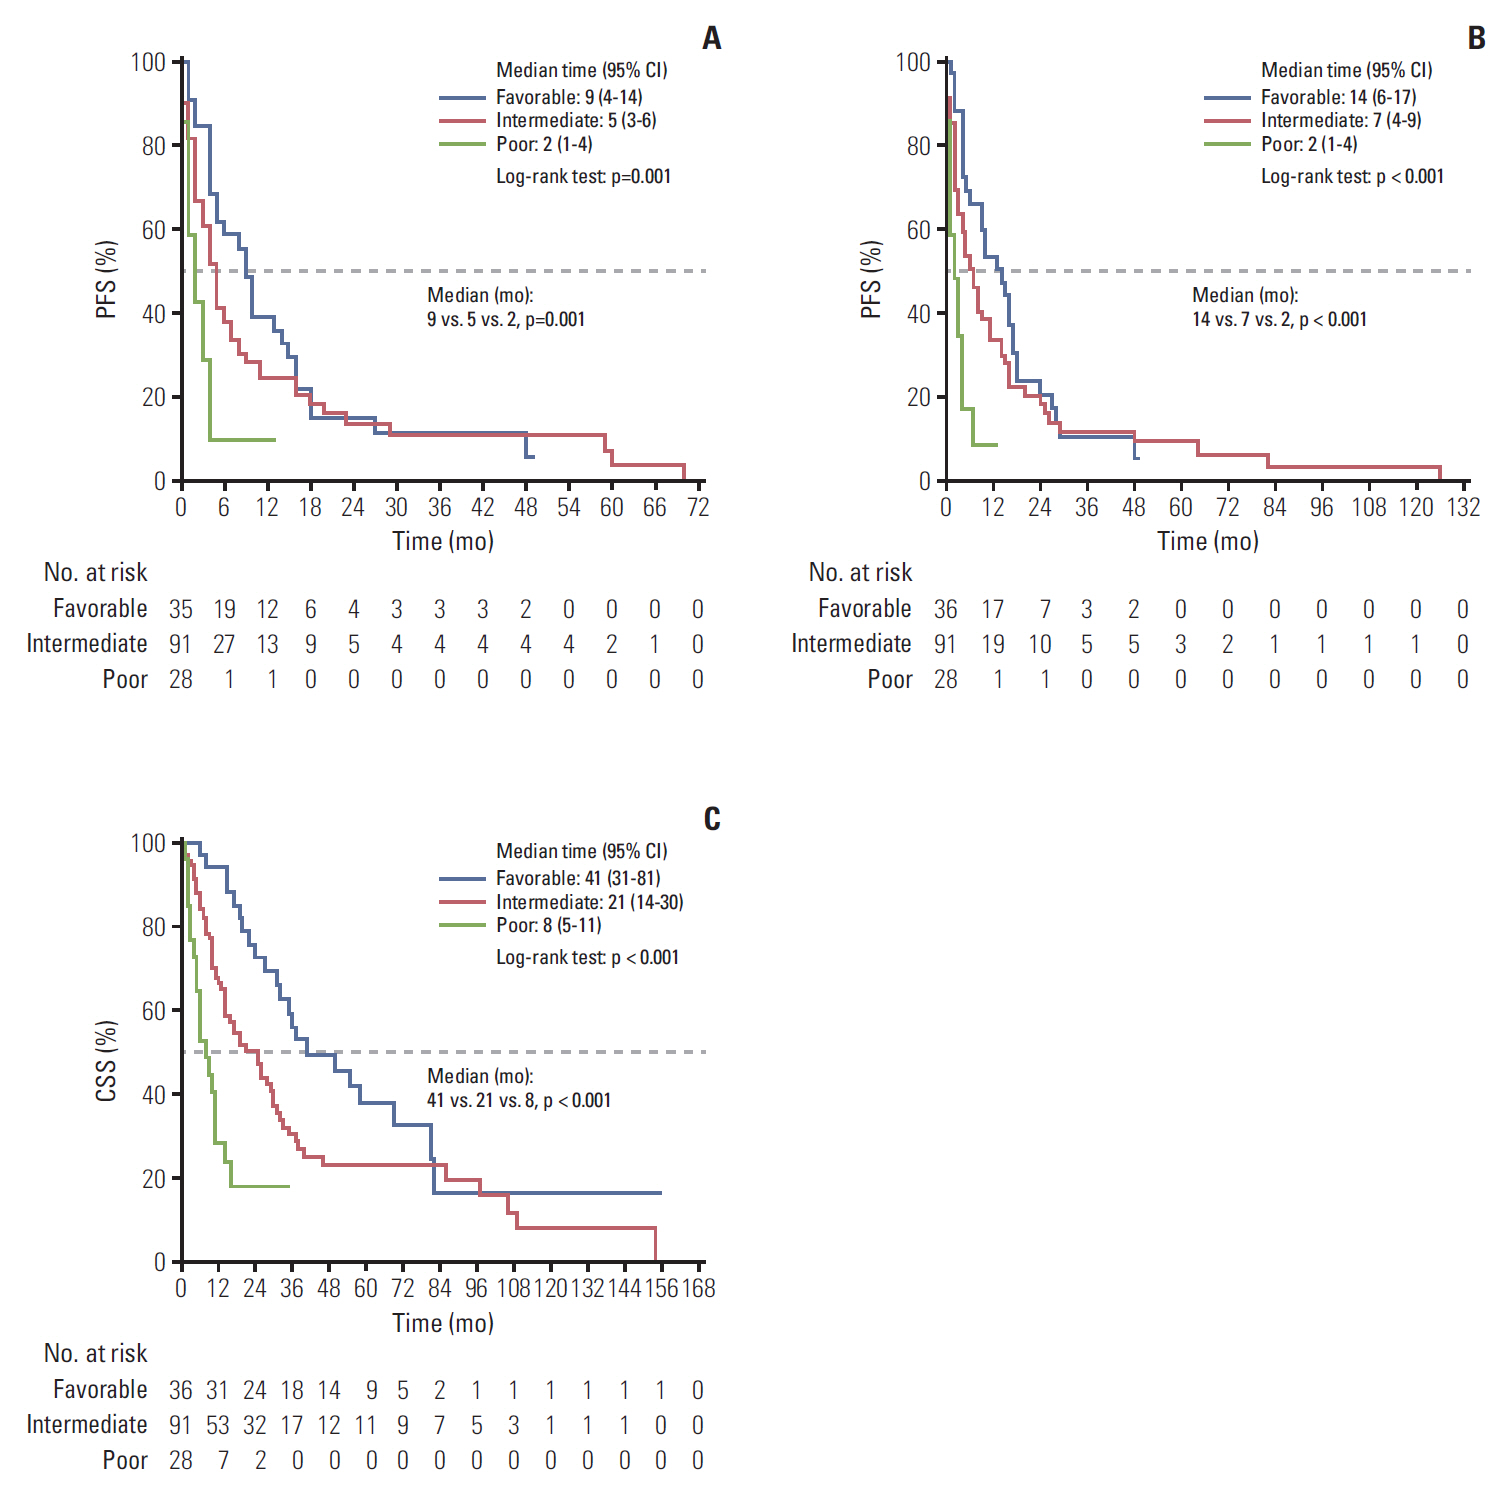
The IMDC risk model reliably discriminated three risk groups to predict first-line PFS, total PFS, and CSS; the median first-line PFS, total PFS, and CSS for the favorable, intermediate, and poor risk groups were 9, 5, and, 2 months (p=0.001); 14, 7, and 2 months (p < 0.001); and 41, 21, and 8 months (p < 0.001), all respectively (Fig. 2).
Multivariable Cox regression analysis with variables that were included in the IMDC risk model revealed that higher neutrophil count (hazard ratio [HR], 3.798; 95% confidence interval [CI], 1.527 to 9.448) was a significant prognostic factor for first-line PFS, and shorter time interval between diagnosis and systemic therapy (HR, 2.386; 95% CI, 1.076 to 5.293), higher calcium level (HR, 7.219; 95% CI, 2.238 to 23.289), and higher neutrophil count (HR, 5.981; 95% CI, 2.315 to 15.450) were significant prognostic factors for CSS (p < 0.05) (Table 2). The c-indices were 0.632 (standard error [SE], 0.059) for first-line PFS and 0.748 (SE, 0.052) for CSS.
2. IMDC risk model for subgroup analyses of patients treated with VEGF-TKIs and mTORi as first-line treatment
In subgroup analyses for patients treated with VEGF-TKIs as first-line treatment, the IMDC risk model also reliably discriminated three risk groups to predict first-line PFS, total PFS, and CSS: The medians for the favorable, intermediate, and poor risk groups were 10, 5, and, 2 months (p=0.256); 15.5, 9, and 2 months (p=0.123); and 37, 26, and 6 months (p < 0.001), respectively (S2 Fig.).
In concordance with the results for the VEGF-TKIs subgroup, subgroup analyses for patients treated with mTORi also showed the reliable discriminative ability of the IMDC risk model: the medians for the favorable, intermediate, and poor risk groups for first-line PFS, total PFS, and CSS were 5, 4, and 2 months (p=0.002); 10, 6, and 2 months (p=0.004); and 36, 14, and 11 months (p=0.075), respectively (S3 Fig.).
3. MSKCC risk model for mNCCRCC
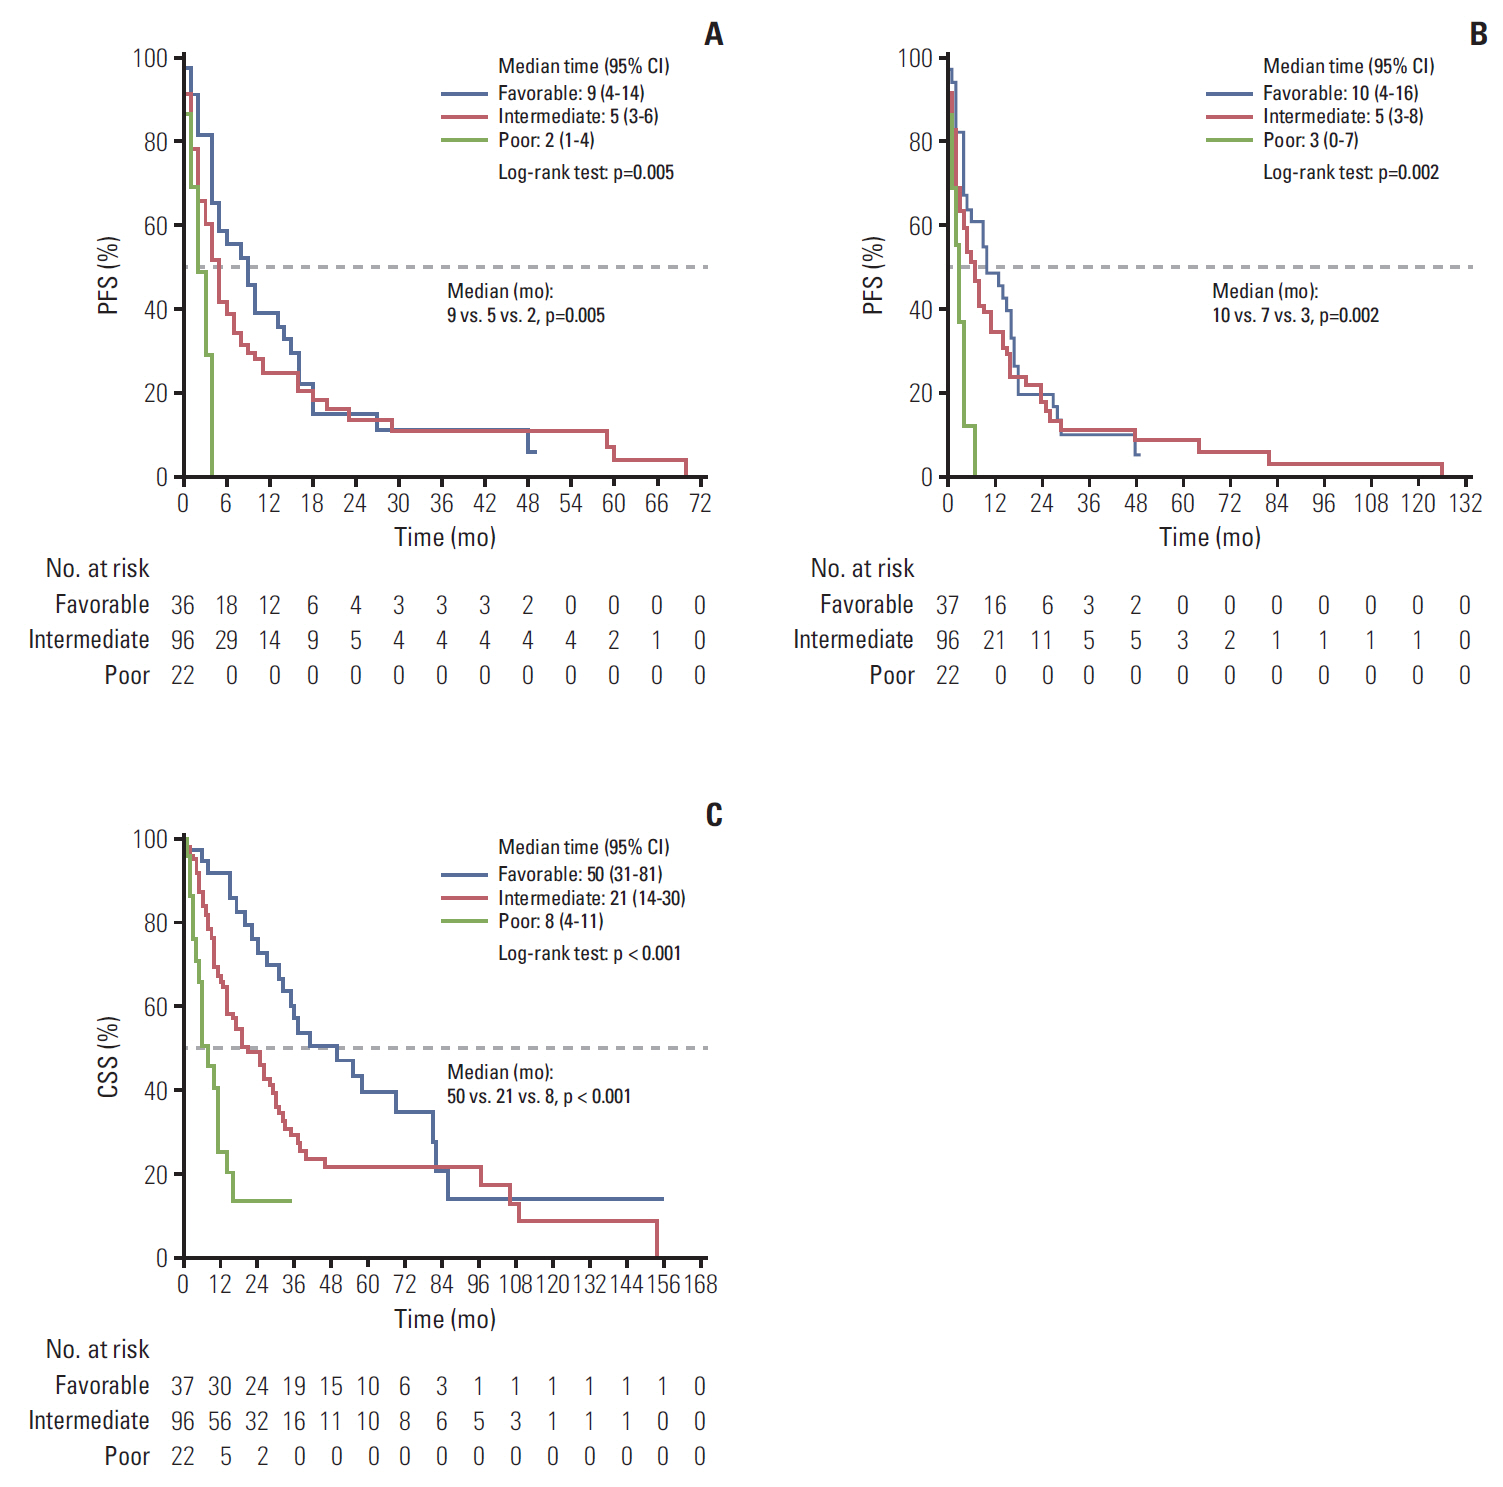
The MSKCC risk model also reliably differentiated three risk groups: the median first-line PFS, total PFS, and CSS for the favorable, intermediate, and poor risk groups were 9, 5, and, 2 months (p=0.005); 10, 7, and 3 months (p=0.002); and 50, 21, and 8 months (p < 0.001), respectively (Fig. 3).
Multivariable Cox regression analysis with variables that were included in the MSKCC risk model revealed that hypercalcemia (HR, 6.367; 95% CI, 1.051 to 38.592) was a significant prognostic factor for CSS (p=0.044) (Table 3). The c-indices were 0.643 (SE, 0.097) for first-line PFS and 0.655 (SE, 0.089) for CSS.
4. MSKCC risk model for subgroup analyses of patients treated with VEGF-TKIs and mTORi as first-line treatment
In subgroup analyses for patients treated with VEGF-TKIs as first-line treatment, the MSKCC risk model reliably discriminated three risk groups to predict first-line PFS, total PFS, and CSS: the medians for the favorable, intermediate, and poor risk groups were 11.5, 5, and, 3 months (p=0.175); 15, 9, and 3 months (p=0.143); and 39, 26, and 6 months (p < 0.001), respectively (S4 Fig.).
The other subgroup analyses for patients treated with mTORi also showed reliable discriminative ability for the IMDC risk model: these medians for the favorable, intermediate, and poor risk groups for first-line PFS and CSS were 5, 4, and 2 months (p=0.038) and 36, 17, and 11 months (p=0.101), respectively (S4 Fig.). However, the IMDC risk model did not discriminate total PFS between the three groups (5, 6, and 3 months, respectively, p=0.050) (S5 Fig.).
Discussion
To the best of our knowledge, this is the largest nationwide study to investigate mNCCRCC treated with TT in Asian population, even one of the largest studies worldwide [11,14,15]. In Korea, the incidence of RCC is lower than that worldwide at 3% [16]; a total of 4,471 cases (2.0%) were reported in 2014 according to the Korea Cancer Registry Annual Report 2016. However, the annual percentage change in RCC has been increasing gradually, and the value of 5.8% was reported between 1999 and 2012 [17]. Among these cases, 11.3% of patients presented with metastatic disease at the time of diagnosis in 2014.
Regarding the survival outcomes, the current study showed that mNCCRCC patients had inferior outcomes than did CCRCC patients in the TT era (Fig. 1). Upton et al. [18] reported that mNCCRCC had worse response to conventional immunotherapies than CCRCC (overall response rate 6% vs. 21%, respectively). In a recent large retrospective analysis of the IMDC, Kroeger et al. [11] found that mNCCRCC patients had significantly poorer overall survival (OS) than did patients with CCRCC treated with TT agents (12.8 months vs. 22.3 months, p < 0.001); chromophobe RCC had the best OS, and those with papillary and unclassified RCC had the worst OS. Consequently, we tentatively conclude inferior survival outcomes for mNCCRCC. However, the still small number of NCCRCC patients—only 8.1% in the current study—should not be overlooked when generalizing our findings; we need to focus more on the individual subtypes when evaluating patients’ prognoses.
Until now, there was no other prognostic risk model for exclusively assessing mNCCRCC. Instead, a previous study demonstrated that the IMDC risk model reliably segregated NCCRCC into three risk groups in time to treatment failure and OS [11]. In concordance with that study, we found that the IMDC risk model reliably discriminated three risk groups to predict first-line PFS, total PFS, and CSS (all p < 0.05) (Fig. 2). Additionally, the MSKCC risk model also reliably differentiated three risk groups (all p < 0.05) (Fig. 3). Notably, the accuracy in discriminating outcomes according to the c-indices was higher with the IMDC model (0.748 for CSS) than with the MSKCC model (0.655 for CSS) (Table 3). Previous studies also reported that the IMDC model had slightly better discriminatory accuracy than the MSKCC model [11,19,20]. These results reflect the fact that the IMDC model was originally developed and validated as a prognostic model for patients treated with TT; the MSKCC model was the most often used prognostic model in the conventional immunotherapy era. In the current study, the majority of patients were treated with TT as first-line treatment (VEGF-TKIs, 50.6%, mTORi, 40.4%) (Table 1).
More importantly, in the current study, we evaluated total PFS, not just first-line PFS. The IMDC model had been developed and validated for patients who received first-line TT [8], and the MSKCC model was proposed as a second-line prognostic model [10]. Considering this, we performed additional analyses in this including all patients through third-line treatment; we found that both risk models reliably discriminated three groups even in other treatment lines (Figs. 2 and 3). In addition, we performed subgroup analyses for patients treated with VEGF-TKIs or mTORi as first-line treatment, and we found that both the IMDC and MSKCC risk models reliably discriminated three risk groups to predict survival outcomes according to the first-line treatments (S2-S5 Figs.).
The current study has a number of limitations. First, even with a large multicenter study design, our cohort is still relatively small due to the rarity of NCCRCC. In addition, our study is based on a highly heterogeneous study cohort (e.g., different first-line treatment agents, metastasis sites, and statuses regarding previous cytoreductive nephrectomy, metastasectomy, etc.) (Table 1). Finally, we did not conduct a central review of pathology; accordingly, subsequent misclassification of some tumors might have affected survival outcomes. However, this is the largest study of mNCCRCC in an Asian population, and it can serve as support for previous results in Western populations [11,14,15]. Further larger studies are warranted to validate and generalize our results.
In conclusion, the current IMDC and MSKCC risk models reliably predict first-line PFS, total PFS, and CSS in mNCCRCC patients. In subgroup analyses, both risk models also reliably discriminated three risk groups treated with VEGF-TKIs or mTORi as first-line treatment.