Introduction
Prostate cancer (PCa) accounts for a major portion of cancer cases and cancer-specific mortality worldwide [1], which warrants ongoing efforts to optimize public health strategies for mitigating the social burden of PCa. The expected clinical outcomes by treatment including surgery is affected by hospital volume regarding post-operative complications and mortality [2,3].
Surgeries related with PCa including robot-assisted radical prostatectomy (RARP), open radical prostatectomy (RP) and laparoscopic RP are also affected by volume-outcome relationship. Similarly with open RP and laparoscopic RP, high hospital volumes of RARP were related with favorable perioperative and functional outcomes [4-6]. During the past decade, especially regarding surgical outcomes including open RP and laparoscopic RP, medical travel including centralization was recognized as one of the most important factors for predicting clinical outcomes, including peri-operative complications, oncologic and functional outcomes, and costs [7,8].
Studies on medical travel, among PCa patients have focused primarily on western countries, and there have been, no reports focused on developing countries or Asian countries with high population densities. Considering the high incidence and prevalence of PCa not only in Western countries but also in developing countries and Asian countries, the public health burden of PCa is increasing.
The aim of this study was to investigate trends in medical travel to the Korean capital city, Seoul, among PCa patients who were non-Seoul residents. Recently, after widespread adoption of RARP, a worldwide decentralization phenomenon was confirmed [4,6], hence this study focused more on medical travel itself rather than focusing on centralization. This study also aimed to investigate the factors affecting medical travel choice among non-Seoul resident PCa patients.
Materials and Methods
1. Data sources and study patient identification
This study used National Health Information Database (NHIS-2017-4-027) made by Korean National Health Insurance Service (NHIS). The author(s) declare no conflict of interest with NHIS. Healthcare claim data for the years 2002 through 2015 were collected from the Korean National Health Insurance System (KNHI). Because almost all of the payments were based on fee-for-service, National Health Insurance (NHI) claim data contains a specific disease code and all data necessary for reimbursement, including patient socio-demographic information such as sex, age, health insurance premiums, residential area, comorbid diseases, diagnostic tests, procedures, and prescriptions provided, and outcomes (deaths). This database is extensively used for epidemiological and health policy studies [9,10]. All of the patients with code C16 claims from 2002 to 2015, indicating PCa according to the International Classification of Diseases, 10th edition, Clinical Modification (ICD-10-CM), were screened.
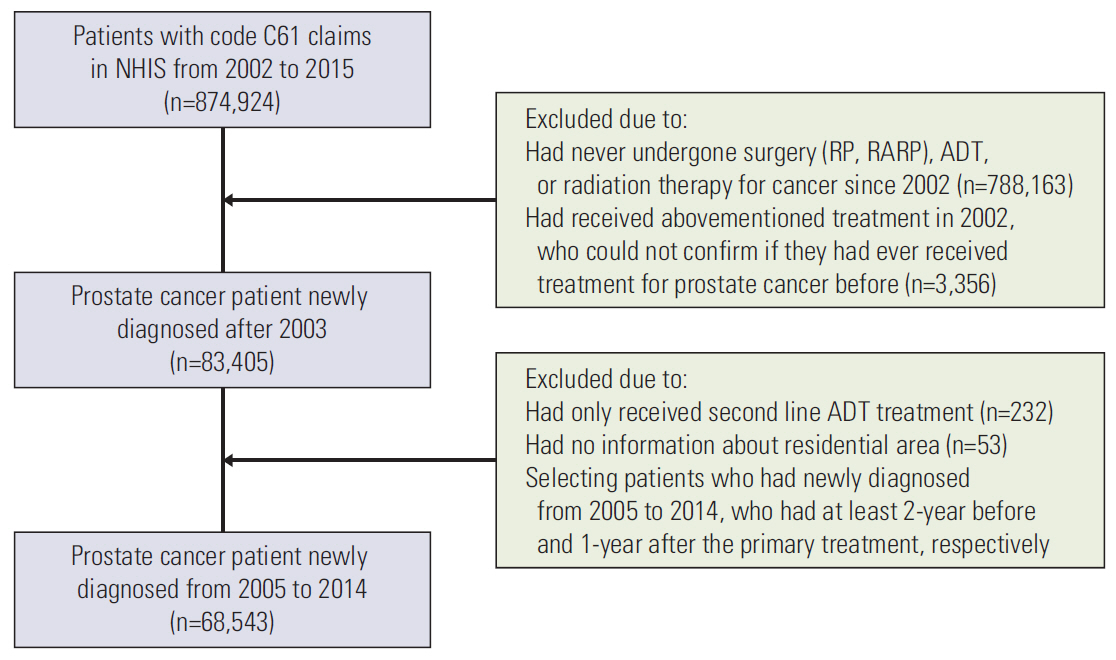
Among 874,924 patients having code C61 from 2002 to 2015, we selected 83,405 patients who had undergone primary treatments such as surgery (radical prostatectomy, robot-assisted radical laparoscopic prostatectomy), androgen deprivation therapy (ADT), or radiation therapy (RTx) for PCa for the first time since 2003. Setting 2 years as filtering before cohort inclusion was due to know the real history of using hospital utilities in Seoul before to undergo primary treatment either in hospital utilities in Seoul or in non-Seoul area and to consider follow up period as 1 year after primary treatment.
The 3,356 patients who received primary treatments in 2002 were excluded because we could not confirm the date of initial primary treatment. We also excluded patients who only received second line ADT for PCa (n=232) and those for which information on residential area was missing (n=53). Finally, we selected 68,543 patients who had received primary treatment for PCa from 2005 to 2014 because they had claim information at least 2 years before and 1 year after the primary treatment (Fig. 1).
2. Operational definition of primary treatments types and medical facilities use
We analyzed treatment patterns and medical costs for the primary treatment of PCa. The primary treatment methods included surgery, ADT, and RTx. Surgery included RP and RARP. RP included open radical retropubic prostatectomy and laparoscopic radical prostatectomy. The KNHI reimbursement codes of the RP were R3950, R3960, and RZ512. Because RARP is not reimbursed by KNHI, it cannot be identified by that code. Thus, RARP was operationally defined as the absence of a surgery code, despite the presence of general anesthesia (code L1211) and postoperative pathologic examination code (code C5500, C5500, C5501, C5502, C5503, C5504, C5505, C5506, C5507, C5508, C5509, C5911, C5912, C5913, C5914, C5915, C5916, C5917, C5918, C5919) as described previously [11]. Primary ADT included both surgical orchiectomy and medical castration. Medical castration included luteinizing hormone-releasing hormone agonist only, anti-androgen only, and combined androgen blockade. The types of primary treatment for PCa were grouped into seven categories as follows: (1) surgery only, including neoadjuvant ADT or RT within 6 months of surgery; (2) surgery with ADT within 6 months after surgery, including surgery with ADT and chemotherapy within 6 months after surgery; (3) surgery with RT within 6 months after surgery; (4) surgery with RT and ADT (including chemotherapy); (5) RT only; (6) ADT only, including ADT with chemotherapy; and (7) RT and ADT, including ADT with chemotherapy.
Since our study subjects were PCa patients newly diagnosed between 2005 and 2014, we could observe the patient’s medical histories for a maximum of 11 years, from 1 year prior to starting primary treatment to the 10th year following. In the present study, “medical travel of PCa care” indicated that PCa patients who resided outside of Seoul used medical facilities in Seoul. “Prostate cancer-related claims” indicates the claims of PCa as a major disease. We analyzed the overall trends in use of medical facilities by Seoul and non-Seoul residents in prostate cancer-related claims and others. Then, we mainly focused the trends in use of medical facilities in Seoul by non-Seoul residents, which included medical facility use from the first, second, and fifth year after starting primary treatment by age, income level, and treatment type among the non-Seoul residents in prostate cancerrelated claims and trends in RP rate undergone at medical facilities in Seoul among the non-Seoul residents.
3. Other variables and statistical analysis
Patient sociodemographic parameters included age, income class, and residential area. Patients were divided into five categories according to their age at diagnosis (< 50, 50-64, 65-74, and ≥ 75 years). Based on income levels, we identified patients in the insurance premium categories of below poverty line (lowest) and quintile (I, II, III, IV, and V [highest]) as provided by KNHI. KNHI contribution was used as a proxy measure for actual household income because it is calculated based on the income, property, and private auto taxes for each household [12]. The residential area was divided into three categories (metropolitan, urban, and suburban/rural), according to Korean ZIP code. Residential area was further classified according to the administrative district as follows: Busan, Daegu, Incheon, Gwangju, Daejeon, Ulsan, Gyeonggi-do, Gangwon-do, Chungcheongbuk-do, Chungcheongnam-do, Jeollabuk-do, Jeollanam-do, Gyeongsangbuk-do, Gyeongsangnam-do, and Jeju. The Charlson comorbidity index, which is a single index of comorbidity burden developed to assess the relative risk of a patient’s comorbid conditions for determining patient outcome after a critical illness, was used to group patients into four categories according to the index score: 0, 1-2, 3-4, and ≥ 5 (the most severe) [13]. Descriptive statistics were used to characterize trends in the utilization rate of medical facilities in Seoul among non-Seoul residents. Multivariable logistic regression was used to determine the adjusted odds ratios (aOR) and 95% confidence interval (CI) of sociodemographic and clinical factors that affected surgery at medical facilities in Seoul among the non-Seoul resident. All analyses were performed using SAS ver. 9.4 (SAS Institute Inc., Cary, NC).
Results
1. Patient deposition and characteristics
Incidence of PCa diagnoses increased from 2005 to 2014 (3,546 in 2005 and 9,048 in 2014) (Table 1). Among the PCa cohort, incidence increased in the over 75 age group (31.4% in 2008 and 32.5% in 2014). Incidence increased for all income level groups. However, for the Charlson comorbidity index, the group with Charlson comorbidity of zero decreased (17.4% in 2005 and 8.1% in 2014) while, patients with Charlson comorbidity index of 3-4 and over 5 increased. For treatments, both the surgery-only group and RTx-only group showed increasing trends, and both the ADT only group and ADT+RTx group showed decreasing trends.
2. Utilization rate of Seoul medical facilities among non-Seoul residents
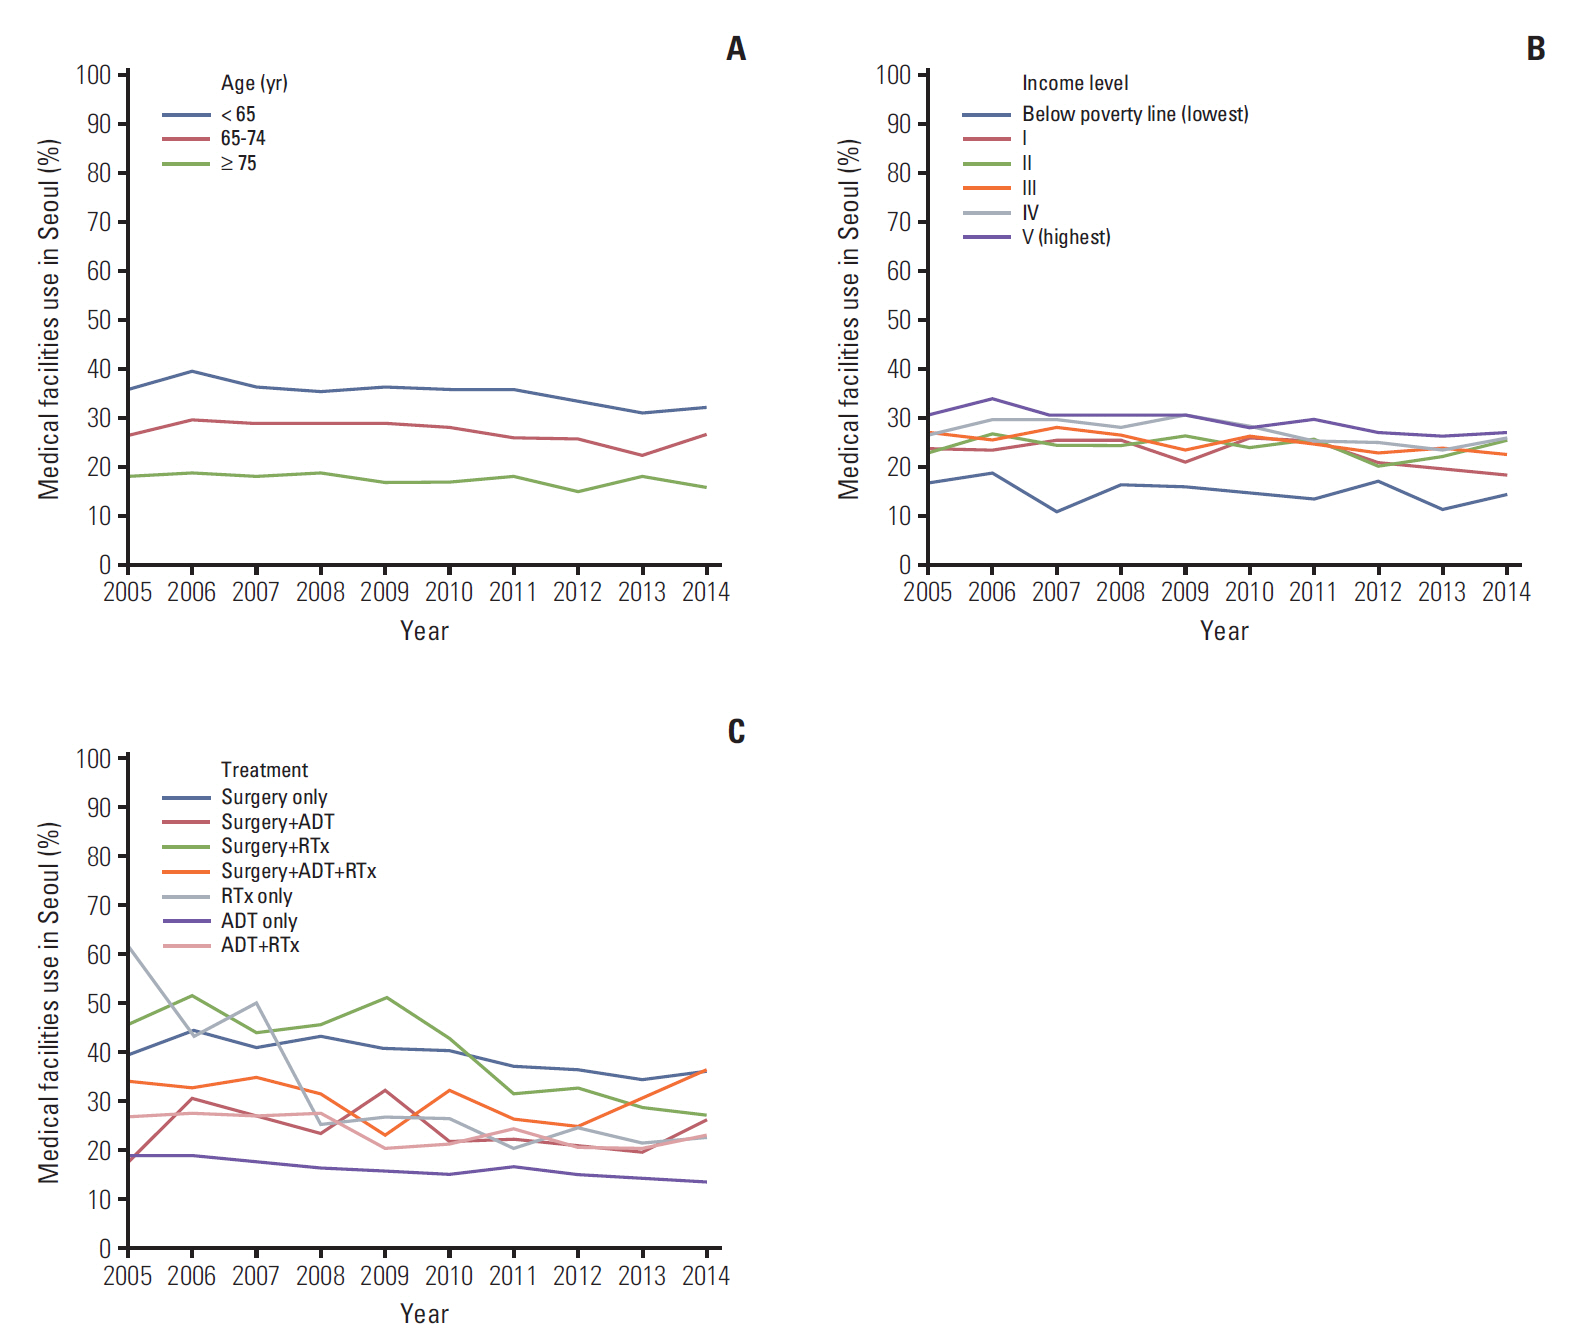
Medical travel proportions calculated using cases with prostate cancer-related claims during the first year was decreased slightly (25.8 at 2005 and 24.2 at 2014, p=0.02) (Table 2). During the first and second years, and second and third year, similar trends were noted in that the general trend of decreasing prostate cancer-related total claims. From 2005 to 2014, age groups younger than age 65 showed the highest utilization rates compared with other age groups, including ages 65-74 and older than age 75 (Fig. 2). From 2005 to 2014, the highest income level group showed the highest utilization rate while the lowest income level group had the lowest utilization rate. For treatment types, a general decreasing trend was observed in all types of surgery except multimodal treatment group (surgery+ADT+RTx), which showed similar pattern at fifth year from the primary treatment (S1 Fig.). Patients from outside Seoul seeking RP in Seoul did not decrease (43.1 at 2005 and 45.4 at 2014, p=0.26) (Table 3). Both the closest administrative regions of Incheon and Gyeonggi-do, and the farthest region of Jeju had increasing proportions, ranging 48.3%-90.5%.
3. Factors affecting medical travel to Seoul
Income level and performance of RARP were significant positive factors for medical travel to medical facilities in Seoul (Table 4). Highest income level showed aOR as 1.88 (95% CI, 1.62 to 2.19), and performance of RARP showed aOR as 4.09 (95% CI, 3.84 to 4.35). Combined comorbidity diseases and year undergoing surgery were significant negative factors for medical travel to medical facilities in Seoul (Table 4).
In 2007, significant factors affecting medical travel for RP were age group (aOR, 1.02; 95% CI, 0.63 to 1.66), highest income level (aOR, 2.38; 95% CI, 1.23 to 4.60), and robotic surgical platform (aOR, 11.15; 95% CI, 7.01 to 17.72) (Table 4). In 2014, significant factors affecting medical travel for RP were age group (aOR, 1.46; 95% CI, 1.10 to 1.93), highest income level (aOR, 2.25; 95% CI, 1.39 to 3.64), and robotic surgical platform (aOR, 3.17; 95% CI, 2.72 to 3.71) (Table 5).
Discussion
Korea is one of the main countries whose mean population age is rapidly increasing. In Korea, like other countries, the prevalence of PCa is also increasing rapidly [1,14,15]. Moreover, as for Western countries, medical travel to metropolitan areas among PCa patients [4,16] is prevalent but demographic trends have not been previously analyzed. This study using the National Health Data Base, which covers nearly 100% of all Korean patients, is the first study to focus this issue in Asian countries.
This issue of medical travel is regarded as an important public health concern [17,18]. Classically, the choice of medical facility for primary treatment depends on various factors, including patients’ personal preferences for treatment and sociodemographic factors [19]. The public health view is focused not on patients’ personal attitudes based on knowledge, religion and culture [20], but rather on the sociodemographic factors including economic status, education level, insurance status, and location of patient residence [21,22].
Although this study did not include the specific clinical outcomes including cancer-specific mortality, this study showed that there were evident disparities in the choice of medical travel to Seoul according to sociodemographic factors. By multiple logistic regression analysis for 2007 and 2014, several factors, including age, economic status, combined morbidity, and surgery type were determined to affect patient choice for medical travel into Seoul in this study.
In other Western studies, distance of medical travel was one factor affecting choice of treatment facilities or types [23]. Muralidhar et al. [23] reported that both localized PCa patients in urban and rural areas could not choose RTx because of long distances between their residence area and medical facilities where this option was available. Moreover, considering the consecutive daily treatment pattern required for RTx, medical travel for RTx could be inhibited [24]. However, in our study, distance was not a determining factor in the choice of medical travel into Seoul. The farthest area, Jeju, had the highest rate of medical travel into Seoul for RP. This phenomenon could be due to Korea's advanced public transport system including route enlargement of high speed train and emergence of low-cost air.
Patients with higher education level with stronger motivation for treatment, more affluent economic status, and younger age with fewer combined comorbidities could overcome the obstacle presented by distance between their residential area and medical facilities located far away [16,23,25]. Classically, medical travel distance was related with disease stage at diagnosis, and need of multimodal treatment options including adjuvant chemotherapy or RTx [26-29]. Our study also showed an increasing trend for RTx and multimodal treatment among those PCa patients who were non-Seoul residents (Fig. 2). Similarly to recent studies in Western countries, medical travel to Seoul for RP had a decreasing trend, which is related with adoption of RARP in non-Seoul areas.
Although our study did not directly focus on centralization, it nevertheless concerns this issue because medical travel itself is an indicator of centralization within the larger context of country unit. Medical travel has been increasing rapidly because, as many studies support, medical travel yields favorable oncological and functional outcomes [4,16]. Recently, Gershman et al. [4] suggested a threshold for favorable peri- and post-operative outcomes as about a hundred surgeries per year. Moreover, this positive aspect was not confined to surgical treatments only but also to radiation treatments [30]. As observed for surgeries, higher volume medical facilities providing RTx yielded more favorable clinical outcome.
However, the trend of volume related outcomes has changed recently, which is mainly due to the emergence of RARP and its rapid dissemination [8]. Currently, one-third of hospitals have robotic platform systems and more than 80% of cases of RP are performed by RARP [15]. Considering the absence of randomized controlled trials between open RP and RARP, the preference of RARP is not based on the patients’ perspectives but rather on the surgeons’ perspectives. Moreover, the dissemination of RARP is largely due to commercial factors. As a consequence, due to rapid dissemination of robotic platforms, recent studies have reported the phenomenon of decentralization of RARP [4,6]. The availability of RARP in lower volume medical facilities is increasing rapidly, which mainly accounts for this decentralization phenomenon. Similarly, our study showed a decreasing trend of RP in medical facilities in Seoul among non-Seoul residents. Moreover, the odds ratio, which represents the magnitude of impact as factor affecting medical travel choice, for the RARP factor decreased in 2017 compared with 2007.
This study has several limitations. First, detailed information, especially about tumor staging, is impossible to obtain due to database characteristics. Hence, localized PCa could not be defined in this cohort. Second, to determine the major reasons for medical travel from non-Seoul areas to Seoul, multivariate logistic analyses to determine factors affecting not only surgery but also other treatment types, including active surveillance, radiation and androgen deprivation, are needed. Due to the unique features in Korea, including its insurance system and widespread access to medical facilities, results of this study could not be generalized to the medical circumstances of other countries regarding medical travel. Third, although this study does not focus on centralization at the level of hospital, it might be better to consider the actual hospital volumes of academic hospitals in both Seoul and non-Seoul areas. Finally, this study does not include cost outcomes, including double costs for radiologic studies, indirect cost including transportation fees and economic values of lost income due to absence from work by patients and patients’ companions due to extended travel.
The proportion of non-Seoul resident patients who choose medical travel for localized PCa could be even higher and also show no significant change per year, but still represents a high proportion of total treatments. Relatively young patients with high income status are more likely to seek active treatment in medical facilities located in Seoul. Future health policies are needed to control this high medical travel proportion among non-Seoul residents and to improve the utilization rate of non-Seoul medical facilities.