Introduction
Of patients diagnosed with colorectal cancer, approximately 30% will eventually die of metastatic disease [1]. Systemic combination chemotherapy is the mainstay treatment for patients with metastatic colorectal cancer (mCRC), and the introduction of targeted molecular agents has significantly improved patient prognoses [2-4].
In palliative settings, response to chemotherapy and subsequent treatment decisions are generally based on radiologic assessment, the Response Evaluation Criteria in Solid Tumors (RECIST), and clinical information such as symptoms and the results of physical examinations [5,6]. Carcinoembryonic antigen (CEA) is an important tumor marker in mCRC [7] that can be used to monitor patients with metastatic disease [8,9]. However, the relationship between the extent of CEA level change and chemotherapy response remains undefined. In clinical settings, response to chemotherapy is generally evaluated based on radiologic response together with CEA changes. The outcome of chemotherapy is usually clear if these two parameters are consistent. However, when the parameters are discordant, (e.g., partial response [PR] on radiology but rising CEA levels, or progressive disease [PD] on radiology concomitant with decreasing CEA levels), the tumor response to chemotherapy is uncertain. In cases with discordant responses, the radiological response usually takes precedence; however, the clinical significance of a change in CEA patterns while radiologic response remains unchanged has not been investigated. Therefore, we conducted a retrospective study of the prognostic impact of different CEA change patterns in patients with the same RECIST categories post-chemotherapy.
Materials and Methods
1. Study population
The study design was approved by the Institutional Review Board of Seoul St. Mary's Hospital. We evaluated 563 patients who received first-line palliative chemotherapy for mCRC during 2008-2014. Of these, 142 patients who had no measurable lesions, as well as nine who had other malignancies within the previous 5 years were excluded as they could have affected CEA levels. Moreover, 52 patients with initial CEA levels that were within the normal limit (< 5 ng/mL) were also excluded. All diagnoses were confirmed via biopsy or examination of the surgical specimen from the primary tumor. Histological types were classified as well/moderate differentiation or poor differentiation/mucinous adenocarcinoma/signet ring cell adenocarcinoma. Metastatic presentation was defined as metachronous or synchronous [10].
2. Chemotherapy protocol and tumor response evaluation
All patients received fluorouracil and leucovorin plus oxaliplatin (FOLFOX) or plus irinotecan (FOLFIRI) with or without target agents (bevacizumab or cetuximab) as first-line palliative chemotherapy. The initial CEA and imaging tests included abdominal and chest computed tomography or magnetic resonance imaging 1 week before initiation of chemotherapy. Patients were subsequently evaluated for chemotherapy response with CEA testing and imaging studies every 8±2 weeks. Radiological changes were evaluated using RECIST [11], and the first imaging response evaluation was defined as “RECIS-T-response.” In RECIST-complete response (CR)/PR/stable disease (SD) patients, the same chemotherapy regimen was maintained, and chemotherapy response was assessed using RECIST at the subsequent evaluation session, whereupon the response was defined as the “second RECIST-response.”
3. Definition of CEA-response
Serum CEA levels were measured using an electro-chemiluminescent immunoassay (normal, < 5 ng/mL). A previous study [12] showed that the CEA ratio was significantly correlated with RECIST-response (as determined by imaging) as long as changes in CEA levels were ±50%; therefore, the change patterns in CEA (baseline to first post-chemotherapy evaluation) were defined as CEA-CR (< 5 ng/mL), CEA-PR (≥ 50% decrease in CEA levels while maintaining absolute values ≥ 5 ng/mL), CEA-PD (≥ 50% increase in CEA levels), and CEA-SD (change in CEA levels that did not qualify as CEA-CR/-PR/-PD) at the time of the first response evaluation. These change patterns are collectively referred to as “CEA-response.”
4. Statistical analysis
Overall survival (OS) and progression-free survival (PFS) were calculated from the date at which first-line palliative chemotherapy was started until the date of death and of disease progression, respectively. Objective response was defined as CR or PR, while disease control was defined as CR, PR, or SD. The cut-off for RECIST PR was 50% tumor shrinkage, whereas that for RECIST SD was 0% tumor shrinkage. For survival analyses, patients who were alive or had no disease progression were censored at the date of last contact. Univariate analyses for OS and PFS were conducted using the Kaplan-Meier method with the log-rank test. Multivariate Cox regression models were employed to verify the prognostic values of CEA-response, and were adjusted for age, sex, cancer location, histological type, metastatic presentation, number of metastatic organs, and first-line chemotherapy regimen. The correlations between CEA-response and first or second RECIST-response, as well as between CEA-response and extent of tumor shrinkage, were analyzed using the linear by linear association test. All analyses were conducted using the SPSS ver. 21 (IBM Corp., Armonk, NY), and a two-sided p-value of < 0.05 was considered statistically significant.
Results
1. Patient characteristics and survival according to clinicopathologic factors
We included 360 patients (64.7% men; 35.3% women) with a median age of 63 years (range, 23 to 88 years), among which 63.9% of patients had colon cancer and 36.1% had rectal cancer. The median follow-up time was 21.8 months. At the study end date, 285 patients (79.1%) had experienced disease progression and 261 (72.5%) had died. The patient characteristics are described in Table 1. Univariate analyses (S1 Table) revealed that poor survival was significantly associated with multiple metastatic organs (PFS hazard ratio [HR], 1.27; p=0.04). Chemotherapy with a target agent produced better survival than chemotherapy alone (OS HR, 0.68; p=0.01; PFS HR, 0.6; p=0.002). Poorer CEA-response was associated with poor survival. Moreover, multivariate analyses revealed that a poor prognosis was independently associated with synchronous metastasis (OS HR, 1.37; p=0.03) and multiple metastatic organs (PFS HR, 1.32; p=0.02). Chemotherapy with target agents was a significantly favorable prognostic factor for disease progression (PFS HR, 0.72; p=0.02). Poorer CEA-response was associated with poor OS and PFS.
2. Evaluation of tumor response using both CEA- and RECIST-response
Table 2 shows the correlation between CEA-response and RECIST-response. The CEA-CR and CEA-PR groups exhibited better objective response rates than the CEA-SD and CEA-PD groups (p < 0.001). Additionally, a more favorable CEA-response was significantly associated with a better disease control rate (p < 0.001). We assessed the prognostic implications of CEA-response as a second response evaluation method for patients in the same RECIST-response categories (Table 3). In RECIST-PR patients, poorer CEA-response was significantly associated with disease progression at the time of the second response evaluation (p < 0.001). Furthermore, an improved CEA-response in RECIST-SD patients was significantly associated with less disease progression than a poorer CEA-response at the second response evaluation (p < 0.001).
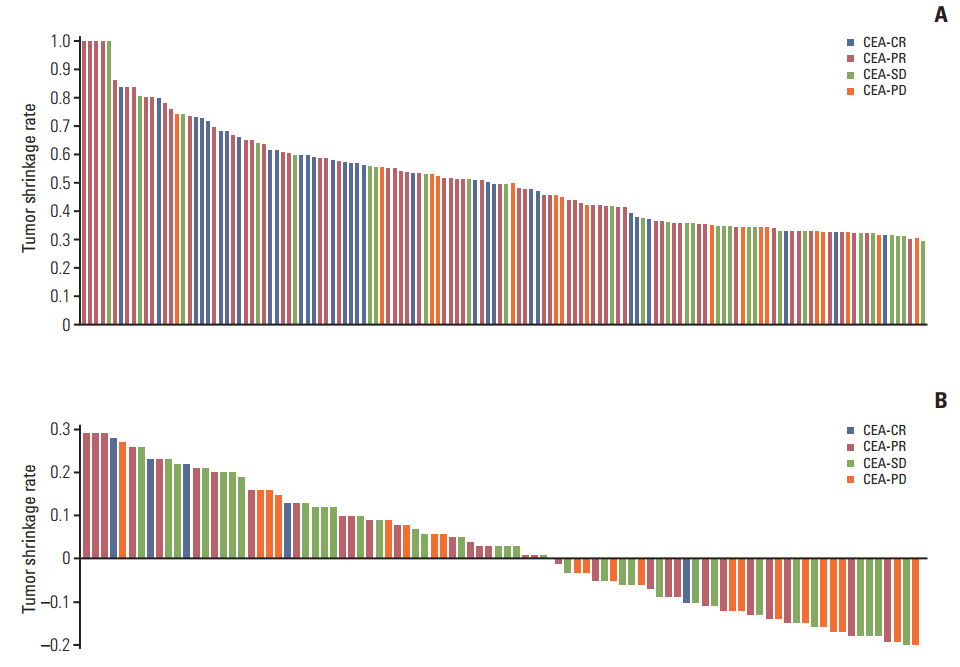
We investigated the correlation between CEA-response and tumor shrinkage at the first response evaluation among assessable RECIST-PR and RECIST-SD patients (136 of 168 and 92 of 114, respectively) (Table 4, Fig. 1). In RECIST-PR and RECIST-SD patients, the median tumor shrinkage was 50% and 2%, respectively; therefore, we set the cut-off values of tumor shrinkage at 50% and 0%, respectively. Improved CEA-response was correlated with marked tumor shrinkage (> 50%) in the RECIST-PR patients (p < 0.001), whereas CEA-response was not correlated with the extent of tumor shrinkage (> 0%) in RECIST-SD patients (p=0.105). We also investigated the correlation between CEA-response, RECIST-response, and tumor shrinkage according to target agents (S2 and S3 Tables). Among patients receiving cetuximab, a more favorable CEA-response was significantly associated with better objective response rates (p=0.046); however, this was not the case among patients receiving bevacizumab. Additionally, improved CEA-response was correlated with marked tumor shrinkage (> 50%) in RECIST-PR patients receiving cetuximab (p=0.043), but not in those receiving bevacizumab. However, CEA-response was not correlated with the extent of tumor shrinkage (> 0%) in RECIST-SD patients in either the cetuximab or bevacizumab groups.
3. Prognostic implications of discordant CEA-responses in patients with the same RECIST-response
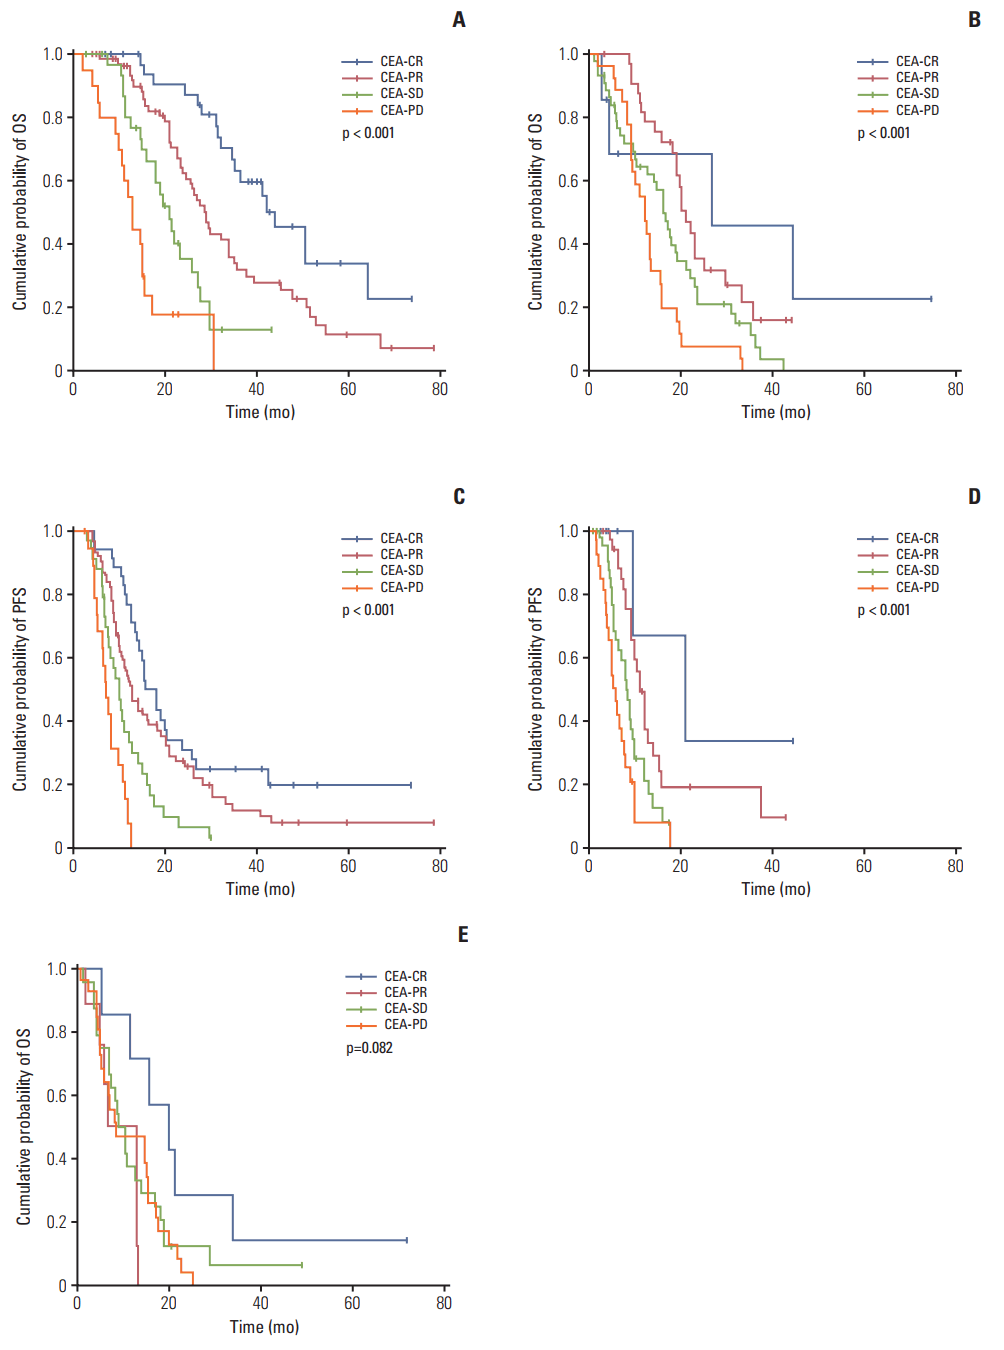
Among all patients, the CEA-CR group exhibited better OS (42.2±5.6 months) and PFS (15.4±2.0 months) than the CEA-PR (OS, 25.1±1.9 months; PFS, 11.5±0.8 months), CEA-SD (OS, 17.0±1.2 months; PFS, 7.6±0.7 months), and CEA-PD groups (OS, 12.2±1.0 months; PFS, 4.2±0.5 months) (p < 0.001). We evaluated survival outcomes according to CEA-response in RECIST-PR or -SD patients (Fig. 2). In RECIST-PR patients, better CEA-response showed longer OS and PFS (all p < 0.001), while in RECIST-SD patients, better CEA-response was correlated with a more favorable OS than a poorer CEA-response (p < 0.001). Additionally, CEA-CR and PR showed longer PFS in RECIST-SD patients (p < 0.001). Moreover, there was no significant difference in OS according to CEA-response in RECIST-PD patients (p=0.082). Evaluation of the prognostic impact of CEA-response in the same RECIST-response patients revealed discordant CEA-response (CR, SD, and PD) among RECIST-PR patients was associated with different prognoses upon univariate analysis (S4 Table). Multivariate analysis (Table 5) showed that CEA-SD and CEA-PD were poor prognostic factors for OS (CEA-SD: HR, 3.13; p < 0.001; CEA-PD: HR, 6.43; p < 0.001) and PFS (CEA-SD: HR, 2.40; p=0.004; CEA-PD: HR, 3.81; p < 0.001) in RECIST-PR patients. Among RECIST-SD patients, univariate analysis showed that discordant CEA-responses (PR and PD) have significantly different and opposing effects on survival (S4 Table). Furthermore, multivariate analysis (Table 5) indicated that discordant CEA-responses have varying prognostic impacts on OS (CEA-PR: HR, 0.53; p=0.03; CEA-PD: HR, 1.77; p=0.04). Additionally, discordant CEA-responses have varying prognostic effects on PFS (CEA-PR: HR, 0.48; p=0.03; CEA-PD: HR, 1.86; p=0.03). Among RECIST-PD patients (S5 Table), multivariate analysis showed that CEA-CR was associated with longer OS than CEA-PD (HR, 0.37; p=0.04).
Discussion
We found that the number of metastases and target agents used were associated with prognosis, which is consistent with the results of previous studies [13,14]. However, we also showed that synchronous metastasis was associated with poor prognosis, which is contrary to the findings of a previous study [10]; therefore, further investigations are required to clarify these findings.
Our study showed that CEA-response is an important prognostic factor in mCRC that is highly associated with RECIST-response. Huang et al. [12], whose data were consistent with ours, suggested that CEA change patterns are highly correlated with findings on images acquired for RECIST determination.
Discordance between CEA- and RECIST-responses can lead clinicians to question the actual effects of chemotherapy; however, the impact of such discordance in mCRCs has not been fully determined. To the best of our knowledge, this is the first study to investigate the clinical significance of the discordance between CEA-response and RECIST-response in mCRC patients. Our findings showed that different CEA-responses in the same RECIST-response patients have important, yet varying prognostic impacts on mCRC prognosis.
In the present study, poor CEA-response in RECIST-PR patients was associated with disease progression and shorter OS. This result can likely be explained by the early acquisition of tumor resistance to chemotherapy. Generally, response evaluation is performed after 3-4 cycles of chemotherapy. Even though tumor size may have decreased temporarily after 1-2 cycles, chemoresistance may have developed during the latter cycles. Hence, the tumor size is still smaller than shown on baseline imaging for RECIST evaluation, while the tumor marker levels are rapidly increasing because the cancer is again progressing, resulting in a discordance between CEA- and RECIST-responses.
In our study, 8% of patients with CEA-CR and 13% of those with CEA-PR showed disease progression at the time of the second response evaluation; however, approximately 50% of patients with CEA-PD had disease progression at that point. Based on these data, we suggest that an earlier second response evaluation would be beneficial for these patients, and that an individualized next response evaluation for patients with poor CEA-response/good RECIST-response status may be necessary. For example, Neki et al. [15] proposed that circulating tumor cell presence after chemotherapy might be useful for predicting the response to anticancer therapy. It is also necessary to identify host factors related to early chemoresistance, as suggested by previous studies of colon cancer [16,17]; however, suitable biomarkers of chemoresistance remain elusive despite several ongoing studies.
The discordant pattern of poor RECIST-response and favorable CEA-response is also worth investigating. Among patients with RECIST-PD, those who achieved CEA-CR showed longer OS than those with CEA-PD. Similarly, in RECIST-SD patients, those with better CEA-response showed better second response and survival outcomes than those with poorer CEA-response. This may be explained by a delayed chemotherapy response. It is also possible that tumor size does not decrease on imaging modalities, even though tumor viability has decreased [18]. Hence, it could be helpful to evaluate metabolic activity using positron emission tomography with fluorodeoxyglucose, which can reflect pathologic responses related to prognosis in mCRC [19-22]. These multimodal response evaluations could help prevent mistaking chemosensitivity for chemoresistance, since treatment options are still limited.
The results of our study showed that improved CEA-response was associated with greater tumor shrinkage in RECIST-PR patients, which clearly demonstrates the relevance of CEA-response to outcomes in the same RECIST-response patients. Our findings can support previous studies [23,24] which showed that the extent of tumor shrinkage is significantly associated with outcomes. In particular, our findings suggest that CEA-response may reflect better tumor shrinkage in patients receiving cetuximab compared to those treated with bevacizumab. These findings are consistent with those of a previous study that showed higher response rates and depth of responses following first-line treatment with anti–epidermal growth factor receptor than with anti–vascular endothelial growth factor agents in RAS wild-type cancer [25]. However, our results should be interpreted with caution because of the small number of targeting agents used.
It should be noted that this study had several limitations. First, baseline CEA and RECIST responses were measured on different days for some patients. Even though our study set the interval between the start of chemotherapy and CEA/radiology testing at less than 1 week, discordant patterns could be affected by differences in the time of measurement in patients with very rapid progression. Thus, minimizing the time gap between chemotherapy and baseline studies may be important for accurate response evaluation. Second, there is no established cut-off value for the CEA-response. We set a 50% increase or decrease rate for CEA level in our study, while other studies proposed different CEA-response cut-offs [5,25]; therefore, it is necessary to establish a more definitive threshold. Finally, our study was retrospective and therefore subject to the known limitations and biases of such investigations.
Among patients with same RECIST responses, discordant CEA-response patterns are strongly predictive of second response evaluation outcomes and are a significant prognostic marker. These patients would likely benefit from individualized and detailed multimodal chemotherapy response evaluation.