Introduction
Surgery is the first option considered for treating patients with clinical N0/1 stage non-small cell lung cancer (NSCLC). Following surgical resection, adjuvant therapy is recommended for patients with the risk factors of recurrence and/or metastasis based on the surgical and pathological findings. Theoretically, the addition of thoracic radiation therapy (TRT) is expected to reduce locoregional control (LRC) and thereby improve overall survival (OS). Although a few randomized trials have shown improved LRC in response to the addition of TRT, they all failed to show OS benefit because most recurrences either occurred outside the radiation therapy (RT) volume or were distant metastases [1-3]. Although the survival benefit was achievable by adjuvant chemotherapy (CTx) in patients with pathologic II-III stage [4,5], the rate of loco-regional (LR) failure was 20%-40% if patients had pathological N2 (pN2) disease [6]. In 2005, the PORT Meta-analysis Trialist Group reported that the role of TRT was not clear in pN2 patients and that TRT was even detrimental to early stage patients [7]. Old RT techniques were presumed to have caused the excess intercurrent deaths. However, it was hypothesized that modern TRT techniques might improve both LRC and OS in pN2 patients who also received CTx based on meta-analysis [8]. Several studies have shown that adjuvant CTx concurrently delivered with TRT (CCRT) could provide promising clinical outcomes at tolerable toxicity levels [9-12].
The optimal adjuvant therapy modality for treating pN2 NSCLC patients has not yet been established. However, at our institute, although adjuvant CCRT has mainly been recommended to pN2 patients since 2005, the adjuvant therapy modalities actually delivered were not the same considering the patients’ general status and preference following surgery. Therefore, in the present study, the authors investigated the clinical outcomes following three different adjuvant therapy modalities.
Materials and Methods
1. Patients and initial evaluations
The current study was approved by the Institutional Review Board of Samsung Medical Center (2014-10-137-002) and the authors retrieved the data of 248 consecutive NSCLC patients who underwent curative resection for cN0-1 disease from January 2006 through December 2012 and were found to have pN2 disease according to the seventh American Joint Committee on Cancer (AJCC) staging system. The pretreatment evaluations for diagnostic confirmation and clinical stage assignment included complete history and physical examination, complete blood counts and blood chemistry profiles, pulmonary function tests, simple X-ray, computed tomography (CT) of the chest and upper abdomen, and bronchoscopy with washing cytology and/or biopsy. Wholebody 18F-fluorodeoxyglucose positron emission tomography with CT (PET-CT) was taken in 236 patients (98.3%). Magnetic resonance (MR) image of the brain was recommended if the patients had adenocarcinoma histology or large tumors during the early study period. Brain MR was performed in 205 patients (85.4%) and histopathological evaluation of mediastinal lymphatics was conducted in 105 patients (43.8%) (mediastinoscopic biopsy in 85 patients [35.4%], endobronchial ultrasound-guided transbronchial needle aspiration in 10 patients [4.2%] and by both procedures in 10 patients [4.2%]).
2. Adjuvant therapy modalities
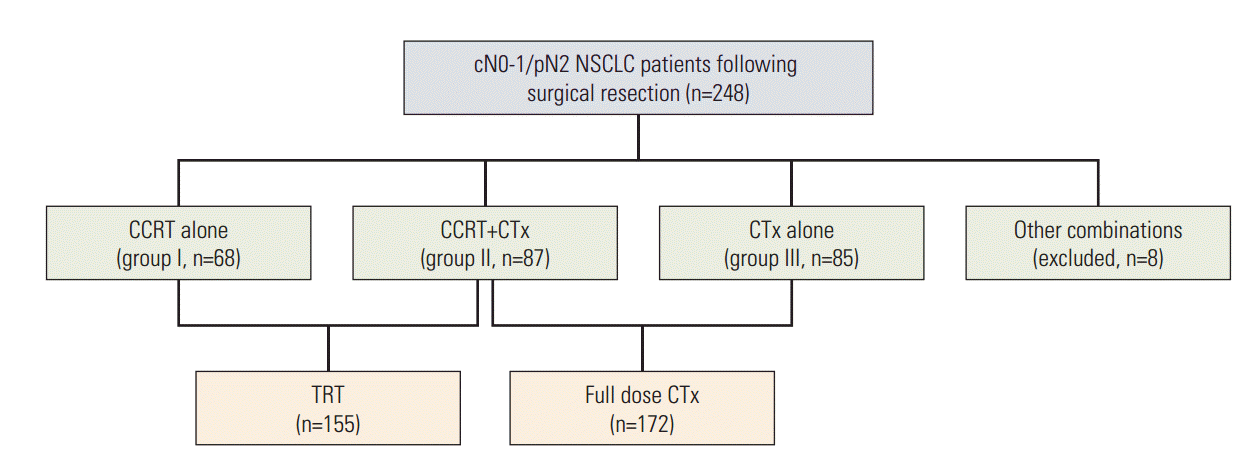
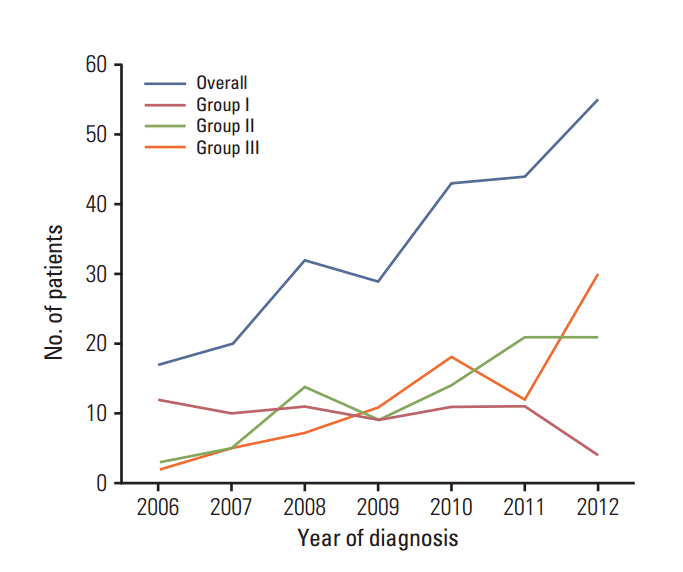
The general consensus of a multidisciplinary lung cancer team at the authors’ institute was to recommend adjuvant CCRT to medically fit patients. The actual assignment of adjuvant therapy modality, however, was modified on an individual basis following interviews with the patients and their family members while considering their postoperative general performance status, cardio-pulmonary functional reserve and the patients’ personal preferences (likes and dislikes) regarding specific modalities. After excluding eight patients (3.2%) who were treated with infrequently used combinations of CTx and TRT, 240 patients received one of three adjuvant therapy modalities: CCRT in 68 patients (group I); CCRT plus consolidation CTx in 87 patients (group II); and CTx alone in 85 patients (group III) (Fig. 1). The number of patients in group I gradually increased during recent years, while those in groups II and III decreased (Fig. 2). TRT and concurrent CTx, either followed by consolidation full dose CTx or not, was delivered to 155 patients (groups I/II, 64.6%), and full dose CTx, either as consolidation CTx or CTx alone, was delivered to 172 patients as a consolidative or a sole modality (group II/III, 71.7%) (Fig. 1).
3. Chemotherapy
The CTx regimens actually delivered are summarized in Table 1. Basically, CTx regimens were selected by responsible medical oncologists and almost all patients received platinum-based regimens. During the TRT course, the vast majority of patients (96.8%) received five weekly cisplatin treatments, and cisplatin alone was preferred in group II (70.1%), while cisplatin doublets were preferred in group I (70.6%). The numbers of planned full dose CTx cycles in groups II/III were 3 and 4, respectively. The CTx dose intensity was generally lower in group I patients than in other groups and in previous adjuvant CCRT studies [9-11,13]. The addition of consolidation CTx following CCRT was initially planned for the patients who received cisplatin monotherapy during TRT in groups I and II. However, 16 patients in group I did not receive consolidation CTx, mainly because of worsened performance status and subsequent patients’ refusal of further CTx.
4. Thoracic radiation therapy
The target volume of TRT included the pathologically involved mediastinal lymphatic station(s) with the adequate upward and downward margins, which typically included the immediately adjacent lymph node stations. However, supraclavicular lymphatics were not electively included within the target volume. The ipsilateral hilar lymphatics and/or the bronchial stump were optionally included if risk factors of extracapsular extension of the hilar node(s) and/or positive or close (< 5 mm) bronchial resection margin were associated. All patients were treated by 3-dimensional conformal RT technique using 6 or 10 MV photons generated by a linear accelerator. The planned TRT dose was 50 Gy in 25 fractions directed to the target volume, with a small volume boost radiation of 10 Gy in five fractions optionally added if less than R0 resection (positive resection margin) was performed.
5. Surveillance and statistical analysis
During and after the adjuvant therapy course, adverse events were evaluated according to the National Cancer Institute Common Terminology Criteria for Adverse Events (CTCAE) ver. 3.0. Regular follow-up evaluations were scheduled following completion of planned adjuvant therapy, which comprised a physical examination, blood tests, chest CT scan, and/or PET-CT at 3 months’ interval for the first 2 years and at 6 months’ interval thereafter. The LR recurrence was defined as relapse within the TRT target volume and/or the regional lymphatics within the mediastinum, while distant metastasis was considered a relapse outside LR recurrence including supraclavicular metastasis, pleural seeding and hematogenous metastases.
The survival durations were calculated from the date of surgery until the date of event (death or relapse) or the date of the latest follow-up. The rates of OS, LRC, distant metastasis-free survival (DMFS), and disease-free survival (DFS) were calculated using the Kaplan-Meier method, and comparisons between subgroups were conducted using the logrank test. Cox proportional hazard regression analysis was used to determine the independent prognostic factors. Statistical analysis was performed using the SPSS ver. 21.0 (IBM Corp., Armonk, NY).
Results
1. Patient characteristics
The characteristics of the patients according to adjuvant therapy modalities are summarized in Table 2. The median age of all patients was 60 years (range, 35 to 78 years), with group III patients being significantly older than group I and II patients (63 years vs. 58 years vs. 58 years, respectively; p=0.022). About two-thirds of all patients had cN0 stage (64.6%) and the vast majority had cT1-2 stage (92.1%). Over two-thirds of the patients had adenocarcinoma histology in 165 patients (68.8%), followed by squamous cell carcinoma in 53 patients (22.1%). Following surgery, 130 patients (54.2%) had single mediastinal lymph node involvement and 110 (45.8%) had multiple mediastinal node involvement, while 189 (78.8%) had single station involvement and 51 (21.2%) had multi-station involvement.
There were no significant differences in the characteristics of patients who received TRT (groups I/II) and those who did not (group III). Patients who received full dose CTx (groups II/III) had pT1 disease more frequently than those who did not (group I), without significance (p=0.062). Otherwise, there were no significant differences between the patients who received full dose CTx (groups II/III) and those who did not (group I).
2. Toxicity and compliance to treatment
Grade 3 or higher hematologic toxicities were observed in 61 patients (25.4%), being more frequent in patients who received full dose CTx (13.2% vs. 35.6% vs. 24.7%, p=0.006) (Table 3). Grade 3 or higher non-hematologic toxicities were observed in nine patients (3.8%), esophagitis in five (2.1%), pneumonitis in two (0.8%), nausea/vomiting in one (0.4%), and peripheral neuropathy in one (0.4%). Compliance to TRT and weekly CTx was excellent, with 97.4% of the groups I/II patients being able to complete the planned CCRT. The median total TRT dose actually delivered was 50 Gy (44-54 Gy), and there were four patients who received less than 50 Gy. Specifically, three received 48 Gy because of patient personal reasons, while one received 44 Gy because of worsened performance status. A total of 38 patients (15.8%) (four [5.9%] in group I, 20 [23.0%] in group II, and 14 [16.5%] in group III) could not complete the planned CTx, mainly due to grade 3 or 4 hematologic toxicities.
3. Clinical outcomes
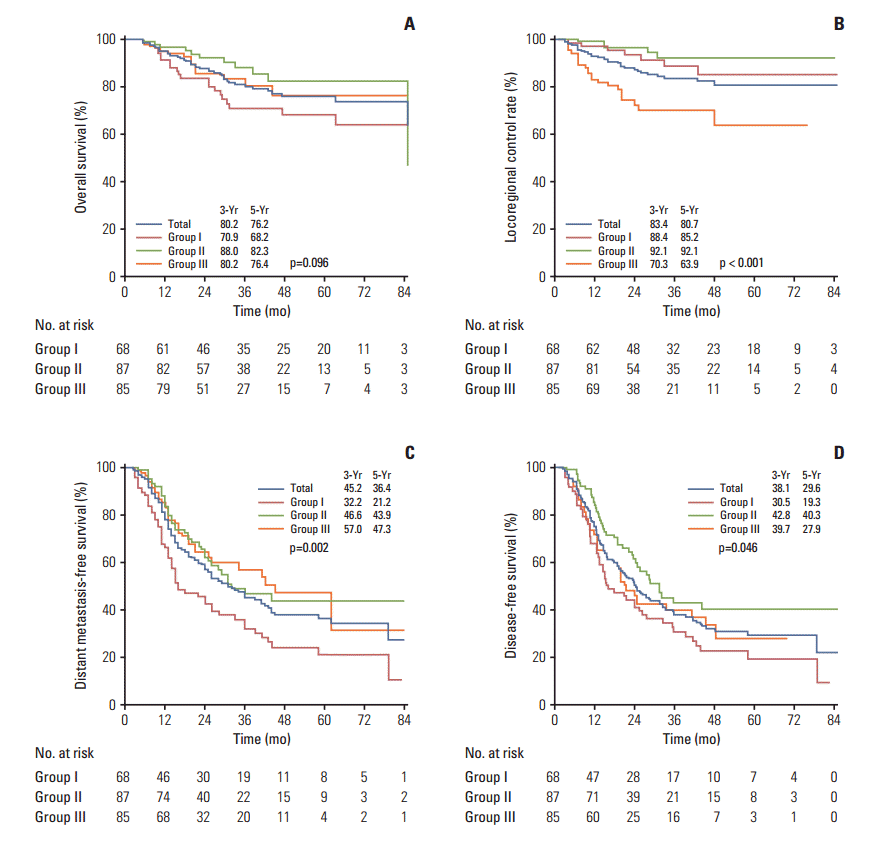
During a median of 30 months follow-up (rage, 5 to 93 months), 44 patients died and 141 developed any type of recurrence, with LR recurrence occurring in 35 and distant metastasis in 124. The 3- and 5-year OS rates of all patients were 80.2% and 76.2%, respectively, and there were no significant differences among groups (68.2% vs. 82.3% vs. 76.4%, p=0.096) (Fig. 3A). The most common sites of LR recurrence were the regional lymph nodes in 29 patients (12.1%) and the bronchial stump in 10 patients (4.2%). The lung was the most common metastatic organ in 36 patients (15.0%), followed by bone in 30 (12.5%) and the brain in 26 (10.8%). The 3- and 5-year LRC rates of all patients were 83.4% and 80.7%, respectively, and patients who received TRT (groups I/II) had significantly better 5-year LRC rates than those who did not (group III) (85.2% vs. 92.1% vs. 63.9%, p < 0.001) (Fig. 3B). The 3- and 5-year DMFS rates of all patients were 45.2% and 36.4%, respectively, and those who received full dose CTx (groups II/III) had significantly better 5-year DMFS than those who did not (group I) (21.2% vs. 43.9% vs. 47.3%, p=0.002) (Fig. 3C). The 3- and 5-year DFS rates of all patients were 38.1% and 29.6%, respectively, and the patients who received CCRT plus consolidation CTx (group II) had significantly better 5-year DFS rates than the others (groups I/III) (19.3% vs. 40.3% vs. 27.9%, p=0.046) (Fig. 3D).
4. Prognostic factors
The clinical outcomes were calculated according to 12 potential prognostic variables and were compared by univariate analyses: five presurgical factors of age (≤ 60 years vs. > 60 years), sex (female vs. male), performance status (Eastern Cooperative Oncology Group 0 vs. 1), clinical stage (I vs. II/III), and cN stage (cN0 vs. cN1); three treatmentrelated factors of type of surgery (lobectomy vs. pneumonectomy), TRT (no vs. yes), and full dose CTx (no vs. yes); and four postsurgical factors of histologic type (adenocarcinoma vs. others), pT stage (pT1-2 vs. pT3), number of involved N2 nodes (single vs. multiple), and involved N2 stations (single station vs. multi-station) (Table 4). Several significantly favorable factors were identified by multi-variate analyses: pT1/2 stage (81.6% vs. 43.3%, p < 0.001) and single pN2 involvement (79.7% vs. 71.6%, p=0.049) in OS; addition of TRT (88.8% vs. 63.9%, p < 0.001) in LRC; pT1-2 stage (40.0% vs. 15.7%, p=0.005), addition of full dose CTx (45.9% vs. 21.2%, p=0.015), and non-adenocarcinoma histology (52.0% vs. 27.9%, p=0.010) in DMFS; and pT1/2 stage (32.3% vs. 15.1%, p=0.011), addition of full dose CTx (35.5% vs. 19.3%, p=0.011) and non-adenocarcinoma histology (45.7% vs. 20.8%, p=0.006) in DFS.
Discussion
Based on the high incidence of distant metastasis, it has been well accepted that systemic CTx should be added following surgery for patients with pN2 NSCLC, and OS benefit in response to adding CTx has been confirmed through a few large phase III trials and meta-analysis [7,14-17]. However, adjuvant CTx alone appears insufficient with respect to LRC. The role of TRT following surgery used to be questioned because of the absence of OS benefit and its potential detrimental effects [7]. However, subgroup analysis of the Adjuvant Vinorelbine International Trialist Association (ANITA) study revealed that the addition of TRT following CTx could improve both OS and LRC in pN2 patients, regardless of adjuvant CTx, when the decision regarding adding TRT was not randomized, but instead left to the discretion of the participating institutions [14,18]. In addition to the results of a Surveillance, Epidemiology, and End Results Database review and meta-analysis [8,19], a recent National Cancer Database review concluded that modern TRT following CTx could confer an additional OS advantage beyond that achieved with adjuvant CTx alone in pN2 patients following resection and CTx [20]. One European multicenter randomized study, the Lung Adjuvnat Radiotherapy trial (Lung ART), which is currently ongoing and randomizes completely resected pN2 patients either to adjuvant TRT or to observation with or without adjuvant CTx is expected to further clarify the role of TRT [21].
Optimal adjuvant therapy strategy and sequence in clinically unforeseen pN2 patients has not yet been clearly defined. However, a few studies have investigated the efficacy of TRT that was delivered concurrently with CTx. Two phase II studies reported favorable OS with tolerable toxicity profiles in response to CCRT plus consolidation CTx [9,10]. In both of these studies, the first two cycles of doublet CTx regimens, among a total of four cycles, were concurrently delivered during TRT course. In 2000, the Eastern Cooperative Oncology Group (ECOG) reported the outcomes of a phase III study that compared TRT alone and CCRT plus consolidation CTx in pathologic II/IIIA stage patients [13]. CCRT plus consolidation CTx improved neither LRC nor OS when compared to TRT alone in the ECOG trial. In 2014, another Chinese phase III study compared CTx alone and CCRT plus consolidation CTx in pathologic stage IIIA-N2 patients [11]. When compared with CTx alone, CCRT plus consolidation CTx could decrease the rates of local relapse (34/69 vs. 18/66, p=0.009) and distant metastasis (45/69 vs. 32/66, p=0.050). The 5-year OS rate also was improved in CCRT plus consolidation CTx group but without significance (27.5% vs. 37.9%, p=0.073).
The authors were able to compare the clinical outcomes following three different adjuvant therapy modalities though the current study: CCRT alone; CCRT and full dose CTx; and full dose CTx alone. The authors were able to achieve a 5-year OS rate of 76.2%, which seemed outstandingly favorable when compared with other studies. However, the 5-year DMFS was 36.4%, which was rather unsatisfactory. This could likely be explained by the fact that over two-thirds of all patients (68.8%) had adenocarcinoma histology. Excellent and significantly higher LRC rates were achieved in groups I/II, in which TRT was employed (85.2% vs. 92.1% vs. 63.9%, p < 0.001). These findings are consistent with those of previous studies, and the current study could strongly support the role of TRT in improving LRC. Moreover, control of systemic metastasis was significantly improved by full dose CTx in groups II/III (21.2% vs. 43.9% vs. 47.3%, p=0.002). The current and previous studies used similar CTx regimens of platinum and taxane doublets. The significantly lower DMFS observed in group I could be explained by lower CTx dose intensity in this group. Conversely, group II patients who received CCRT plus full dose CTx could achieve the most favorable outcomes in LRC, DFS, and OS. This could be interpreted as higher CTx dose intensity leading to improved disease control within the thorax and in distant organs. The favorable OS rate even with frequent occurrences of systemic metastasis could partly be explained by the availability of effective systemic treatment regimens, including the target agents. In the current study, we also found a high rate of distant failure and poor survival rates in patients with advanced pT stage and/or multiple lymph node involvement. Accordingly, further additional efforts to overcome these unfavorable factors may be warranted.
It should be noted that this study had several limitations. First, the current study must have had an inadvertent selection bias. Actually, there were more patients (though not significant) with pT3 in group I and multi-station N2 involvement in group II than in the other groups, and the patients in good performance status naturally tended to receive more CTx cycles in groups II/III. Second, there was great heterogeneity in patient enrollment along the time frame (Fig. 2). Specifically, 80% of the group II/III patients and less than half of the group I patients were enrolled after 2009. Third, the proportion of the patients having adenocarcinoma histology appeared to be greater in the current study than in previous investigations. This may have resulted in a relatively high incidence of distant metastasis, and the effect of improved LRC by TRT may have been weakened accordingly. Although the authors attempted to control the problem of unequal distributions of important prognostic variables among groups, the current study likely suffered from its retrospective nature. Despite these limitations, the current study has a few strengths: namely, a large number of patients were included; a rigorous pretreatment staging evaluation was performed; most patients underwent meticulous lymph node dissection; and homogeneity was endorsed in the participating physicians and the treatment strategy over a long period of time at a large-volume tertiary institute. Despite the selection bias, the current study supported the facts that TRT could improve LRC, that full dose CTx could improve DMFS and that CCRT plus consolidation CTx could improve DFS with tolerable toxicities. The benefit by CCRT plus consolidation CTx was even greater in patients with good performance status. CCRT plus consolidation CTx could reduce the total duration of postoperative treatment course when compared to sequential CTx and TRT, which is regarded as the current standard. Optimal target delineation may further reduce the toxicity of CCRT. However, further larger scale prospective clinical trials with longer follow-up periods should be conducted.
Based on the current observation on patients with pN2 disease following curative resection for having apparently cN0-1 disease, addition of TRT could improve LRC, addition of full dose CTx could improve DMFS and addition of CCRT plus consolidation CTx could improve DFS.