Introduction
Angiogenesis is an essential component of tumorigenesis, and it has been an important target for development of new anti-cancer drugs. Antiangiogenic approach has mainly focused on preventing neovascularization. In contrast, antivascular approach targets endothelial cells and pericytes of the already established tumor vasculature. The new class of tubulin-binding agents, named vascular disrupting agents (VDAs), has been developed to target microtubules, not only in cancer cells, but also in the endothelium of tumor vessels [1]. These VDAs work by acting on the β-subunit of endothelial tubulin, resulting in depolarization of microtubules and disorganization of actin and tubulin, which leads to a major change in endothelial cell shape, increased vascular permeability, increased interstitial pressure followed by inhibition of blood flow and vasoconstriction [2]. The result is a rapid decrease of blood flow into the tumor and necrosis. Several VDAs are under clinical development including ombrabulin, ZD6126, etc. [3-5].
CKD-516 is a newly developed VDA. Its active drug (S-516) has a potent cytotoxicity against several cancer cells, including a P-glycoprotein overexpressing cell line (HCT15). It induces cell cycle arrest at G2/M phase, and strong inhibition of tubulin polymerization. It has shown marked antitumor efficacy against both murine tumors (CT26 and 3LL) and human xenografts (HCT116 and HCT15) in mice [6,7]. CKD-516 also enhances the antitumor effect of cytotoxic chemotherapy when administered in combination [8,9].
These promising preclinical data led to this phase I, firstin-human study of CKD-516 in patients with advanced solid tumors. The primary objective was to determine the maximum-tolerated dose (MTD) of CKD-516 when administered intravenously on day 1 and day 8 every 3 weeks. Assessment of safety and the pharmacokinetics (PK) were also primary objectives. Secondary objectives included assessment of preliminary antitumor efficacy.
Materials and Methods
This was a phase I, first-in-human, dose-escalation study of CKD-516 in patients with advanced solid tumors conducted at Seoul National University Hospital and Seoul National University Bundang Hospital. This study was approved by the Institutional Review Boards of each hospital and was registered with the United States National Library of Medicine (ClinicalTrials.gov) as NCT01028859.
1. Patient eligibility criteria
The following inclusion criteria were used for patient selection: (1) histologically confirmed solid tumors refractory to standard therapy or for which there is no standard therapy; (2) age, 20 to 75 years; (3) Eastern Cooperative Oncology Group (ECOG) performance status (PS), ≤ 2; (4) life expectancy of longer than 12 weeks; (5) adequate organ function (adequate hematologic function) ≥ 1,500/μL, platelet count ≥ 100,000 cells/μL, hemoglobin ≥ 9.0 g/dL, serum creatinine ≤ 1.5×upper limit of normal (ULN), serum bilirubin ≤ 1.5×ULN, aspartate transaminase, alanine aminotransferase ≤ 3×ULN [5×UNL in case of liver metastasis]); and (6) normal range of prothrombin time, activated partial thromboplastin time. Written informed consent was obtained from all patients. The important exclusion criteria were (1) central nervous system metastasis; (2) prior chemotherapy, radiation therapy, or surgery within 4 weeks prior to enrolling in the study; (3) heart failure, angina pectoris, New York Heart Association (NYHA) class III, IV congestive heart failure within 6 months of study; (4) uncontrolled hypertension (systolic blood pressure > 150 mm Hg or diastolic blood pressure > 100 mm Hg despite anti-hypertensive medication); and (5) under anticoagulation.
2. Treatment
CKD-516 was administered as a 30-minute intravenous infusion on day 1 and day 8 every 3 weeks. The starting dose was 1 mg/m2/day, and dose was escalated using 3+3 design and modified Fibonacci method. In each cohort, if a patient was withdrawn for any reason other than dose limiting toxicity (DLT) before completion of the 21-day administration period, the patient was replaced by another patient. Response was evaluated every two cycles. However, whenever disease progression was suspected, the response evaluation was allowed at the investigator’s discretion. Patients in whom antitumor effect was assessed as stable disease (SD), partial response (PR), or complete response (CR) for overall response at the end of the second cycle of treatment were allowed to receive further treatment. Treatment was to be continued until the subject experienced disease progression or unacceptable toxicity, withdrew consent, or required treatment with another therapeutic modality.
3. Definition of dose limiting toxicity
DLT was defined as follows: (1) grade 4 neutropenia lasting for ≥ 7 days or with fever; (2) grade 3-4 thrombocytopenia lasting for ≥ 7 days, or with bleeding or required platelets transfusion; (3) grade 3 or 4 nausea/vomiting or diarrhea despite optimal use of antiemetic drugs or antidiarrheal drugs; (4) other grade 3 or 4 non-hematological toxicity (except alopecia and anorexia); and (5) delay of > 2 weeks in administration of the next cycle due to inadequate recovery from toxicity of the first cycle. DLT was evaluated during the first cycle of treatment. The lowest dose at which DLT was observed in no more than two out of six patients in the first cycle of treatment was judged to be the MTD.
4. PK study procedure
Blood was collected on day 1 before and at the end of infusion, 10 minutes, 20 minutes, 30 minutes, 1 hour, 2 hours, 4 hours, 8 hours, 12 hours, and 24 hours after dosing. Urine was collected on day 1, 0-4 hours, 4-8 hours, 8-12 hours, and 12-24 hours after dosing. Plasma and urine concentrations of CKD-516 and its active metabolite S-516 were determined using a validated liquid chromatography-tandem mass spectrometry (LC-MS/MS) method with mosapride as an internal standard. Briefly, 200 μL of plasma or urine, methyl tert-butyl ether 1.5 mL, and mosapride 50 μL at 10 ng/mL were mixed thoroughly and centrifuged at 5,000 g for 5 minutes. The organic layer was separated and evaporated; the residue was reconstituted with 100 μL of 80% methanol, diluted 2-fold with mobile phase, and injected into the LC-MS/MS system. Chromatographic separation was performed on a Luna C18 column (50×2.0 mm, i.d., 5 μm; Phenomenex, Torrance, CA) under the isocratic condition using 0.05% formic acid in 10 mM ammonium formate and acetonitrile (70:30, v/v). The multiple-reaction monitoring was based on m/z transition of 537 > 270 for CKD-516, 438 > 270 for S-516, and 422 > 198 for mosapride (IS). The calibration ranges were linear with a lower limit of quantification of 0.5 ng/mL for CKD-516 and 0.2 ng/mL for S-516 in both human plasma and urine. The inter-assay precision and accuracy of the quality control (QC) samples were less than 9.54% and from 91.1% to 107%, respectively. Each analytical batch had six QC samples of known value, i.e., two for low, intermediate, and high concentrations, respectively. The analytical results were accepted only if the concentrations of > four out of the six QC samples were determined within 15% of the known values.
5. Assessment of outcomes
Safety and tolerability were measured by adverse events (AEs), vital sign, body weight, electrocardiogram (ECG), and laboratory tests. Safety was assessed according to the National Cancer Institute Common Terminology Criteria for Adverse Events (NCI-CTCAE) ver. 4.02. PK parameters of CKD-516 and S-516 were calculated using the noncompartmental method with Phoenix WinNonlin 6.1 (Pharsight, Mountain View, CA). The pharmacokinetic linearity was assessed by linear regressions between dose and Cmax or AUClast and between log-transformed dose and log-transformed Cmax or log-transformed AUClast. Efficacy was measured using Response Evaluation Criteria in Solid Tumor (RECIST) ver. 1.1. Tumor responses were assessed after the first cycle or earlier in patients with suspected progression.
Results
1. Study population
A total of 23 patients received the investigational product. Baseline characteristics of patients are shown in Table 1. Median age was 56 years (range, 33 to 70 years). Thirteen patients (56.5 %) were male. Nine patients (39.1%) had ECOG PS 0, 13 patients (56.5%) had ECOG PS 1, and one patient had ECOG PS 2. The most common tumors were colorectal cancer (n=11) and lung cancer (n=3). Seventy-eight percent of patients had previously received more than three kinds of chemotherapies.
2. Dose escalation and DLTs
The investigational products were administered at doses of up 12 mg/m2/day. DLT was reported in two patients in the 12 mg cohort, which were grade 3 hypertension. One patient with DLT had hypertension, and the blood pressure was increased up to grade 3 at 1 hour (164/96 mm Hg) and 4 hours (155/95 mm Hg) after infusion of CKD-516. However, the blood pressure was normalized at 8 hours after infusion without any intervention. The other patient with DLT showed elevation of blood pressure up to grade 3 (175/95 mm Hg) at 4 hours after infusion of CKD-516 and received anti-hypertensive medication (nicardipine), which led to the normalization of blood pressure 8 hours after infusion. There was no abnormality in troponin I, CPK-MB, and ECG in both DLT cases. The MTD of CKD-516 was determined as 12 mg/m2/day.
3. Adverse events
A total of 58 cycles of CKD-516 were administered to the patients. Most commonly reported AEs during all treatment periods were gastrointestinal AE, that is, diarrhea (34.8%; 30.4% grade 1/2, 13.0% grade 3), nausea (21.7%, all grade 1/2), and vomiting (21.7%, all grade 1/2) (Table 2). Grade 1/2 anorexia and myalgia were 30.4% and 17.4%, respectively. Abdominal pain occurred in 21.7% (grade 1/2, 21.7%; grade 3, 4.3%). Grade 1/2 neutropenia and thrombocytopenia were reported as 4.3% and 4.3%. Anemia occurred in 8.7% (grade 1/2, 8.7%; grade 3, 4.3%). Hypertension was observed two patients (two DLT cases [grade 3, 8.7%], one patient [grade 2, 4.3%] ). One patient (4.3%) had grade 3 acute coronary syndrome.
4. Pharmacokinetic analysis
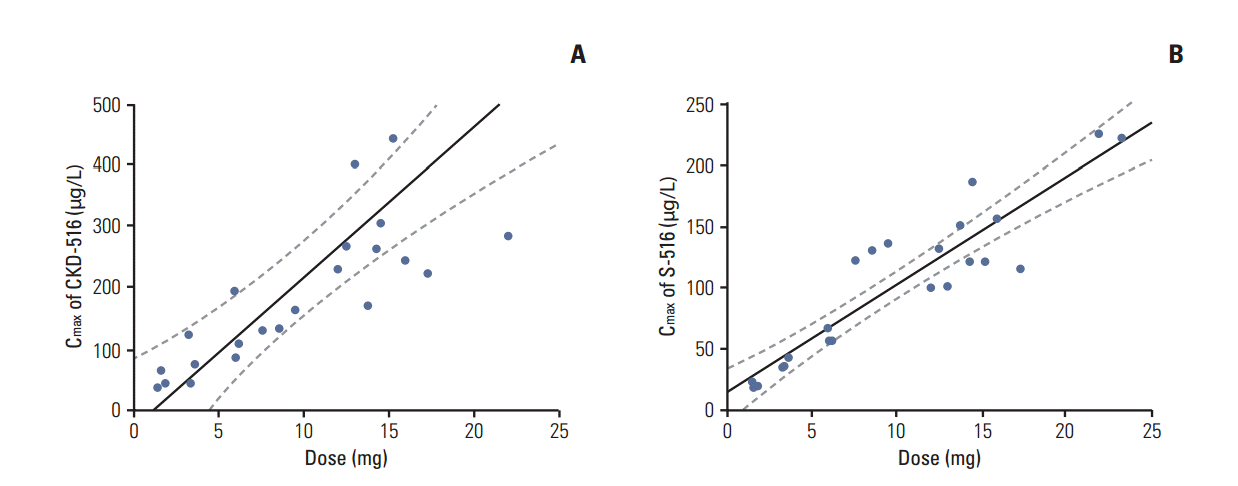
The plasma concentration-time profiles of CKD-516 and its metabolite S-516 showed a similar trend at all dosing levels (Table 3). Cmax of CKD-516 were 45.88±15.04 μg/L (mean±standard deviation), 78.89±39.99 μg/L, 129.02±55.50 μg/L, 140.93±17.56 μg/L, 297.33±89.29 μg/L, 273.32±93.37 μg/L, and 646.75±513.71 μg/L at seven dosing levels, respectively. Cmax of S-516 were 19.65±2.38 μg/L, 37.52±3.72 μg/L, 59.75±5.83 μg/L, 128.83±7.12 μg/L, 110.43±17.30 μg/L, 141.20±27.74 μg/L, and 222.75±3.04 μg/L at seven dosing levels, respectively (Fig. 1). CKD-516 underwent almost complete biotransformation to S-516 with only < 1% of unchanged CKD-516 excreted in the urine. A good linear relationship between dose and PK parameters indicated the linear pharmacokinetic characteristics of CKD-516 and S-516 over all dose levels (Fig. 2).
5. Antitumor activity
Response evaluation was possible in all 23 patients. None of the patients had CR or PR response. Six patients were assessed as SD (26.1%) and 17 patients showed progressive disease (73.9%). One patient showed 2.8% tumor reduction. Median progression-free survival was 39 days (95% confidence interval, 37 to 41 days). Three patients received the study treatment up to six cycles (1 osteosarcoma at 1 mg, 1 renal cell carcinoma at 3.3 mg, 1 colon cancer at 3.3 mg). The reasons for termination of treatment were disease progression (21 patients), no recovery of disease-related condition within 5 weeks (1 patient), and investigator’s discretion (1 patient).
Discussion
This was the phase I, first-in-human study of novel VDA, CKD-516, administered on D1 and D8 every 3 weeks in patients with advanced solid tumors. The result provides evidence of the tolerability of a VDA in patients with solid tumor. The MTD was defined as 12 mg/m2/day. The DLT was grade 3 hypertension. Up to the MTD, most common AEs were gastrointestinal AEs. The PK of CKD-516 and its metabolite (S-516) were demonstrated in this study, which showed the linear PK.
We had two DLT patients. One patient had colon cancer and previously received standard chemotherapies (XELOX, FOLFIRI, capecitabine). This patient had a history of hypertension without other cardiac disease and had received antihypertensive medication. The baseline blood pressure before infusion of CKD-516 was 125/82 mm Hg, and was increased up to grade 3 at 1 hour (164/96 mm Hg) and 4 hours (155/95 mm Hg) after infusion of CKD-516, and normalized at 8 hours without any intervention. The other patient had ampulla of Vater cancer with treatment history of gemcitabine, cisplatin, and 5-fluorouracil. The baseline blood pressure before infusion of CKD-516 was 119/77 mm Hg. After 1 hour of infusion, blood pressure was 111/75 mm Hg, and elevated up to grade 3 (175/95 mm Hg) at 4 hours and anti-hypertensive medication was administered, which led to the normalization of blood pressure at 8 hours.
The most commonly reported DLTs for other VDAs under development are cardiac-related events including hypertension, corrected QT (QTc) prolongation, myocardial ischemia, atrial fibrillation, acute chest pain, acute reversible coronary ischemia, hypotension, troponin elevation or motor neuropathy or tumor pain [10-15]. Other frequently reported AEs are diarrhea, nausea, vomiting, fatigue, and headache. Therefore, the findings in our study are consistent with those of other studies testing VDAs.
For the toxicity pattern, dose modification or cycle delay of subsequent treatment after the first cycle, a total of 58 cycles were delivered to all enrolled patients (10 cycles in 1.0 mg, 5 cycles in 2.0 mg, 16 cycles in 3.3 mg, 4 cycles in 5.0 mg, 6 cycles in 7.0 mg, 10 cycles in 9.0 mg, and 7 cycles in 12.0 mg). Only two patients who showed DLTs were treated with a reduced dose in subsequent cycles. No other patient required dose reduction or delay in the subsequent treatments. Toxicity pattern in subsequent cycles was similar to that of the DLT observation cycle. Gastrointestinal AEs (diarrhea, nausea, and anorexia) were most common followed by myalgia and arthralgia. Most were grade 1/2. During all subsequent treatment cycles, no further grade of hypertension was detected.
The vascular disrupting effect of CKD-516 was previously evaluated with intravoxel incoherent motion diffusionweighted magnetic resonance imaging (MRI) or dynamic contrast-enhanced ultrasonography in a rabbit VX2 liver tumor model [16,17]. In our study, to observe the vascular disrupting effect of CKD-516 by dynamic contrast-enhanced MRI (DCE-MRI), 13 patients were evaluated by DCE-MRIs taken at screening and 24 hours after the first infusion of CKD-516. A trend of decreased Ktrans and initial area under the curve (iAUC) was observed [18]. The reason for checking DCE-MRI at 24 hours after infusion of CKD-561 was based on previous animal data. The half-life of S-561, the active metabolite of CKD-561, was 85.1 minutes in dog. In an in vivo absorption experiment, the half-life of CKD-516 was 8.05 hours in dog. We hypothesized that the change of blood flow will take place within at least 3 to 4 times of half-life, around 24 hours. Actually, the half-life of S-516 in our study ranged from 4-6 hours.
We checked 5-hydroxyindoleacetic acid (5-HIAA) plasma concentration at pretreatment, 4 hours and 8 hours of CKD-516 infusion to determine whether the action mechanism of CKD-516 is associated with serotonin release, which was reported in other VDAs [19]. The levels of 5-HIAA of all patients were normal and there was no significant change of 5-HIAA levels after infusion of CKD-516, therefore, we concluded that the action mechanism of CKD-516 was not associated with serotonin release.
In terms of antitumor efficacy, there was no CR/PR patient. Three patients received CKD-516 up to six cycles (1 osteosarcoma, 1 renal cell carcinoma, 1 colon cancer). In our study, we used RECIST ver. 1.1 for evaluation of efficacy in accordance with other previous studies of VDAs.
Based on limited data, selection of optimal tumor types for further development of VDAs is challenging. So far, there have been no biomarkers for prediction of the efficacy of VDAs. Based on the preclinical combination study of VDAs with cytotoxic chemotherapies, one of the future strategies for development of VDAs is combination with cytotoxic chemotherapy.
The half-life of CKD-516 in our study was relatively short. Now, a different dosing schedule of CKD-516 is under investigation (ClinicalTrials.gov identifier: NCT01560325). In this another phase I study, we are testing D1, D4, D8, and D11 infusion of CKD-516 out of a 21-day cycle. Using the result of this phase I study altogether, we will decide on the clinically recommended dose and schedule.