AbstractPurposePatients show variable responses to chemoradiotherapy (CRT), which is generally administered before surgery for locally advanced rectal cancer (LARC). The aim of this study was to identify molecular markers predictive of CRT responses by analysis of low-mass ions (LMIs) in serum of LARC patients.
Materials and MethodsLMIs (< 1,000 m/z) in serum obtained before CRT from 73 LARC (cT3-4) patients were profiled using matrix-assisted laser desorption/ionization mass spectrometry. LMIs with higher weighting factors in discriminating CRT responses were selected using principal components analysis and discriminant analysis. Selected LMIs were identified using the Human Metabolome Database. The concentrations of identified LMIs were determined by colorimetric enzyme assay, and compared according to post-CRT pathological stage (ypStage) or Dworak’s tumor regression grade (TRG).
ResultsThe nine highest-ranking LMIs were selected. Among them, two LMIs with 137.08 and 169.04 m/z were identified as hypoxanthine (HX) and phosphoenolpyruvic acid (PEP), respectively. Higher HX concentration was observed in patients with ypStage 0-1 compared to ypStage 2-4 (p=0.034) or ypStage 3-4 (p=0.030); a similar difference was observed between TRG 4-3 and TRG 1 (p=0.035). HX > 16.0 μM showed significant association with ypStage 0-1 or TRG 4-3 than ypStage 3-4 (p=0.009) or TRG 1 (p=0.024), respectively. In contrast, a significantly lower concentration of PEP was observed in TRG 4-3 compared with TRG 2-1 (p=0.012).
IntroductionThe established benefits associated with administration of chemoradiotherapy (CRT) before surgery, including improved local disease control and toxicity, have led to a paradigm shift from postoperative CRT to preoperative CRT for patients with locally advanced rectal cancer (LARC) [1]. Parallel to this paradigm shift, a diverse range of CRT responses among patients can be identified earlier in surgical tumor specimens, from no response to a pathological complete response (ypCR). ypCR has been shown to indicate a prognostically favorable biological tumor behavior, with low propensity for disease recurrence and improved survival [2]. Therefore, markers predicting the pathological CRT response before treatment can be valuable in implementing risk-adapted strategies for each patient; intensification of preoperative regimens may be considered in patients whose tumors are expected to show poor response to standard CRT. Research is actively ongoing for development of useful tools that can offer reliable information on biological tumor profiles that are associated with CRT response [3].
We previously reported on a novel diagnostic marker for non-Hodgkin’s lymphoma (NHL) using information obtained from low-mass ions (LMIs; i.e., <1,000 m/z) in urine samples [4]. Similarly, analysis of LMIs in serum can be performed using a matrix-assisted laser desorption/ionization (MALDI)-mass spectrometer (MS). In the current study, we investigated the profiling patterns of LMIs in the serum of LARC patients who showed various pathological responses to preoperative CRT. Two metabolic compounds, hypoxanthine (HX) and phosphoenolpyruvic acid (PEP), were identified as showing significant association with the degree of CRT response. Herein, we describe the potential utility of LMI profiling for prediction of CRT response in patients with LARC before treatment.
Materials and Methods1. Serum obtained from LARC patientsSeventy-three patients with LARC (cT3 or cT4) who underwent preoperative radiotherapy and concurrent chemotherapy at the National Cancer Center (Goyang, Korea) were included in this study. The median age of patients was 63 years (range, 45 to 84 years) and 53 patients (72.6%) were male. Approximately 6 mL of blood were obtained from each patient before treatment. Blood was drawn into serum separating tubes and centrifuged at 2,000 ×g for 10 minutes at room temperature. The serum was removed, aliquoted into polypropylene capped tubes, and stored at –70°C until analysis. All sera were labeled with a unique number and the patient information was concealed. The study was approved by the Institutional Review Board (National Cancer Center).
2. CRT methods and pathological CRT responsePreoperative radiotherapy was delivered to the whole pelvis at a dose of 45 Gy in 25 fractions, followed by a 5.4 Gy boost in three fractions within six weeks. All patients underwent computed tomography simulation for three-dimensional conformal radiotherapy planning, and a three-field treatment plan used a 6-MV photon posterior–anterior field and 15-MV photon opposed lateral beams. Preoperative chemotherapy was administered using 5-fluorouracil and leucovorin: two cycles of an intravenous bolus injection of 5-fluorouracil (400 mg/m2/day) and leucovorin (20 mg/m2/day) for three days during the first and fifth weeks of radiotherapy. At a median of six weeks (range, 4 to 8 weeks) following completion of preoperative CRT, patients underwent radical proctectomy. Surgical tumor specimens were reviewed and the pathological stage was determined according to the TNM classification system recommended by the American Joint Committee on Cancer 7th edition [5]. In addition to the post-CRT pathological stage (ypStage), the degree of CRT response was also evaluated using the tumor regression grade (TRG) system proposed by Dworak et al. [6]: grade 0, no regression; grade 1, minimal regression; grade 2, moderate regression; grade 3, near-complete regression; and grade 4, complete regression.
Favorable and poor pathological CRT responses were divided according to five classifications: 1) ypStage 0 (n=12) vs. ypStage 1-4 (n=61), 2) ypStage 0-1 (n=26) vs. ypStage 2-4 (n=47), 3) TRG 4-3 (n=15) vs. TRG 2-1 (n=58), 4) ypStage 0-1 (n=26) vs. ypStage 3-4 (n=30), and 5) TRG 4-3 (n=15) vs. TRG 1 (n=12). In an attempt to increase the discriminating power, intermediate responses of ypStage 2 (n=17) or TRG 2 (n=46) were excluded in the last two classifications.
3. MALDI time-of-flight analytical conditions for collection of LMIs in serumSerum samples (25 μL) were mixed with 100 μL of methanol and chloroform (2:1, v/v), mixed by vortexing, and then incubated for 10 minutes at room temperature. The samples were centrifuged at 6,000 ×g for 10 minutes at 4°C. The supernatant was dried for 1 hour using a concentrator and then suspended in 30 μL of 50% acetonitrile/0.1% trifluoroacetic acid (TFA) by vortexing for 30 minutes.
Methanol/chloroform-extracted serum samples were mixed (1:12, v/v) with an α-cyano-4-hydroxycinnamic acid solution in 50% acetonitrile/0.1% TFA. The mass spectra of cancer serum samples were analyzed using a 4700 Proteomics Analyzer (AB SCIEX, Foster City, CA). The mass-spectral data present the average of 20 accumulated spectra.
4. LMI selectionAll MALDI mass spectra, formatted as *.t2d files, were analyzed using MarkerView software ver. 1.2 (AB SCIEX). The optimized parameters used for comparison of LMI peaks in serum from rectal cancer patients were as follows: mass tolerance, 100 ppm; minimum required response, 100; maximum number of peaks, 10,000; normalization, total area sums and Pareto-scaling. After collecting peaks from MALDI mass spectra, principal components analysis and discriminant analysis (PCA-DA), and Student’s t-test were used for identification of LMIs with differential peak intensities in serum.
5. Nanospray ionization-MS/MS for LMI identificationHuman Metabolome Database listed candidate metabolites having the same mass information with selected LMI, and nanospray ionization (NSI)-MS/MS was performed for analysis of the MS/MS patterns of LMIs. Each LMI was finally identified by comparing the MS/MS pattern of the candidate metabolite with that of the selected LMI [4]. A syringe pump was used to introduce the calibration solution for automatic tuning and calibration of the mass spectrometer (LTQ-XL, Thermo Fisher Scientific Inc., Waltham, MA) in NSI positive-ion mode. Standard solutions (1 μM PEP or 1 μM HX) were infused directly into the ionization source of the mass spectrometer using a syringe pump (1.0 μL/min) without chromatographic separation. The spray voltage was set at +1.8 kV; the temperature of the capillary was set at 200°C; the capillary voltage was set at +20 V; the tube lens voltage was set at +100 V; and the auxiliary gas was set to zero. Full-scan experiments were performed on the linear trap in the range of 100-2,000 m/z. Systematic MS/MS experiments were performed by changing the relative collisional energy and monitoring the intensities of the fragmentations. MS/MS data were acquired from methanol/chloroform-extracted serum samples.
6. Quantification of HX, xanthine, and PEP in serumColorimetric assays were performed for comparison of the serological HX, xanthine (X), and PEP levels in patient groups with different responses to CRT. The concentrations of HX and X in sera were quantified using the Amplex Red Xanthine/Xanthine Oxidase Assay Kit (Molecular Probes Inc., Eugene, OR) and the level of PEP in serum was determined using the PEP Colorimetric/Fluorometric Assay Kit (BioVision Inc., Milpitas, CA) according to the manufacturers’ instructions.
7. Statistical analysisThe concentrations of HX, X, and PEP in serum were compared according to the pathological CRT response using Student’s t-test. The threshold level of HX, X, or PEP discriminating the pathological CRT response was determined using a receiver operating characteristics (ROC) analysis. Pearson’s chi-squared test or Fisher’s exact test was used for analysis of pretreatment parameters associated with the pathological CRT response. Significance was set at p < 0.05.
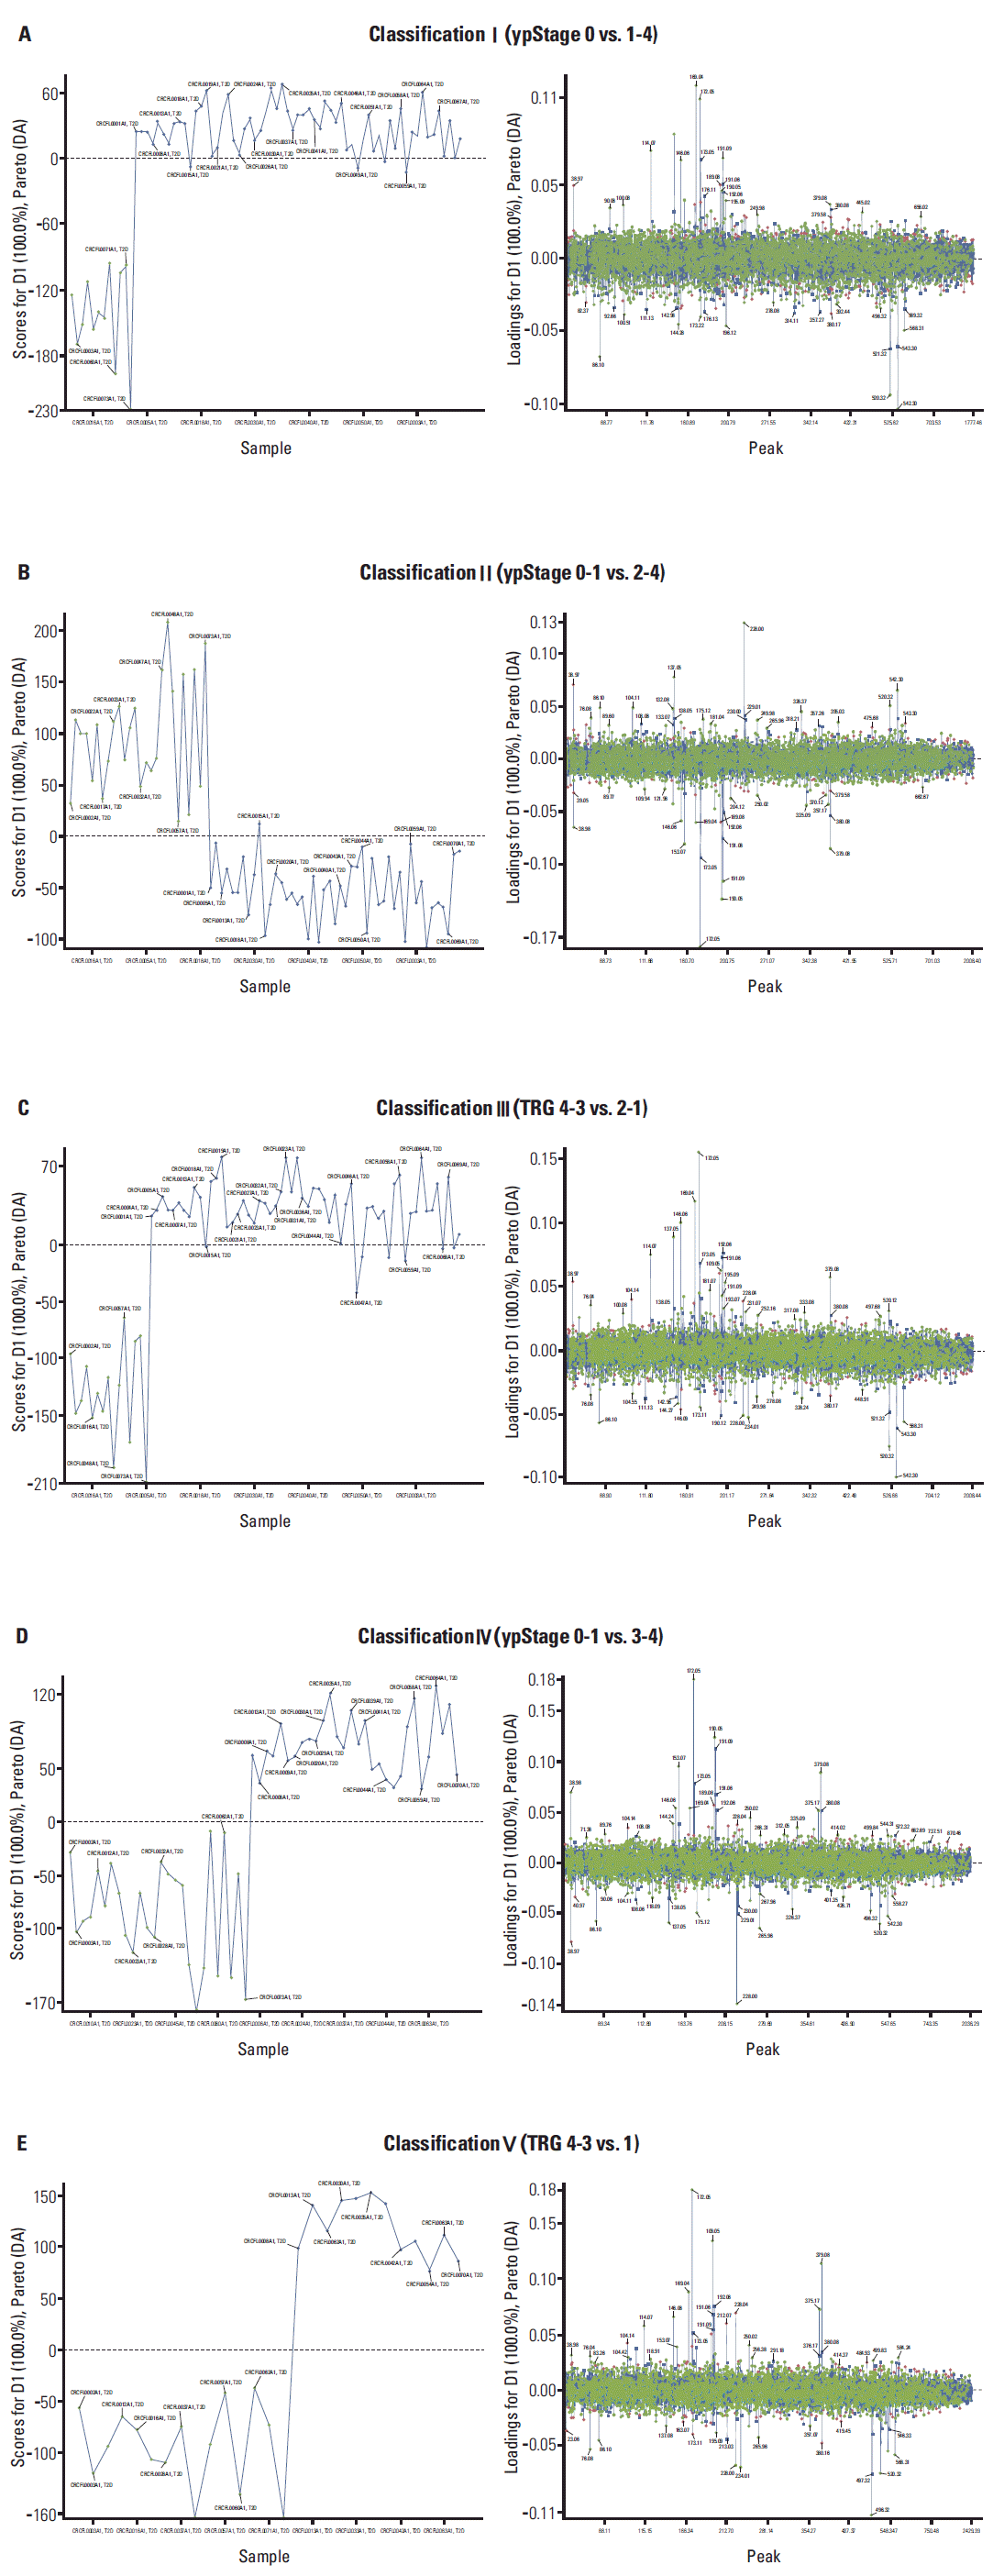
Results1. PCA-DA of LMIs in serum of rectal cancer patientsMass-to-charge (m/z) and peak intensity information on LMIs in serum were determined by MALDI-MS analysis and used in MarkerView statistical software for PCA-DA. Supervised PCA-DA clearly separated each patient group according to five classifications of CRT response (Fig. 1A-E, left panels). For selection of LMIs that significantly contributed to separating each classification, the loading values (weighting factors) of individual LMIs were calculated (Fig. 1A-E, right panels).
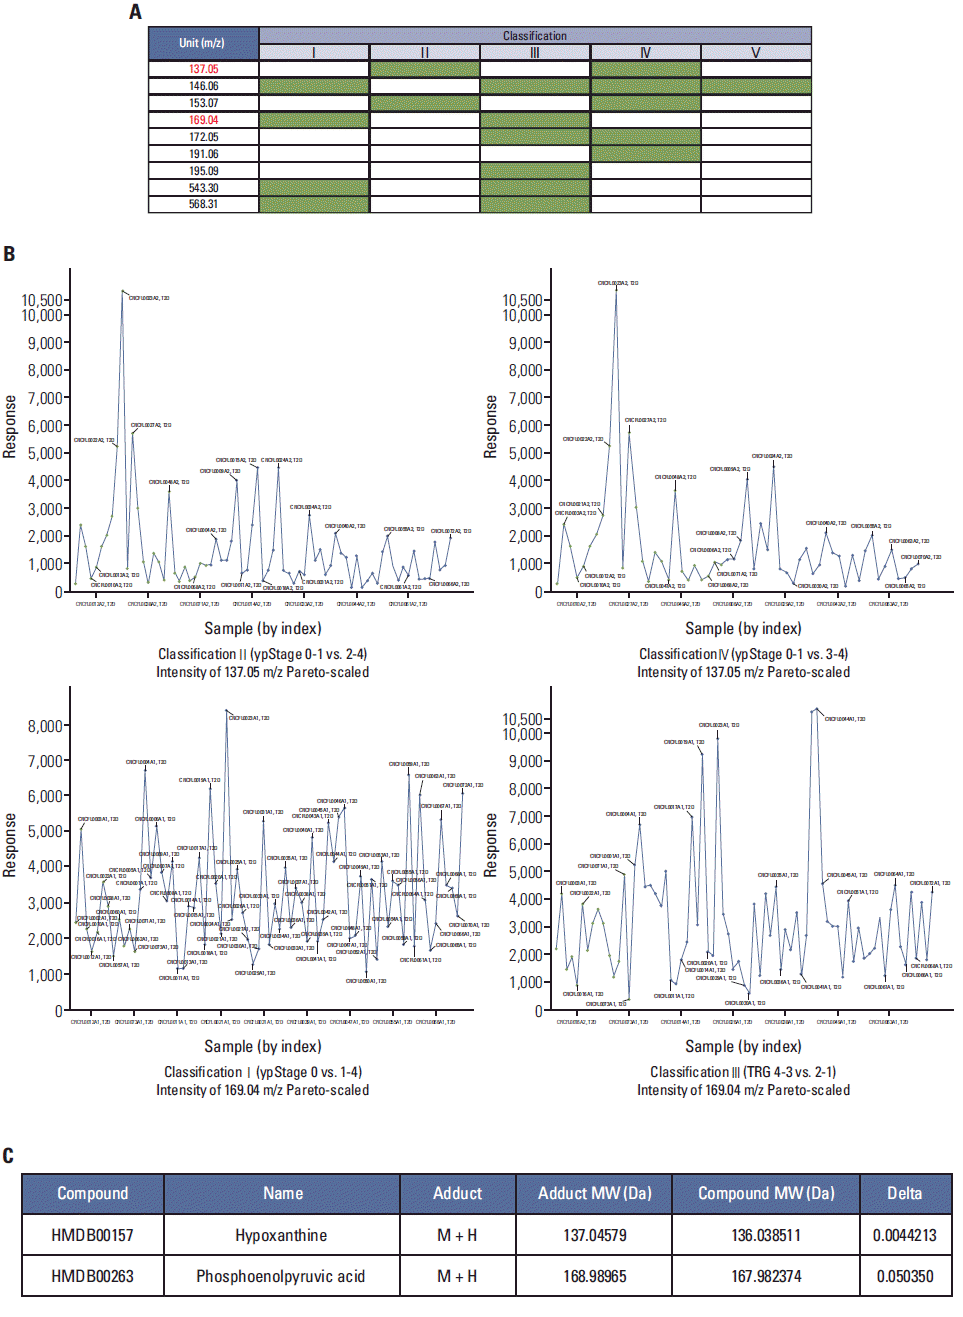
2. Selection and identification of LMIs with higher power for discriminating CRT responsesPCA-DA using LMI information (i.e., mass-to-charge [m/z] and peak intensity) was repeated six times in an independent manner. LMIs with higher absolute values of weighting factors (> 0.05) were selected as candidate metabolites having the ability to discriminate CRT responses. Nine LMIs were finally selected (Fig. 2A).
Among these nine LMIs, the LMI with 137.05 m/z showed significantly higher normalized peak intensity (response) in serum from patients with ypStage 0-1 compared to ypStage 2-4 (classification II) and 3-4 (classification IV), respectively (Fig. 2B, upper panels). Conversely, the LMI with 169.04 m/z ion showed significantly lower normalized peak intensity in serum from patients with ypStage 0 and TRG 4-3 compared to ypStage 1-4 (classification I) and TRG 2-1 (classification III), respectively (Fig. 2B, lower panels).
Candidate metabolites with 137.05 and 169.04 m/z were searched using the Human Metabolome Database (HMDB). Among the metabolites found using a mass tolerance of ± 0.05 (137.05 and 169.04 m/z were rounded off to three decimal places), two metabolites, HX and PEP, appeared as an M+H adduct LMI in positive mode MS analysis (Fig. 2C). electrospray ionization-MS/MS analysis was also performed as described in our previous study [4] for identification of LMIs with 137.05 and 169.04 m/z by comparing the MS/MS patterns of standard HX and PEP (data not shown).
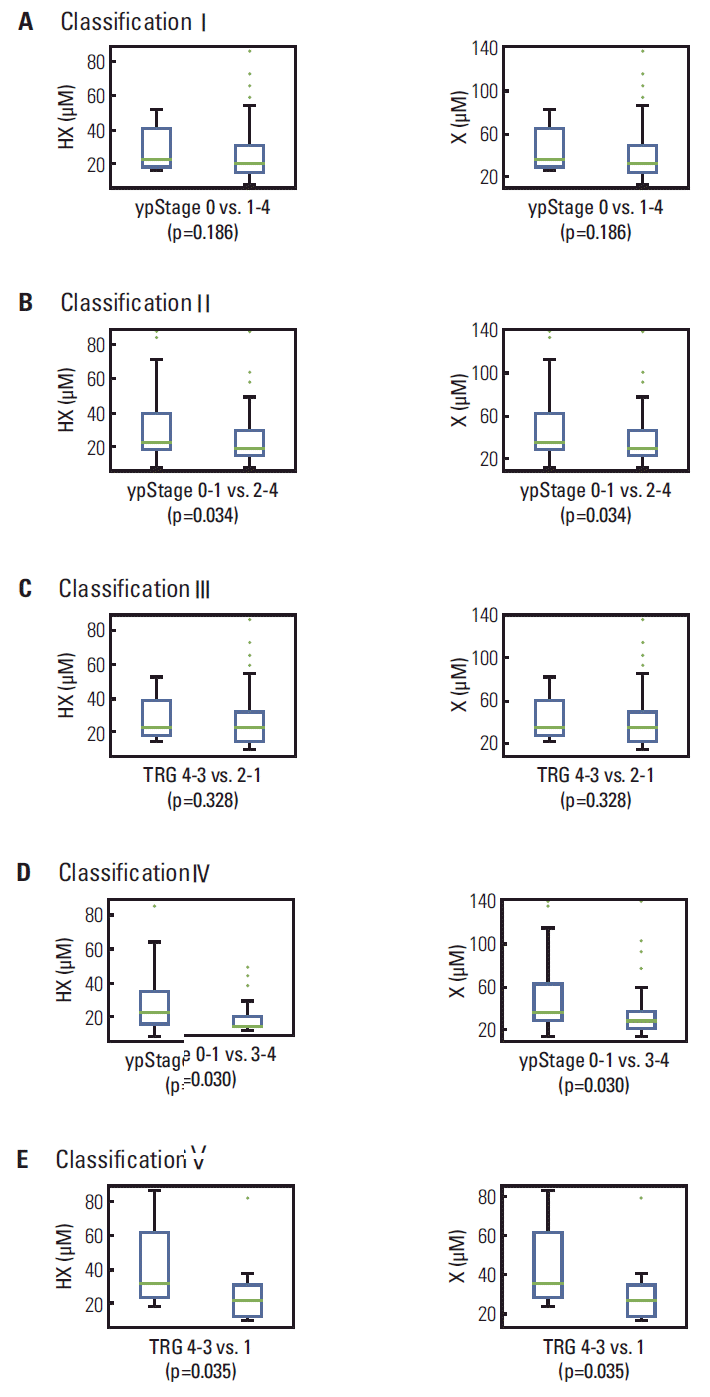
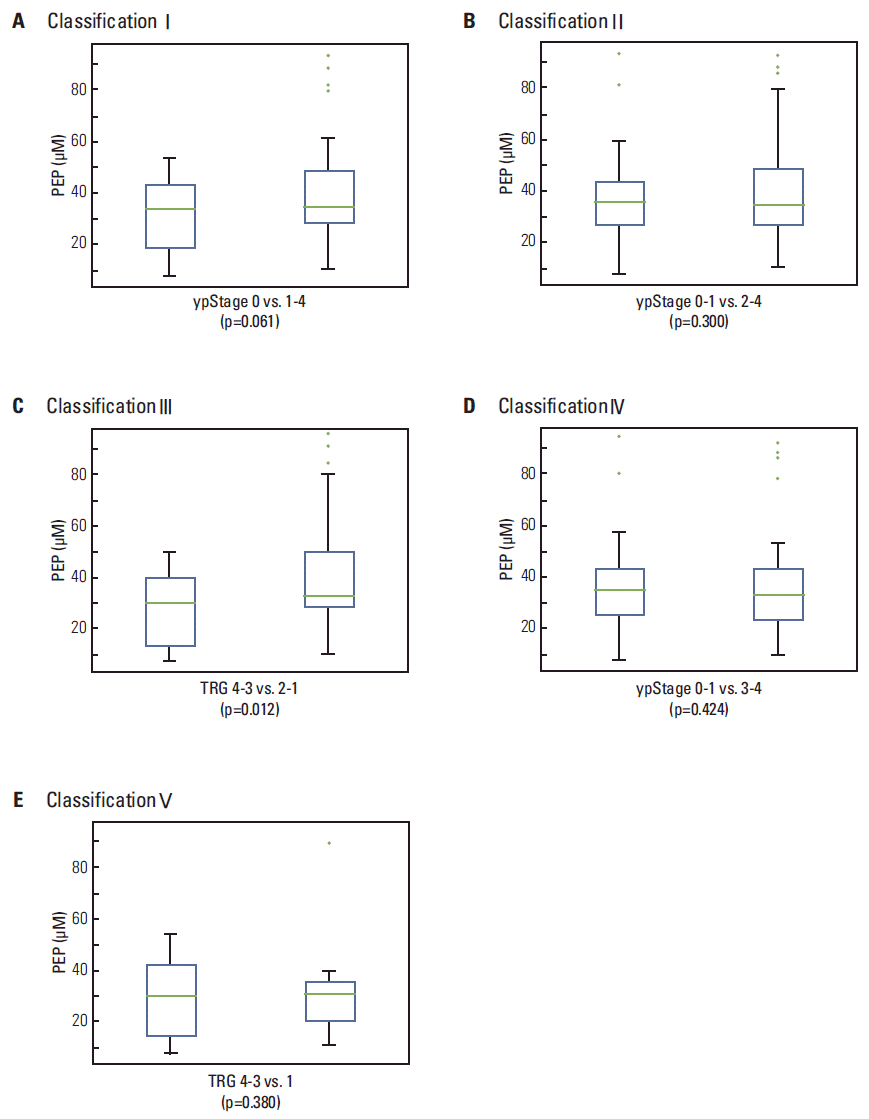
3. Differential levels of HX and PEP according to CRT responsesThe levels of HX, X, and PEP were determined in sera from rectal cancer patients. Significantly higher levels of HX (Fig. 3A-E, left panels) and its oxidative product, X (Fig. 3A-E, right panel), were observed in patients with ypStage 0-1 compared to ypStage 2-4 (p=0.034) or 3-4 (p=0.030). This increase was also observed in TRG 4-3 compared to TRG 1 (p=0.035) (Fig. 3B, D, and E). In contrast, a significantly lower PEP level was observed in patients with TRG 4-3 compared to TRG 2-1 (p=0.012) (Fig. 4C); this difference was also observed between ypStage 0 and ypStage 1-4, but with marginal significance (p=0.061) (Fig. 4A).
The ROC analysis showed significant cutoff thresholds of HX and X discriminating classification IV and V of pathological CRT response: classification IV, threshold=16.7 μM for HX or 26.6 μM for X, area under the ROC curve=0.655, p=0.040; classification V, threshold=15.5 μM for HX or 24.8 μM for X, area under the ROC curve=0.733, p=0.025. Significant cutoff thresholds were not manifested regarding PEP levels. The distribution of clinical parameters (age, sex, cT or cN stage, and serum carcinoembryonic antigen level) did not differ according to HX or H thresholds (Table 1). Patient grouping according to the thresholds of HX (16.0 μM) or X (25.0 μM) showed significant association with classification IV and V of pathological CRT response (Table 2).
DiscussionMany studies have indicated that pathologically assessed tumor response to preoperative CRT can be an indicator of short-term treatment response, as well as a surrogate marker of the long-term outcome of LARC patients [3]. With regard to ypStage, we categorized pathological CRT response as ypStage 0 versus 1-4, or ypStage 0-1 versus 2-4. According to Maas et al. [7], who performed a pooled analysis of individual patient data from several centers, 484 of 3,105 LARC patients (15.6%) showed post-CRT ypCR (ypStage 0). After a median follow-up period of four years, the 5-year crude disease-free survival (DFS) was 83.3% for patients with ypCR and 65.6% for those without ypCR (p < 0.001). Because ypN status is generally regarded as the most important prognostic factor in LARC patients receiving preoperative CRT [8], minimal residual disease in the primary tumor (ypT1-2N0: ypStage I) may not confer a significantly different prognosis compared with ypT0N0 (ypStage 0). Moon et al. [9] reported that patients with ypT0N0, ypT1N0, and ypT2N0 cancers showed no significant difference in 5-year overall survival or 5-year DFS, suggesting that a suitable endpoint representing a good pathological CRT response would be ypStage 0-1. In addition to ypStage, the degree of microscopic tumor regression has been shown to be an important prognostic factor for the long-term outcome of LARC patients [8].
Markers predicting these pathological CRT responses before CRT can be valuable to implementing risk-adapted strategies in preoperative treatments and possibly following surgery [3,10]. Ongoing clinical trials for development of a more effective preoperative regimen for LARC patients have included newer chemotherapeutics, targeted agents, induction chemotherapy, and novel radiotherapy methods [3]. Patients who are not expected to show a favorable response to the standard regimen may be preferentially included in these trials. Conversely, tumor-localized resection or sphincter-sparing surgery may be recommended instead of standard radical surgery for selected patients who show an excellent CRT response [11]. Studies of molecular biomarkers of the response to preoperative CRT in rectal cancer have focused on tumor suppressor genes (p53, p21), apoptotic factors (Bcl-2, Bax), epidermal growth factor receptor, cyclooxygenase-2, and vascular endothelial growth factor, or microarray gene expression analysis displaying complete genomic patterns [3]. The current study is the first to demonstrate that analysis of serum LMIs may provide other valuable molecular information for early prediction of CRT response in LARC patients.
The results of PCA-DA using LMI information (i.e., m/z and intensity) clearly suggested that the patterns of favorable and poor responders to CRT differ (Fig. 1). Depending on the five classifications of pathological CRT responses, LMIs played individual roles in discriminating CRT responses (Fig. 2). Among those LMIs, two were identified as HX and PEP (Fig. 2). Higher HX concentrations were observed in patients with ypStage 0-1 than in those with ypStage 2-4 (p=0.034) or ypStage 3-4 (p=0.030), and in TRG 4-3 compared to TRG 1 (p=0.035) (Fig. 3). Because HX is continuously converted to X and uric acid by xanthine oxidase [12], X changes depending on the level of HX (Fig. 3). Significantly higher rates of favorable pathological CRT response were observed for patients with HX or X above each threshold (classification IV and V) (Table 2). Elevated HX has been reported in the plasma of patients with acute lymphoblastic leukemia or NHL [13]. Our previous study also showed that HX was elevated in the urine of patients with NHL [4]. HX is known to be associated with various cancers; a recent study found that HX and X can be urinary biomarkers of ionizing radiation exposure in nonhuman primates [14]. However, an explanation for the link between HX and CRT response in LARC remains to be elucidated.
In contrast with HX, a significantly lower level of PEP was observed in TRG 4-3 than in TRG 2-1 (p=0.012), and in ypStage 0 compared to ypStage 1-4, with marginal significance (p=0.061) (Fig. 4), although significant discrimination threshold was not observed. As the substrate for pyruvate kinase in cells, PEP is involved in glycolysis and gluconeogenesis [15,16]. In gluconeogenesis, PEP is formed by the decarboxylation of oxaloacetate and hydrolysis of one guanosine triphosphate molecule in a rate-limiting reaction catalyzed by phosphoenolpyruvate carboxykinase [17]. In glycolysis, pyruvate kinase catalyzes the conversion of PEP to pyruvate, generating one molecule of adenosine triphosphate. According to the Warburg effect, most cancer cells were observed to produce energy by glycolysis followed by lactic acid fermentation in the cytosol [18]. The isoform of pyruvate kinase, which dephosphorylates PEP to pyruvate, is highly expressed in tumors [19], and the levels of PEP related to pyruvate kinase activity appear to be important for cell proliferation [20]. However, we still do not have a complete understanding of the effect of overexpressed pyruvate kinase in cancer tissues on the level of PEP in sera from LARC patients with different CRT responses.
ConclusionThe current findings suggest that MALDI-MS profiling of LMIs in serum may be useful for predicting the CRT response in LARC patients before treatment. Findings of this study indicate that further investigation of serum LMIs is warranted in development of tailored treatments for LARC patients.
AcknowledgmentsThis work was supported by the Soonchunhyang University Research Fund, and a grant from the Bio-Signal Analysis Technology Innovation Program (2012–0006054) of the Ministry of Education, Science and Technology, Korea.
The authors thank Drs. Dae Yong Kim, Hee Jin Chang, Sun Young Kim, and Jae Hwan Oh for providing critical comments and for providing sera of rectal cancer patients from the Center for Colorectal Cancer, Hospital, National Cancer Center, Korea.
Fig. 1.Principal components analysis and discriminant analysis (PCA-DA) of low-mass-ions (LMIs). Sera from rectal cancer patients were divided into five classifications according to their chemoradiotherapy (CRT) responses. Chloroform/methanol extracts of sera were analyzed by matrix assisted laser desorption/ionization-mass spectrometry. Information (i.e., massto-charge [m/z] and mass peak intensity) on LMIs in the mass spectra was used for PCA-DA. Left panels (A-E) show the results of PCA-DA in each CRT response classification. Right panels (A-E) show the loading score (weighting factor) of each individual LMI in the five classifications. TRG, tumor regression grade. 
Fig. 2.Identification of low-mass-ions (LMIs) linked to the chemoradiotherapy (CRT) response in rectal cancer patients. (A) Nine LMIs were selected by principal components analysis and discriminant analysis as candidate metabolites significantly linked to the CRT response classification, and the classifications linked to each LMI are indicated as a yellow box. No single LMI was linked to all five classifications. (B) Response (normalized peak intensities) of LMIs with 137.05 and 169.04 m/z according to CRT responses. The response of LMIs with 137.05 m/z was higher in ypStage 0-1 compared to that of ypStage2-4 (classification II) or 3-4 (classification IV). LMIs with 169.04 m/z showed a lower response in ypStage 0 and tumor regression grade (TRG) 4-3 compared to that of ypStage1-4 (classification I) and TRG 2-1 (classification III), respectively. (C) Candidate metabolites with 137.07±0.05 and 169.04±0.05 m/z in a positivemode mass detection. The Human Metabolome Database was searched for identification of hypoxanthine and phosphoenolpyruvic acid as metabolites with 137.07±0.05 and 169.04±0.05 m/z, respectively. 
Fig. 3.Box plot showing the levels of hypoxanthine (HX) and xanthine (X) according to pathological chemoradiotherapy responses (A-E). Significantly higher levels of HX (left panel) and its oxidative product, X (right panel), were observed in ypStage 0-1 than in ypStage2-4 (B) or 3-4 (D). This significant increase was also observed in tumor regression grade (TRG) 4-3 compared to TRG 1 (E). 
Fig. 4.Box plot showing the levels of phosphoenolpyruvic acid (PEP) according to pathological chemoradiotherapy response (A-E). Significantly lower levels of PEP were observed in tumor regression grade (TRG) 4-3 than in TRG 2-1 (C), and the difference between the PEP levels ypStage 0 and ypStage 1-4 was marginally significant (A). 
Table 1.Distribution of clinical variables according to hypoxanthine (xanthine) threshold level
Table 2.Hypoxanthine (xanthine) associated with pathological CRT response
References1. Sauer R, Becker H, Hohenberger W, Rodel C, Wittekind C, Fietkau R, et al. Preoperative versus postoperative chemoradiotherapy for rectal cancer. N Engl J Med. 2004;351:1731–40.
2. Yeo SG, Kim DY, Kim TH, Chang HJ, Oh JH, Park W, et al. Pathologic complete response of primary tumor following preoperative chemoradiotherapy for locally advanced rectal cancer: long-term outcomes and prognostic significance of pathologic nodal status (KROG 09-01). Ann Surg. 2010;252:998–1004.
3. Yeo SG, Kim DY. An update on preoperative radiotherapy for locally advanced rectal cancer. J Korean Soc Coloproctol. 2012;28:179–87.
4. Yoo BC, Kong SY, Jang SG, Kim KH, Ahn SA, Park WS, et al. Identification of hypoxanthine as a urine marker for non-Hodgkin lymphoma by low-mass-ion profiling. BMC Cancer. 2010;10:55.
5. Edge S, Byrd DR, Compton CC, Fritz AG, Greene FL, Trotti A. AJCC cancer staging manual. 7th edNew York: Springer; 2010.
6. Dworak O, Keilholz L, Hoffmann A. Pathological features of rectal cancer after preoperative radiochemotherapy. Int J Colorectal Dis. 1997;12:19–23.
7. Maas M, Nelemans PJ, Valentini V, Das P, Rodel C, Kuo LJ, et al. Long-term outcome in patients with a pathological complete response after chemoradiation for rectal cancer: a pooled analysis of individual patient data. Lancet Oncol. 2010;11:835–44.
8. Kim TH, Chang HJ, Kim DY, Jung KH, Hong YS, Kim SY, et al. Pathologic nodal classification is the most discriminating prognostic factor for disease-free survival in rectal cancer patients treated with preoperative chemoradiotherapy and curative resection. Int J Radiat Oncol Biol Phys. 2010;77:1158–65.
9. Moon SH, Kim DY, Park JW, Oh JH, Chang HJ, Kim SY, et al. Can the new American Joint Committee on Cancer staging system predict survival in rectal cancer patients treated with curative surgery following preoperative chemoradiotherapy? Cancer. 2012;118:4961–8.
10. Choi CH, Kim WD, Lee SJ, Park WY. Clinical predictive factors of pathologic tumor response after preoperative chemoradiotherapy in rectal cancer. Radiat Oncol J. 2012;30:99–107.
11. Yeo SG, Kim DY, Kim TH, Kim SY, Chang HJ, Park JW, et al. Local excision following pre-operative chemoradiotherapyinduced downstaging for selected cT3 distal rectal cancer. Jpn J Clin Oncol. 2010;40:754–60.
12. Vasiliou V, Sandoval M, Backos DS, Jackson BC, Chen Y, Reigan P, et al. ALDH16A1 is a novel non-catalytic enzyme that may be involved in the etiology of gout via proteinprotein interactions with HPRT1. Chem Biol Interact. 2013;202:22–31.
13. Hashimoto H, Kubota M, Shimizu T, Kasai Y, Sano H, Adachi S, et al. Effect of high-dose methotrexate on plasma hypoxanthine and uridine levels in patients with acute leukemia or non-Hodgkin lymphoma in childhood. Leukemia. 1992;6:1199–202.
14. Johnson CH, Patterson AD, Krausz KW, Kalinich JF, Tyburski JB, Kang DW, et al. Radiation metabolomics. 5. Identification of urinary biomarkers of ionizing radiation exposure in nonhuman primates by mass spectrometry-based metabolomics. Radiat Res. 2012;178:328–40.
15. Cooper RA, Kornberg HL. The direct synthesis of phosphoenolpyruvate from pyruvate by Escherichia coli. Proc R Soc Lond B Biol Sci. 1967;168:263–80.
16. Hansen EJ, Juni E. Two routes for synthesis of phosphoenolpyruvate from C4-dicarboxylic acids in Escherichia coli. Biochem Biophys Res Commun. 1974;59:1204–10.
17. Utter MF, Kurahashi K. Purification of oxalacetic carboxylase from chicken liver. J Biol Chem. 1954;207:787–802.
|
|
|||||||||||||||||||||||||||||||||||||||||||||||||||||||||||||||||||||||||||||||||||||||||||||||||||||||||||||||||||||||||||||||||||||||||||||||||||||||||||||||||||||||||||||||||||||||||||||||||||||||||||||||||||||||||||||||||||||||||||||||||||||||