Introduction
Almost all types of differentiated cells can become cancerous by the process of cell change, which is termed transformation, and during this process, a cell loses its ability to control its rate of division. The transformed cells differ from their normal counterparts in several respects including immortalization, the loss of contact inhibition, their invasiveness and their loss of anchorage dependence. Oncogene activation plays a very important role in cell transformation. Especially, active H-ras initiates a wide spectrum of other biological responses through multiple downstream effectors that exist in a subcellular membrane compartmentalization-based signaling system (1). Mutations in the ras oncogene have been frequently observed in human cancer cell (2,3).
The activation of Raf-1 is typically initiated by its interaction with Ras, which leads to the initiation of Raf-1 activation (4). Additionally, Ras binding promotes conformational changes that relieve Raf-1's autoinhibition and they facilitate the phosphorylation of activating sites (5). Compared to the detailed data collected on the Raf-1 activation process, the mechanism that's responsible for Raf-1 inactivation after signaling events is rather poorly understood. One potent inhibitor of the Raf-1/MAP kinase pathway is the Sprouty (Spry) protein (6,7). Mammalian genomes each contain 4 SPRY genes (SPRY 1~4) that encode proteins that show sequence divergence at their amino termini. It is possible that this sequence divergence dictates the genes' differential functions by potentially mediating distinct protein-protein interactions (8). We recently reported that Sprouty2 knockdown decreased the ability of PP2, a Src tyrosine kinase inhibitor, to enhance PMA/H2O2 activation of Raf-1 (9).
Here we investigated the difference in cellular signaling between the parent cells and its v-Ha-ras transformed NIH 3T3 cells, with focusing on the Ras-Raf-1 signaling pathway. The results presented here suggest that the transformation of a normal cell to a cell capable of forming a cancerous growth arises from the failure of negative feedback regulation of Raf-1 kinase, which results in abnormally sustained and elevated proliferative signals.
Materials And Methods
1. Materials
The mouse monoclonal anti-Raf (E-10) was obtained from Santa Cruz Biotechnology (Santa Cruz, CA), while the anti-phospho-MEK (Ser217/221) was obtained from Cell Signaling Technology (Denvers, MA). Dulbecco's modified Eagle's medium (DMEM), fetal calf serum and penicillin-streptomycin were purchased from GIBCO-Invitrogen (Carlsbad, CA). The reagents for SDS-polyacrylamide gel electrophoresis were from Bio-Rad (Hercules, CA). The PP2 (4-amino-5-(4-chloro-phenyl)-7-(t-butyl)pyrazolo [3,4-d]pyrimidine) was purchased from Calbiochem (San Diego, CA). Phorbol 12-myristate 13-acetate (PMA) and H2O2 were obtained from Sigma (St. Louis, MO).
2. Mammalian cell culture and chemical treatment
The parental NIH 3T3 fibroblasts and their v-Ha-ras transformed NIH 3T3 fibroblasts were maintained at 37℃ in DMEM supplemented with 10% fetal bovine serum, 100 units of penicillin/streptomycin and 2 mM glutamine. For experimental purposes, the cells were cultured in 100-mm tissue culture dishes until they reached about 80% confluency. PMA and PP2 were dissolved in DMSO and they were freshly diluted for each experiment. The DMSO concentrations were less than 0.1% in all the experiments.
3. siRNA transient transfection
Where indicated, the cells were transiently transfected with Spry4 siRNA. The following siRNA was used for the Spry4 knockdowns: CUGUACUAAUGAGGAUGAUdTdT. A non-targeting siRNA (Santa Cruz Biotechnology, CA) was used as a control. The siRNA transfections were performed by using Lipofectamine 2000 (Invitrogen) in Opti-minimal essential medium I (Invitrogen) according to the manufacturer's protocol with a final siRNA concentration of 40 nM. After 24 h, the transfected cells were plated for a cell growth assay. The knock-down efficiencies of siRNA were confirmed by determining the decreases in the levels of the Spry4 protein expression.
4. Cell proliferation assay and in vitro cell transformation
The cell proliferation reagent WST-1 was used for the quantitative determination of cellular proliferation (Roche Molecular Biochemicals, Germany). For the proliferation assays, the cells were plated in quadruplicate into 96-well microliter plates (Costar, Cambridge, MA) at 5×10³ cells/well and the cells were cultivated for 24 h, prior to addition of PP2. The cells were then treated with the test articles at 37℃ in a humidified 5% CO2/95% air incubator. After incubation for 1~3 days, the cells were incubated for additional 4 h in the presence of a WST-1 labeling mixture (10 µL per well). The absorbance of the samples, against a background control (medium alone) as a blank, was measured at 450 nm with using a microliter plate (ELISA) reader (Molecular Devices, Sunnyvale CA). To observe formation of foci of the parent cells and their v-Ha-Ras transformed NIH 3T3 fibroblasts, actively growing cells were seeded at a density of 104 cells/60-mm dish. The culture medium was replaced with fresh medium and the medium was changed twice a week during the following 5 weeks. Morphological transformation was determined under a dissecting microscope.
5. Preparation of cell lysates
The indicated treatments of cells were carried out at 37℃ in serum-free medium, as described in the figure legends. Following the treatment, whole cell lysates were prepared as follows. The cells were washed twice with ice-cold phosphate-buffered saline (PBS) and they were harvested by scraping the cells into lysis buffer (20 mM Tris, pH 8.0, 150 mM NaCl, 1% Triton X-100, 2 mM EDTA, 1 mM phenylmethylsulfonyl fluoride, 20 µg/ml aprotinin, 10 µg/ml leupeptin, 20 mM β-glycerophosphate and 2 mM NaF). The cell lysates were clarified by centrifugation at 15,000×g for 10 minutes at 4℃, and the protein concentrations were determined with using a BCA protein assay reagent kit (Pierce; Rockford, IL).
6. Immunoblot analysis
The whole cell lysates were denatured in Laemmli sample buffer, and they were resolved on SDS-polyacrylamide gel. The proteins were transferred to nitrocellulose membranes, and immunoblot analysis was performed using the appropriate primary antibodies. The immune complexes on the nitrocellulose membrane were detected by the ECL-Plus chemiluminescent system (Amersham Pharmacia Biotech, Piscataway, NJ). The fluorescent images were captured using a KODAK Image Station 4000R (Carestream Health, Inc., Rochester, NY).
Results
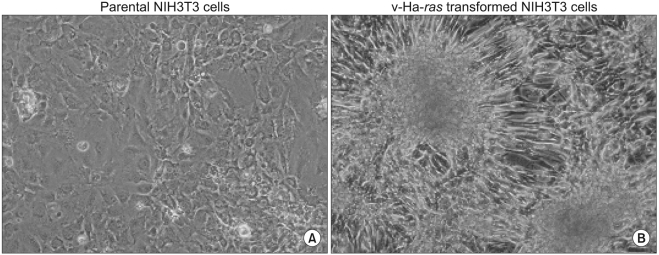
1. The formation of foci by the v-Ha-ras transformed cells
In order to observe transformed foci of cells that showed high cell density and aberrant cell morphology on a confluent monolayer, the parental and v-Ha-ras transformed cells were maintained by only renewing the medium without passages during the 5 weeks. The long-term culture of v-Ha-ras transformed cells resulted in the formation of morphologically transformed foci, which was determined based on the foci having crisscrossed margins, piling up properties and invasiveness (Fig. 1A). The non-transformed parental NIH 3T3 cells maintained the characteristic of growing in monolayer and the cells showed contact inhibition when the cells came in close proximity to each other (Fig. 1B).
2. The effect of PP2, a potent and selective inhibitor of the Src-family of tyrosine kinases, on cell proliferation
Ras has been shown to recruit Raf-1 to the plasma membrane to be activated by phosphorylation of tyrosine 341 of Raf-1 kinase, and the phosphorylation was carried out by the Src family of tyrosine kinases (10). PP2 (4-amino-5-(4-chloro-phenyl)-7-(t-butyl)pyrazolo [3,4-d]pyrimidine) is a potent inhibitor of the Src family of tyrosine kinases (11). To evaluate the ability of PP2 to alter the proliferation of the parental and v-Ha-ras-transformed NIH 3T3 cells, those cells were grown on a 96-well plate and the numbers of viable cells were quantified using a colorimetric assay. As shown in Fig. 2A, PP2 induced growth arrest and the senescence-like phenotypes of both the parental and v-Ha-ras-transformed cells 8 day after treatment. Interestingly, the parental cells were found to be significantly more sensitive to treatment of PP2 than were the v-Ha-ras-transformed cells at earlier times after the PP2 treatment (Fig. 2B).
3. The differential activation of Raf-1 kinase in the parental and v-Ha-ras-transformed cells
Next, we checked the differential activation of Raf-1 kinase, which is the cellular homolog of v-Raf, the product of the transforming gene of the murine sarcoma virus 3611 (12), in the parental and v-Ha-ras-transformed NIH 3T3 cells. In general, hyperphosphorylation has been suggested to play a role in the shift in electrophoretic mobility of activated Raf-1 on SDS-polyacrylamide gels (13). Our previous reports showed the stimulatory effect of PP2 on the synergistic activation of Raf-1 by H2O2/PMA in the parental and v-Ha-ras-transformed NIH 3T3 cells (14). However, PP2 produced an inhibition of H2O2/PMA-induced Raf-1 electrophoretic mobility in the parental cells, whereas PP2 had no inhibitory effects in the v-Ha-ras-transformed NIH 3T3 cells (Fig. 3A). Since Raf-1 functions as an upstream activator in the MAPK kinase cascade, including MEK-1, we investigated whether MEK-1 might also be differentially activated in the parental and v-Ha-ras-transformed cells (Fig. 3B). As expected, the simultaneous treatment of PMA and H2O2 significantly increased the phosphorylation of MEK-1 in both of the cell lines. There were no differences between the untreated and PP2-treated cells for MEK-1 phosphorylations. However, siRNA-mediated knockdown of Spry4, which has been suggested to function as a negative regulator of the MAPK pathway by interacting with Raf-1 (6), enhanced MEK-1 phosphorylation in the parental cells, but not in the v-Ha-ras-transformed cells. It is possible that the Raf-1 kinase of the v-Ha-ras-transformed cells might not be affected by the expressed level of Sprouty proteins.
4. Modulation of proliferation with different kinase inhibitors in the parental and v-Ha-ras transformed cells
In general, cellular signaling is usually regulated by a temporary alteration in the kinase-phosphatase balance. Thus, several inhibitors of protein kinase and phosphatase were tested to determine the relative effects on cellular proliferation. As shown in Fig. 4, the apparent inhibition of proliferation of both cell lines was observed with treatment by the inhibitors, except for cypermethrin (an inhibitor of protein phosphatase 2B (PP2B)) and dephostatin (a tyrosine phosphatase inhibitor). The proliferations of the parental and v-Ha-ras transformed cells were not affected by cypermethrin and dephostatin at concentrations that affected protein phosphatase 2B (PP2B) and the tyrosine phosphatase activities, respectively, 2 day after treatment. Most interestingly, dephostatin strongly inhibited the proliferation of the v-Ha-ras transformed cells compared to that of the parental cells 3 day after treatment. These results imply an inhibitory role for tyrosine phosphatase that is specific to the signaling pathway in the v-Ha-ras transformed cells.
Discussion
All cancer cells acquire the ability to grow and divide in the absence of appropriate inhibitory signals and the concomitant activation of proto-oncogenes such as H-ras and Src. Cancer cells display a characteristic set of features that distinguish them from normal cells. Especially, due to the ability of cancer cells to form a tumor mass and eventually to metastasize to other parts of the body, cancer is one of the most threatening diseases to humans. Here we investigated some of the capabilities that must be acquired by the tumors as a whole to enable them to grow and spread, and we did so by using the NIH 3T3 cells that were transformed by transfection with the v-Ha-ras oncogene. The v-Ha-ras transformed cells clearly showed morphologically transformed foci of cells with the characteristics of crisscrossed margins, piling up properties and invasiveness after 5-weeks incubation without passages.
It has been widely known that Raf-1, pp60src and p21ras all play important roles in the transfer of signals from the cell surface to the nucleus (15). The constitutive kinase activity of the v-Raf protein has been implicated in both transformation and mitogenesis (12). The coexpression of either pp6Vv-src or p21v-ras was found to increase the kinase activity of Raf-1 (16). Here we found that a potent inhibitor of the Src family of tyrosine kinases, PP2, induced growth arrest and the senescence-like phenotypes both in the parental and v-Ha-ras-transformed cells 8 day after treatment. However, the parental cells were found to be significantly more sensitive to PP2 treatment than were the v-Ha-ras-transformed cells at earlier times after PP2 treatment. Reactive oxygen species (ROS) are key mediators of the in vitro and in vivo v-Src tumorigenic properties (17). Notably, the v-Ha-ras transformed cells used in this study produce high levels of reactive oxygen species (ROS) (18,19), which may serve to transiently inactivate intracellular protein tyrosine phosphatase (PTPase), and this allows for a temporary alteration in the kinase-phosphatase balance (20). Therefore, it is possible that in the v-Ha-ras transformed cell, the inactivation of the protein tyrosine phosphatase by ROS might lead to the highly activated state of Src tyrosine kinase, which can be resistant to PP2. Furthermore, the Raf-1 kinase of the v-Ha-ras-transformed cells was not affected by the expressed level of Sprouty proteins, which are a negative regulator of the MAPK pathway, as evidenced by the failure of siRNA-mediated knockdown of Spry4 to enhance Raf-1 activation. It is of interest that Raf-1 is resistant to negative feedback regulation by Sprouty proteins in the v-Ha-ras transformed cells.
Dephostatin (a tyrosine phosphatase inhibitor) strongly inhibited the proliferation of v-Ha-ras transformed cells 2 day after treatment, whereas it had only a small effect on the parental cell proliferation, implying an inhibitory role for phosphatase that is specific to the signaling pathway in the v-Ha-ras transformed cells. Our previous reports showed that dephostatin had an enhancing effect on the synergistic activation of Raf-1 kinase by PMA/H2O2 in the v-Ha-ras transformed cells (21). Tyrosine phosphatase is a sensitive target for inhibition by reactive oxygen species (22). Thus, the inhibition of tyrosine phosphatase that's mediated by the combination of dephostatin and a high level of ROS in the v-Ha-ras transformed cells is likely to induce the sustained activation of Raf-1 kinase. Actually, many laboratories have reported that the sustained expression of activated Ras or its downstream effector Raf-1 can lead to cell cycle arrest or senescence in many cell types (23-25). Thus, the induction of growth arrest through the hyper-activation of a Raf-1 kinase like dephostatin seems to be a good approach for developing anticancer drugs. Undoubtedly more work is necessary to determine the precise mechanism by which the activity of oncogenic protein is affected by negative regulators. We are currently examining the interaction between Sprouty proteins and the phosphorylation of Raf-1 kinase with respect to cell growth in NIH3T3 cells.
Conclusion
Taken together, this study revealed several characteristics that are specific to v-Ha-ras transformed cells. (1) The sustained activation of oncogene proteins due to the inactivation of tyrosine phosphatase and (2) the acquirement of resistance of Raf-1 kinase to negative feedback regulation through Sprouty proteins.